Algorand ALGO USDT Upcoming TAKE PROFIT POINTSHi Traders, Investors and Speculators of Charts📈📉
New Year 2026 loading....🥂🥳
Algorand is a decentralized network built to solve the Blockchain Trilemma of achieving speed, security, and decentralization simultaneously.
Algorand is designed to be a payments-focused network with rapid transactions and a strong focus on achieving near-instant finality which aims to be processing over 1,000 transactions per second (TPS) and achieving transaction finality in less than five seconds.
As a public smart contract blockchain that relies on staking, Algorand is also capable of hosting decentralized application (dApp) development and providing scalability. Rising gas fees on Ethereum have led many dApp developers and decentralized finance (DeFi) traders to look for alternative blockchain solutions. Algorand is capable of managing the high-throughput requirements of widespread global usage and a variety of use cases.
Technical Chart Analysis:
Algorand is still "in prison", but holding the 50d Moving Averages is the first step towards a new bullish cycle. Look at all of this upside potential!
Technical indicator Analysis:
If ALGO can get back ABOVE the 50d moving averages (0,18), that is when we can expect to see some serious bullish/parabolic price action.
You don't have to wait until then to trade algo. In the daily timeframe, there are some great setups for those who have a bit of patience, with low buy and high sells from 15% - 30% over a few weeks (in both shorts and longs).
Tis market is still moving, even though it doesn't neccesarily seem like it from a macro outlook.
Moving Averages

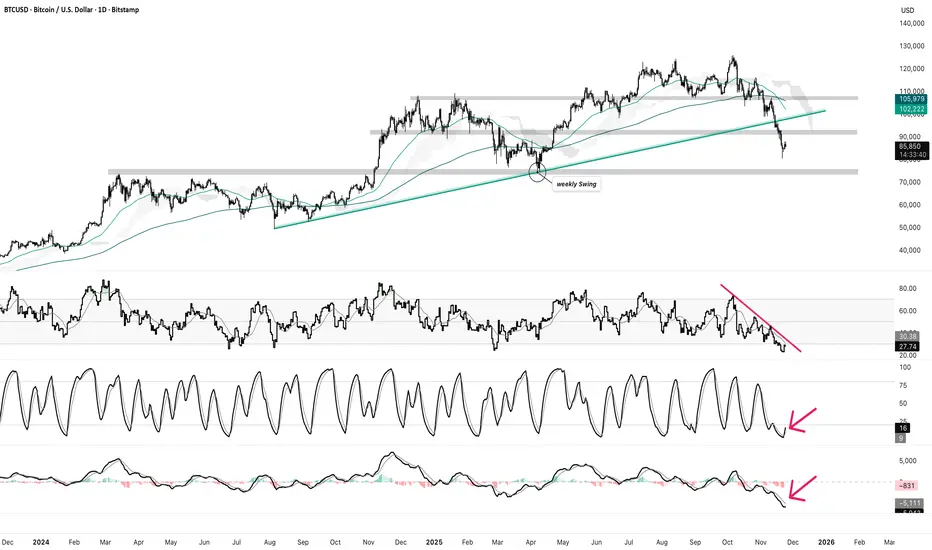
A Relief Rally Is Coming for BitcoinTo keep things simple, based on the oversold situation of DSS Bressert, RSI and MACD on the daily timeframe, it is obvious that a relief rally is certain at this point. The plummet of the "fear and greed" index is also of note. A bullish break of RSI should give the trigger to enter long with a stop below the "weekly swing" and risk being managed as always.
#NFA and always #DYOR
Gold - Triangle Squeeze Before the Next Major MoveGold is currently consolidating inside a symmetrical triangle, right after a massive bullish rally. This compression pattern typically precedes a strong breakout — and based on market structure, the bullish scenario is more probable.
Bullish Scenario (Primary Outlook)
If price breaks above the triangle resistance and confirms:
Targets (Bullish):
$4,250
$4,380
$4,500 (extended target)
Stop Loss (for long position):
• $3,940
(Below triangle support + below 50-day SMA)
Bearish Scenario (Alternative)
If gold loses triangle support:
Targets (Bearish):
$3,950
$3,880
$3,800 (major support)
Stop Loss (for short position):
• $4,120
(Above triangle resistance)
Summary
Gold is tightening inside a symmetrical triangle and preparing for a decisive move.
Trend bias remains bullish, and a breakout could send XAUUSD toward new highs above $4,400.

MU – Trend Still Intact, EMA50 Bounce SetupMU - CURRENT PRICE : 220.00 - 222.00
Technical Reasons (Bullish Bias)
1️⃣ Price retesting strong dynamic support
Price is holding above the 50-day EMA, which has acted as support throughout the uptrend. Pullback into EMA50 often forms a bullish continuation point.
2️⃣ Price still above the Ichimoku Cloud
Price is trading above the cloud, meaning long-term trend remains bullish. The cloud is thick — showing strong trend support. Latest pullback is testing the top of the cloud, usually a high-probability bounce area.
3️⃣ RSI turning up from mid-zone (not overbought)
RSI is around 50, which is a healthy reset in an uptrend. No overbought conditions → room for upside continuation.
4️⃣ Trend structure remains bullish
Higher highs & higher lows remain intact. Current candle shows buying interest at key support.
5️⃣ Market respects previous breakout area
Price pulled back to retest September–October breakout zone → classic break-and-retest setup.
ENTRY PRICE : 218.00 - 222.00
FIRST TARGET : 236.00
SECOND TARGET 260.00
SUPPORT : 201.00

This Signal Has Called Every Bitcoin Top Since 2015I hate to be this guy but history repeats and we cannot fight history if its a obvious re occurrence.
Recently, Bitcoin has hit its 1,065 day timeline of the bull market.
Every time we hit this timeline from bottom wick to top wick we always meet with the 20 MA then have a short lived relief rally before plummeting into a bear market.
When this happens, indexes tend to have a correction/recession of some sort.
As I predicted 1 month ago I was going to be bearish from this point until late 2026-early 2027.
Well the 1,065 day hit and since then I haven't been wrong so far.
I do expect a slight relief rally before we fully plummet but we will not be seeing any all times highs any time soon for Bitcoin (In my opinion.)
If we do then you can come back and call me wrong, that's why we trade. It's to learn from our mistakes and improve them.
Now would be a great time to look for a relief rally to short the top wicks before its too late and ride the wave down.
Good Luck Everyone.
(THIS IS NOT FINANCIAL ADVICE, DYOR!)

INTA // Most importantly, if the Chikou span rises above the cloud and the prices close above the cloud at least 3 times, the possibility of the movement starting is high.

DASH //If we cannot hold on to the upper band of the cloud, we can follow it with the lower band as our second support point.

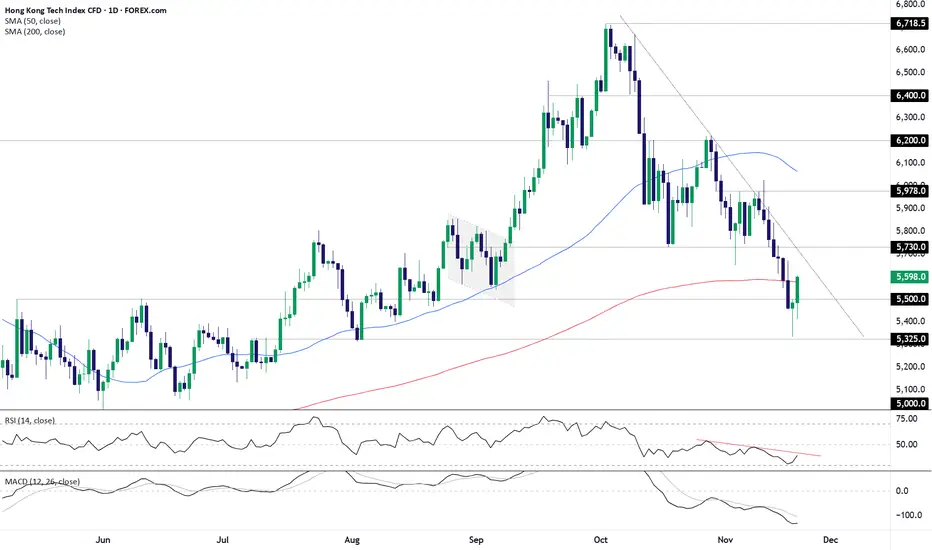
Hang Seng Tech eyes breakout as Alibaba takes the stage
Is the rout in Hang Seng Tech coming to an end? That’s the question traders should be pondering today following the rapid rebound of recent days, seeing the index recover from multi-month lows to trade above the important 200-day simple moving average. It will be important on Tuesday, providing a level to build setups around depending on how the price action evolves during the session.
Before looking at potential ideas, the message from RSI (14) and MACD remains entirely bearish, with the former trending lower beneath the neutral 50 level while the latter sits at depressed levels having already staged a bearish crossover of the signal line earlier this month. With the 50-day moving average curling lower and the price in a clear downtrend, the broader message favours short setups over long.
Given that backdrop, an inability for the index to sustain its push above the 200DMA would generate a potential short setup, allowing for positions to be established beneath it with a stop above for protection. 5500 acted as both support and resistance earlier this year, making it screen as a possible initial target. If it were to be broken, 5325—where the index slide stalled on Friday—would be the next after that.
While bearish setups are favoured, it doesn’t completely dismiss the case for countertrend longs should the index continue to trade above the important 200DMA. If the breakout sticks, longs could be set above it with a stop beneath for protection, targeting the October downtrend and/or 5730 resistance. If those levels were to be broken cleanly, it would hint at the start of a new trend, opening the way to higher levels such as 5978, the 50DMA or 6200.
Alibaba will release its earnings before the U.S. open on Tuesday, with the conference call scheduled for 7:30 a.m. Eastern Time (8:30 p.m. Hong Kong Time).
Exivara24: Bitcoin Weakens – Liquidity Drains, Demand ReversesBitcoin continues to face heavy pressure. Over the past two weeks, the market has experienced a sharp liquidity outflow and a simultaneous reversal of all the major capital inflow channels that were previously pushing price upward. At Exivara24, we are detecting an alarming synchronization of three key factors that is now dictating sentiment for both retail traders and institutions.
The three main demand engines are reversing at the same time
ETF outflow pressure stronger than expected
Spot Bitcoin ETFs (especially U.S. and European) have been recording consistent selling for the third straight week. Net outflows over the last 10 days exceeded $1.18 billion – the largest figure since May 2025. When ETFs shrink their balances, they directly pull capital out of the market, reducing order-book depth and amplifying volatility.
Sharp decline in DAT (Daily Active Transfers) activity
The number of daily active transfers on the Bitcoin network has fallen 34 % compared to October averages. This is a direct indicator of real network usage: fewer transfers = less capital rotation = weakening organic demand.
Stablecoin liquidity squeeze
The total volume of USDT and USDC held on exchanges (the primary source of “fast money”) has dropped by $2.4 billion in 14 days. Shrinking stablecoin reserves is a classic precursor to deeper and sharper price moves, as most margin buying is funded from these reserves.
Why this matters right now
When all three demand drivers reverse simultaneously, the market shifts into “thin liquidity” mode.
Any additional pressure (ETF outflows, whale selling, or macro-negative news) now triggers much stronger and faster price reactions than during periods of high liquidity.
What Exivara24 internal analytics show
Order-book depth on the top 5 exchanges is down 38–42 % versus October
Average BTC/USDT spread has widened from 0.008 % to 0.024 %
4-hour candle volatility has increased 61 % – every move is now “stretched”
Short-term scenarios from Exivara24
Base scenario (58 % probability)
Continued liquidity squeeze → test of $80,000 – $82,000 in the next 7–12 days → gradual stabilization and return above $90,000 after the holidays.
Bearish scenario (31 % probability)
Accelerated ETF outflows + continued DAT decline → break of $80,000 and fast move toward $72,000–75,000 (March 2025 lows).
Bullish scenario (11 % probability)
Unexpected major inflow (e.g., new large institutional buyer announcement or Fed dovish shift) → rapid reclaim above $95,000 as early as this week.
Exivara24 recommendations right now
Reduce or completely close leveraged long positions / move to spot or stablecoins
Prepare dry powder for entries in the $80,000–84,000 range – the most probable accumulation zone
Hard stops below $79,000 (weekly close) are mandatory
Watch ETF inflows and DAT dynamics – these two metrics will give the first reversal confirmation
Final take from Exivara24 – what this means for you right now
We see a clear picture: Bitcoin has entered a thin-liquidity stress phase, with the three key demand sources – ETFs, network activity, and stablecoins – all weakening at once.
This is not just a correction; it is structural compression that makes every price move sharper and more unpredictable.
Until these three trends reverse, downward pressure will remain dominant.
Yes, an unexpected catalyst (major institutional buyer, Fed softening, positive regulatory news) could flip the market in hours – but the current probability of that is only 11 %.
This is not the end of the bull cycle and not a “sell everything” signal.
It is a signal that easy money is gone.
The market has shifted into professional mode, where only those who:
strictly follow risk management
avoid unhedged leveraged longs
keep cash ready for buys at $80,000–84,000
are prepared for ±10–15 % swings in either direction within a day
…will survive and profit.
For us at Exivara24, this is not a crisis – it’s our normal working environment.
Our internal models switched to “liquidity stress” mode 10 days ago: we cut long exposure, strengthened hedging, and prepared client portfolios for the current conditions.
Result: average drawdown across all accounts in November is under 4.1 %, even on the worst days.
We don’t panic and we don’t get euphoric.
We just do our job: read capital flows, measure liquidity, and give you clear levels and actions.
If you want to get through this period calmly, with minimal losses (and ideally with profit on rebounds), now is the perfect time to join our real-time updates.
Full December protection & accumulation plan
Precise entry/exit levels and 24/7 alerts
Access to the private channel and morning/evening briefings

The beginning of a long bear marketWe really didn't see the expected ATH in this cycle, but we have run out of time for that.
The chart displays the top and bottom indicators I rely on, along with time measurements showing that we have simply run out of time.
This isn't an exact price prediction but rather a look at global market cycles. On a macro scale, it is evident that a market reversal has either already occurred or is imminent.

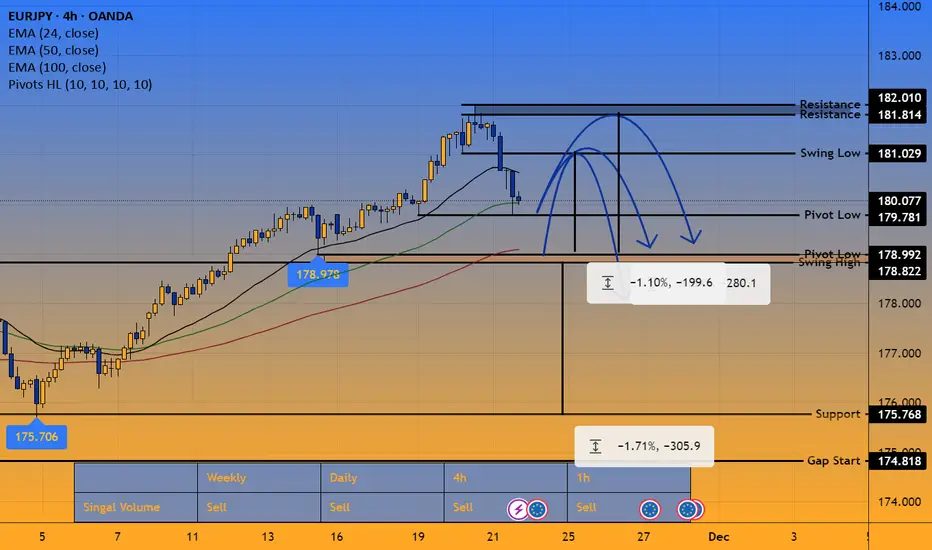
EJ Thoughts, Ideas and Forecast (1 Week)Daily:
The pair closed the week with a textbook evening star, and the best part of it the move was supported by a slightly above average volume on the narrow and then the down candle. Giving this information I suspect the price will keep falling this week at least until 178.992, where we have a swing high a pivot and also is the Fibonacci 50. There are three scenarios which I will be observing and trying to capitalise on.
1. Big pullback all the way down to 175.768
2. Smaller pullback to 178.992 followed by a re-test of the high or the formation of LH. SELL
3. Monday opens gap down, and continues down all the week
4H:
Now, at 4HTF the first line of support has been tested once during the NY session, my plan is to wait for a pull back to 181.029 to then short down to 178.992 or if it doesn't stop at the swing wait for the test of the high. If it fails to reject here and continues lower my point of reference will be the next Support at 178.990. SELL
1H:
At 1HTF the MA is already positioning to move lower, obviously before any entries, I want to see a lower high on a higher timeframe, a test of the MA on 1HTF and all of it supported by higher volume on down candles. My bias is fully bearish as I've been fallowing the bullish move for the past week closely and it wasn't supported by volume much. A break below the support area 178.822/178.992 would be dream coming true as the next support is all the way down below 176.000. SELL
The Plan:
ALL SHORTS, NOT BUYING EVEN IF IT BREAKS THE HIGH
181.029 Rejection Target 179.054
181.814 Rejection Target 179.781
178.822 Breakout target 175.768 (Only after re-test)
Disclaimer: This are notes of what I do for my self every week, but usually I just save them as Private notes so I can keep track on my weekly plan. I decided to start publicly sharing them in the hope that they can be somehow helpful to anyone, and maybe learn something from you in the comments.
About me: I trade Support and Resistance both breakouts and rejections, usually my entries are after Hammers and Shooting stars on above average volume. I use VPA (Volume Prize Analysis) for all my analysis and entries. I do not post my Tick Volume indicator as I use different platform for it.
My Win%:
All time 45.05%
2025 45.51%
Q3 51.39%
Good Luck in your trading.
Thank you
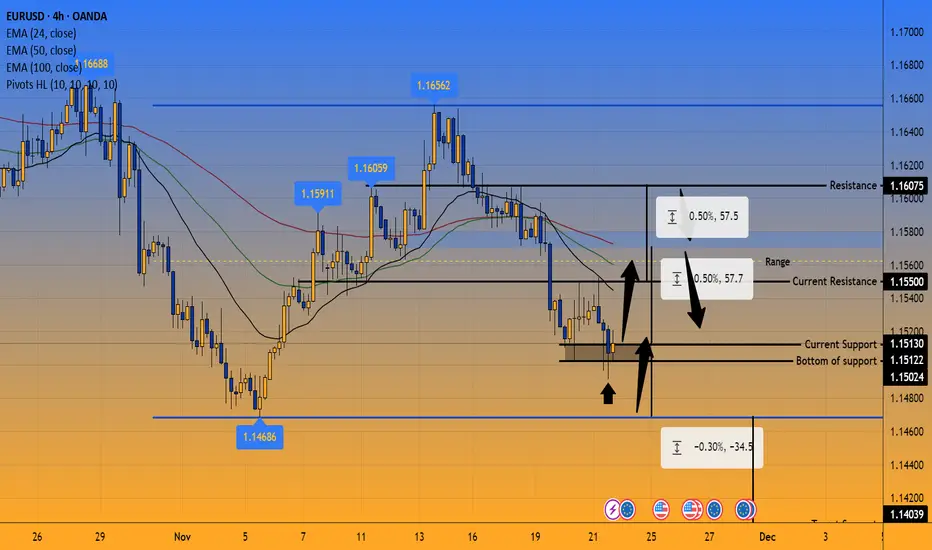
EU Thoughts, Ideas and Forecast (1 Week)Daily:
We are coming from a bearish week, and what is more important is the struggle at 1.15130, last two candle both engaged with the level and both failed to close below and also they came on some solid volume. The overall trend since September has been bearish with some nice pullbacks. Since the end of October we entered in a large range L1.14686, H1.16556. The EMA's are trading above the price confirming the overall bearishness of the pair. Given all this information and the previous structures, I'm interested in a long pullback, scenario 1 up to 1.16000 which is the Fibonacci retracement levels or re-test of the last high, I don't exclude last push to the bottom level of the range 1.14686. The idea is I'm looking for bottom reversal patterns. BUY
4H:
In the last hours of Friday we did get some good confirmations of struggle to keep the price at this level and also the confirmation of buyers here, we already get the second touch, I don't expect the pullback to be huge as there are many levels above where the price could be stopped. WEAK BUY THE PULLBACK THE SELL CONTINUATION DOWN TO 1.14686
1H:
On the faster TF is visible the tight range that the price entered on Wednesday following the breakout of 1.15500. That strong hammer marked with the arrow its first confirmation for a possible pullback all i want to see is a HL closing above 1.15130 to trigger my long.
The Plan
LONGS:
1.15100 current level that could be an early week entry, Target 1.15700
1.14686 Rejection, low of the range, Target 1.15024
SHORTS:
1.15700 Rejection (the blue area), Target 1.15130
1.16075 Rejection, Target 1.15500
Disclaimer: This are notes of what I do for my self every week, but usually I just save them as Private notes so I can keep track on my weekly plan. I decided to start publicly sharing them in the hope that they can be somehow helpful to anyone, and maybe learn something from you in the comments.
About me: I trade Support and Resistance both breakouts and rejections, usually my entries are after Hammers and Shooting stars on above average volume. I use VPA (Volume Prize Analysis) for all my analysis and entries. I do not post my Tick Volume indicator as I use different platform for it.
My Win%:
All time 45.05%
2025 45.51%
Q3 51.39%
Good Luck in your trading.
Thank you
SUI Technical Analysis — Is a Major Reversal Coming?SUI is currently moving inside a large descending channel, consistently respecting both the upper and lower trendlines. Price is now approaching a critical decision zone where two scenarios become likely.
Bearish Scenario (Red Path)
If the current weakness continues, SUI may drop toward the bottom of the channel, which aligns with the long-term rising trendline.
• Support Zone: $0.70 – $0.75
This area is the strongest confluence of support on the chart.
A bounce from here would be highly probable.
Bullish Scenario (Green Path)
If SUI holds above the lower boundary and shows a reversal pattern, we can expect a recovery toward the mid-range of the channel.
• First Target: $1.63
• Second Target: $2.38 (midline + major horizontal level)
A break above the midline could signal a trend shift.
Suggested Trade Plan
• Entry Zone: Around $0.75 – $0.80 (lower channel + long-term trendline)
• Stop-Loss: $0.60 (below channel + invalidation level)
• Target 1: $1.63
• Target 2: $2.38
Risk/reward becomes highly favorable only if price gets closer to the lower trendline.

PI Coin Massive Capitulation, But a Potential Bottom Is FormingPI has experienced an extreme -95% collapse from its peak, followed by months of steady sideways consolidation. This kind of price behavior is typical after capitulation events, where sellers are completely exhausted and the market enters a long accumulation phase.
Key Technical Observations
1. Major Capitulation (-94.68%)
The sharp vertical drop shows panic selling. After such massive declines, markets often enter a stabilization zone.
2. Long-Term Support Zone (≈ $0.22 – $0.30)
The chart shows PI sitting on a multi-month horizontal support, which has repeatedly held. This is currently the most important level.
3. Price Compressing Near Support
PI is trading in a very tight range just above support. This normally indicates that:
• Sellers are mostly gone
• Buyers are slowly accumulating
• A small upward correction becomes more likely than another major breakdown
4. Reclaim of SMA50 Would Be First Bullish Signal
The SMA50 is slightly above price. If PI closes above it, momentum may shift upward.
Bullish Scenario (Green Arrow)
If PI holds above the $0.22–$0.23 support and breaks out from the tight range:
Targets:
• Target 1: $0.30
• Target 2: $0.40 (strong resistance and major test area)
A breakout above $0.40 would signal a trend reversal.
Bearish Scenario
If the support at $0.22 breaks decisively:
• The chart has no meaningful support below until extremely low levels
• Price could revisit the sub-$0.10 zone
• Breakdown would indicate continuation of the long-term downtrend
Suggested Levels
Entry (Speculative): $0.23–$0.25
Stop-Loss: Below $0.20
Targets:
• $0.30
• $0.40
This is a high-risk, high-speculation setup, suitable only for experienced traders.

XRP at a Make-or-Break Moment: Rebound Ahead or Major Breakdown?XRP has now reached the lower boundary of its long-term ascending channel, a level that has historically triggered either strong bullish reversals or major breakdowns.
This area represents the true decision point between continuation of the uptrend or a potentially deep correction.
Technical Overview
Structure
• Price has been moving inside a broad ascending channel for more than a year.
• It is currently testing the channel support.
• The 50-day SMA is above the price → bearish pressure still present.
Bullish Scenario (if the channel support holds)
If XRP stabilizes above 1.90–1.95:
Targets:
• Target 1: $2.43
• Target 2: $2.85
• Target 3: $3.20
• Major Target: Channel top near $4.00
Conditions for confirmation:
✔ Holding the lower channel line
✔ Reclaiming the 50-day SMA
Bearish Scenario (if the channel support breaks)
A daily close below $1.85 would confirm a breakdown.
Targets:
• Target 1: $1.60
• Target 2: $1.28
• Final Target: $1.00 or lower
This scenario becomes active if the channel fails.
Suggested Stop-Loss
For long positions: $1.85
For short positions (after breakdown confirmation): $2.05

XRPUSD testing monthly 20EMA supportCritical area for XRP bulls. If the Monthly 20EMA holds (overlayed on this 4H chart) we could see price retrace to the high 2.20s/low 2.30s to test the resistance at the Monthly 10EMA. Needless to say that the RSI is oversold on multiple time frames but with the algorithm set to "sell off" the RSI has become useless for now. As always, on a play like this, tight SL and sniper entries.

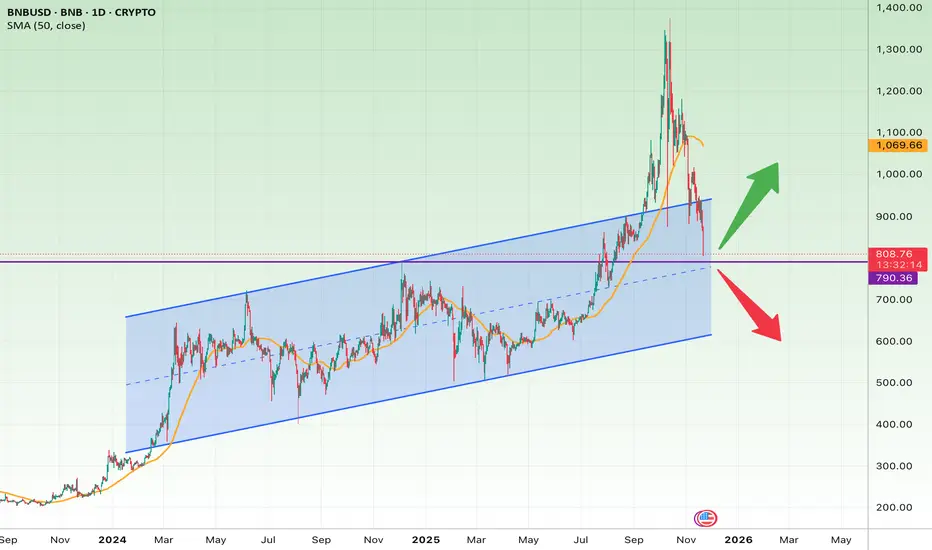
BNB at Reversal Incoming or Start of a Deep Correction?BNB has pulled back sharply from its parabolic run above $1,300, and price is now sitting exactly on the bottom boundary of the rising channel that has guided the trend since late 2023.
This area is extremely important because:
• It is the channel support
• It aligns with a previous consolidation zone
• It’s very close to the 50-day SMA retest zone (which BNB often respects)
If this support holds, BNB could stage a recovery rally. But if it breaks down, the chart opens the door to a much deeper correction.
Bullish Scenario (If channel support holds)
Entry Zone: $780–$820
(BNB is currently inside this zone)
Target 1: $987
– This is the next major resistance and midpoint of the previous structure.
Target 2: $1,070–$1,100
– Retest of the recent breakdown area and 50-day SMA region.
Target 3 (extended): $1,250+
– Only if momentum continues and BTC supports the market.
Bearish Scenario (If price loses the channel)
A breakdown from the channel plus a daily close below $790 would confirm weakness.
Downside Targets:
• $700 — First Fibonacci + structural support
• $620 — Major support zone from 2024
• $500–$520 — Full channel breakdown target
Stop-Loss Suggestion
• Stop-loss (swing trade): $760
– A daily close below this level means the channel is broken.
• Tighter stop-loss (short-term): $780
Summary
BNB is sitting on a critical support level.
Hold → strong bounce potential.
Break → deep correction likely.
XAUUSD -SetupPrice has confirmed a bearish breakout from the structure, and I’m expecting continuation toward the three downside targets. As long as price maintains bearish momentum and stays below the key levels, the setup remains valid.
Bias: Bearish
Invalidation: ❌ Setup becomes invalid if price closes above 4107.50.
Watching for sustained downside pressure and continuation toward the marked take-profit zones.

gold end weekHi.
boring week we had.
but :
It's the time to reach Daily Moving average 45.
if we dont see it today, I promise you we will have gold over 4500.
Stay safe

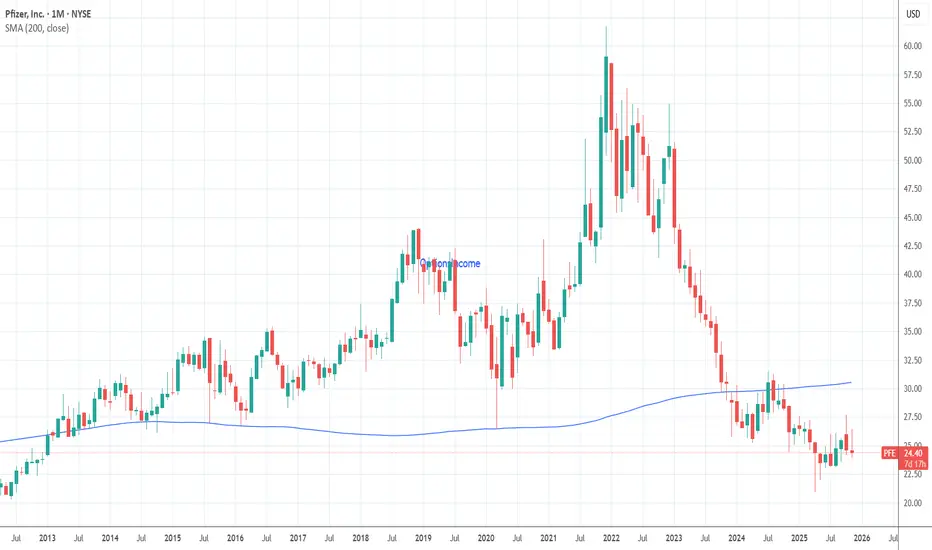
Pfizer (PFE) – Hedged Covered Call Income CampaignAfter Pfizer’s return to price levels closer to its pre-COVID range, I personally believe the stock is undervalued relative to its current earnings profile and long-term potential. This view is also influenced by Pfizer’s recent acquisition of Metsera, which brings a pipeline of obesity and cardiometabolic candidates — including GLP-1 receptor agonists, an amylin analog, and other metabolic therapies.
Whether this pipeline ultimately succeeds is uncertain, but in my opinion, it meaningfully strengthens Pfizer’s long-term outlook.
This campaign is structured as a hedged, conservative covered-call income strategy, combining downside protection with steady premium generation.
Current Position
1. Long Shares: 700 shares @ $24.94
2. Protective Long Puts: 7 puts @ $19 strike (exp. 1/16/26), Cost: $35 total
Because PFE’s implied volatility is relatively low, these long-dated puts provide very inexpensive downside protection, defining maximum risk and allowing me to run covered calls with confidence. This is my preferred way to reduce tail risk on slower-moving stocks.
Covered Calls (Income)
I am selling near-term calls at the $25 strike and rolling as needed.
Call Activity So Far:
A. Initial Sell
• 7 contracts @ $0.11 → $77 total
• Expiration: 11/07/2025
B. Roll #1
• 7 contracts @ $0.15 → $105 total
• Expiration: 11/11/2025
C. Roll #2
• 7 contracts @ $0.15 → $105 total
• Expiration: 11/17/2025
Dividend Component:
Pfizer’s dividend provides a third income source that complements the weekly call premiums. With 700 shares, my next scheduled dividend payment is $310.89 on December 1st. this is nearly a 7% yield.
Dividends enhance this strategy by:
1. Reducing effective cost basis over time
2. Providing a reliable quarterly income
3. Making slower-moving stocks like PFE well-suited for hedged income trading
4. Smoothing returns even during flat price periods
This is one reason I favor PFE for long-term defensive income strategies.
These rolls follow my usual “roll out only” approach — extending time value without paying unnecessary extrinsic premium. This keeps weekly income stable while managing assignment risk.
Rapid ORB ProLive trade using our advanced indicator. This is free for everyone to use in trading view. We are working with guidelines and different ways to enter trade with out indicator. This will make everyone profitable.

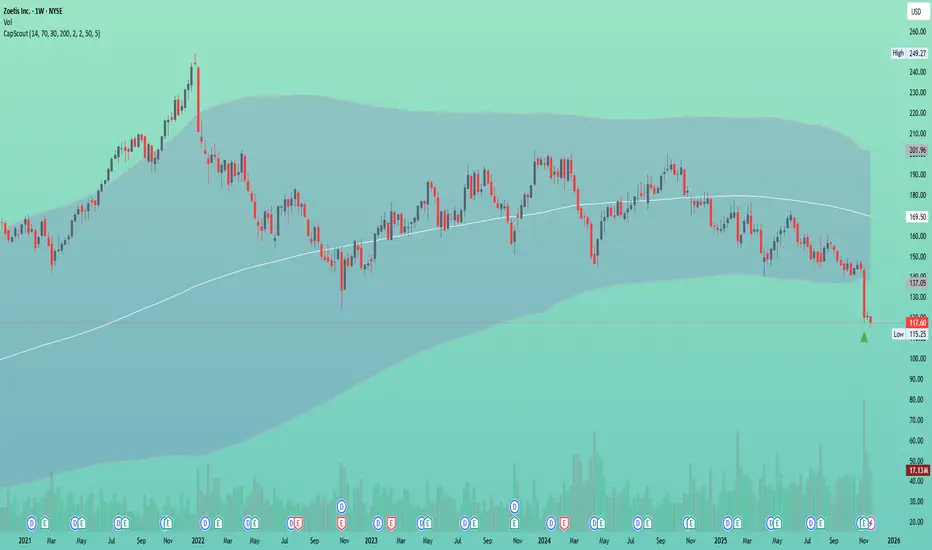
Zoetis $ZTS – Weekly Capitulation Scout SignalZoetis has triggered a fresh Capitulation Scout signal on the weekly timeframe (Fig. 1), pointing to a potential early bottoming phase
Downside momentum is showing signs of exhaustion, which often precedes medium- to long-term reversals in this setup
The next weeks may offer attractive opportunities to begin building long-term positions
Previous signals of this type worked well: LVMH EURONEXT:MC (Fig. 2) and Samsung $005930 (Fig. 3) both marked strong accumulation zones before multi-month recoveries:
I’ll be monitoring for confirmation and potential scale-in levels
Not financial advice. For educational purposes only
USDJPY // The bowl is completed on the yellow line. In case of reaction sales, our first take profit point is the 8 exponential moving average.
