Continuation in Wheaton Precious Metals?Wheaton Precious Metals has climbed along with silver, and some traders may expect continuation to the upside.
The first pattern on today’s chart is the August 8 high of $103.81. WPM crossed that level in early September and tested it in the middle of the month. Does holding the old peak suggest old resistance has become new support?
Second, prices have remained above the rising 8- and 21-day exponential moving averages. That may be consistent with an uptrend.
Third, MACD’s sharp rise in recent weeks may reflect bullish momentum.
Finally, the silver producer didn’t hit an all-time intraday high last week. It nonetheless recorded its highest closing price ever, 1.4 percent above the previous record on September 15. That could suggest that buyers remain active and sellers remain relatively quiet.
TradeStation has, for decades, advanced the trading industry, providing access to stocks, options and futures. If you're born to trade, we could be for you. See our Overview for more.
Past performance, whether actual or indicated by historical tests of strategies, is no guarantee of future performance or success. There is a possibility that you may sustain a loss equal to or greater than your entire investment regardless of which asset class you trade (equities, options or futures); therefore, you should not invest or risk money that you cannot afford to lose. Online trading is not suitable for all investors. View the document titled Characteristics and Risks of Standardized Options at www.TradeStation.com . Before trading any asset class, customers must read the relevant risk disclosure statements on www.TradeStation.com . System access and trade placement and execution may be delayed or fail due to market volatility and volume, quote delays, system and software errors, Internet traffic, outages and other factors.
Securities and futures trading is offered to self-directed customers by TradeStation Securities, Inc., a broker-dealer registered with the Securities and Exchange Commission and a futures commission merchant licensed with the Commodity Futures Trading Commission). TradeStation Securities is a member of the Financial Industry Regulatory Authority, the National Futures Association, and a number of exchanges.
Options trading is not suitable for all investors. Your TradeStation Securities’ account application to trade options will be considered and approved or disapproved based on all relevant factors, including your trading experience. See www.TradeStation.com . Visit www.TradeStation.com for full details on the costs and fees associated with options.
Margin trading involves risks, and it is important that you fully understand those risks before trading on margin. The Margin Disclosure Statement outlines many of those risks, including that you can lose more funds than you deposit in your margin account; your brokerage firm can force the sale of securities in your account; your brokerage firm can sell your securities without contacting you; and you are not entitled to an extension of time on a margin call. Review the Margin Disclosure Statement at www.TradeStation.com .
TradeStation Securities, Inc. and TradeStation Technologies, Inc. are each wholly owned subsidiaries of TradeStation Group, Inc., both operating, and providing products and services, under the TradeStation brand and trademark. When applying for, or purchasing, accounts, subscriptions, products and services, it is important that you know which company you will be dealing with. Visit www.TradeStation.com for further important information explaining what this means.
Moving Averages

ETHUSD - Logarithmic Trend D1Hello, dear traders. An interesting trend has formed on Ethereum in the logarithmic chart. Earlier, we clearly identified a double bottom on the second cryptocurrency. Now we can see that the price is close to rebounding from the support level.
The main thing is to find an upward reversal pattern on H1 or H4. The targets are the 1.382 and 1.618 Fibonacci levels. That's $8,000 and $11,000.
What do you think? Will Ethereum hold the support levels and will there be an altseason for this asset?

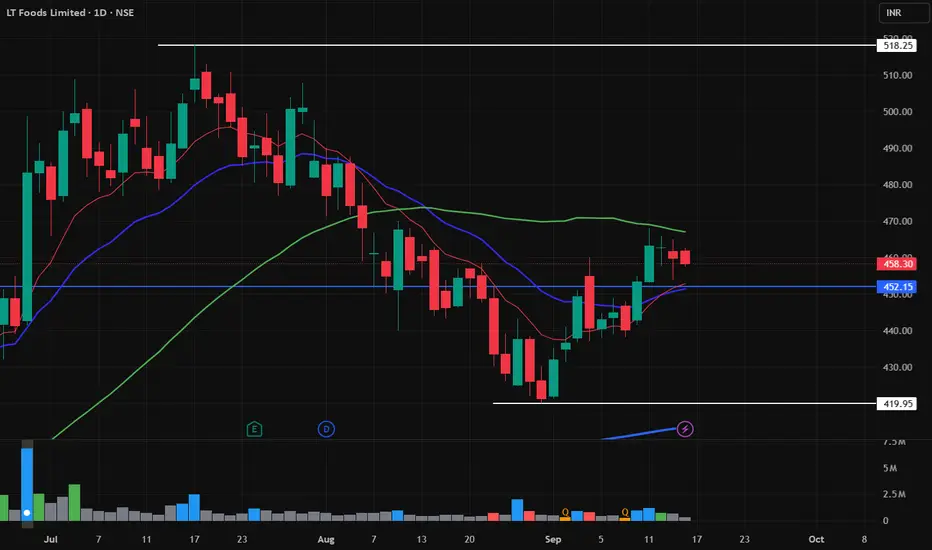
LTFOODS ANALYSISSwing Trade :
A small bullish setup. Stocks looks good on weekly timeframe above 20 ema and previous weekly resistance.
On Daily timeframe stock with good volumes is attempting to break above 50 sma.
Stop loss can be placed at 450. Good risk reward setup.
Disc : My view is for educational or study purpose only.
It is not a buy/sell recommendation.
Bitcoin DROP & RISEThere is a possibility Bitcoin drop to daily 200MA at $104,700 and go up from that area to $138k

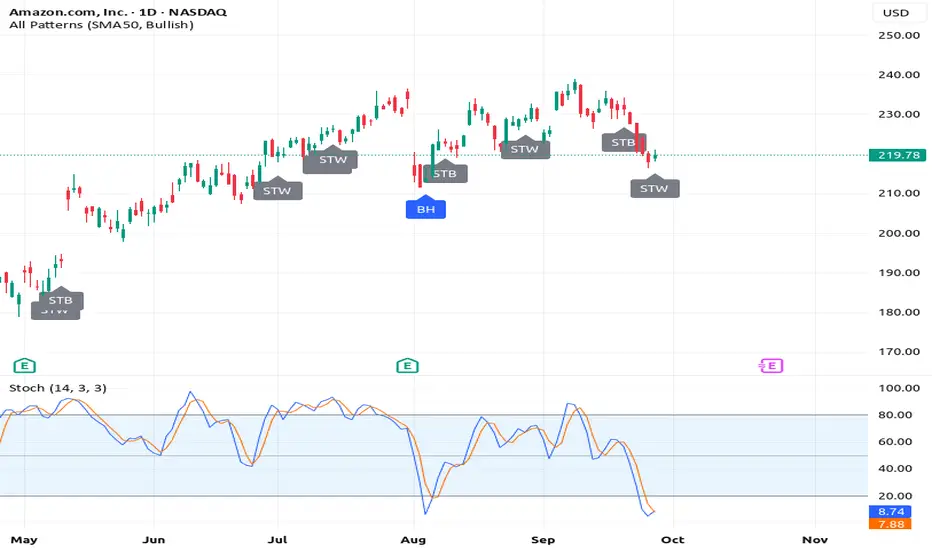
The #1 Chart Pattern:Ascending Triangle - Amazon StockMan am doing my research
and did you know
that you can start a business
using your trading
skills?
This is mind blowing to me
i didn't think a skill
like trading can actually
be a full time
professional career.
So here i am banging my
head against the wall
thinking trading is a hustlers game
with no professional career
at the end of the tunnel.
But this thought is so false.Guys
trading is a real business
infact its the highest
form of business out here.
If you take this thing serious it can lead
to your financial freedom.
Because of this am going to have
a professional trading career
in the future you guys.
I didn't know that it gets this huge.
Am so humbled by this.
The fact that the government
recognises trading as a skill
has really humbled me
And now am starting to
appreciate people
like Robert Kiyosaki.
Who keep encouraging
young people to take up
financial education and change
their lives.
My life has changed or at least
my mindset has seen beyond
what my poor brain could imagine
man.
Anyway look at this chart. NASDAQ:AMZN
Look at the stochastic..(14,3,3)
When that blue line crosses above
the orange line
It will signal an entry signal.
But dont be excited and
expect the price to jump
up immediately.
The pattern is called "Ascending triangle"
This means the price will bounce off the resistance.
before it breakouts out..
That bounce from resistance will form
higher lows which get closer to
the breakout point.
The Spinning Top White Is
The Candlestick charting
technique am using here
Which i learnt from
reading Steve Nison's Book
On Japanese
Charting Techniques,
second edition.
Rocket boost this content to learn more.
Disclaimer: Trading is risky
please risk management
and profit taking strategies.
Also feel free to use a
simulation trading account.
Also dont trade Zero day
options that expire in one day,
please take this as a serious warning.
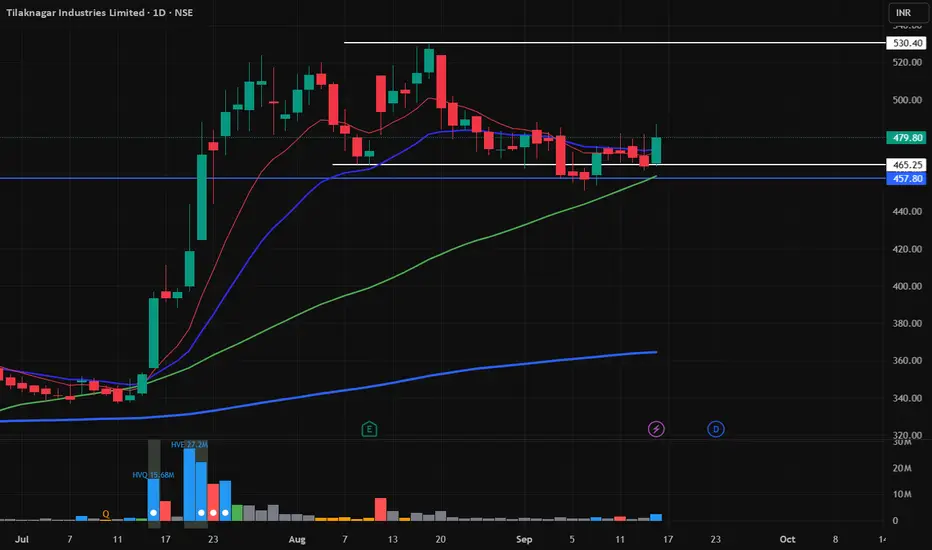
TILAKNAGAR ANALYSISSwing Trade :
Breakout and Retest Setup
A good volume candle above 10 and 20 ema.
Stop loss can be 455 which is the breakout level.
Disc : My view is for educational or study purpose only.
It is not a buy/sell recommendation.
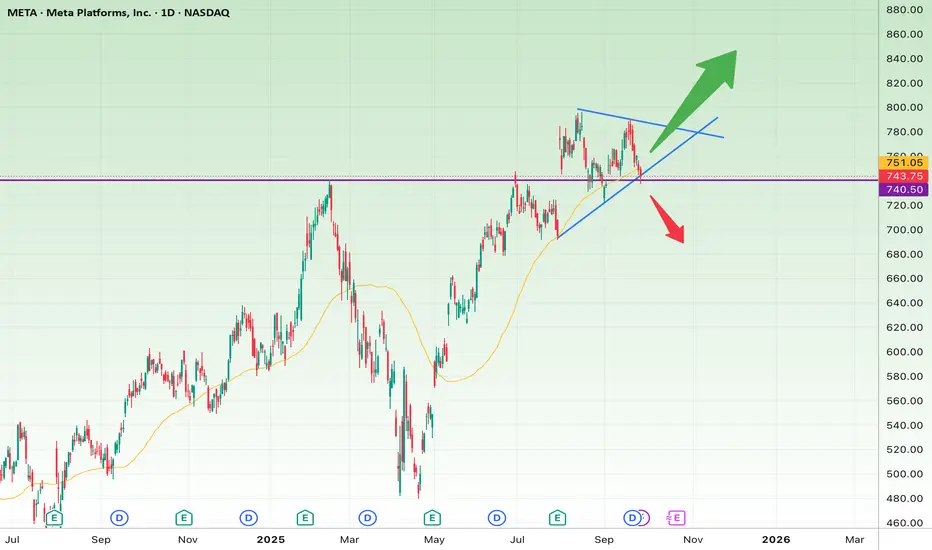
Meta’s Make-or-Break Triangle: Ready to Soar or Sink?Based on the daily chart of Meta Platforms (META):
🔹 Short-Term Outlook (1–3 weeks)
The price is consolidating within a symmetrical triangle pattern, usually a sign of an upcoming breakout.
Key support: $740–$745 (aligned with the rising trendline and 50-day moving average).
Key resistance: $770–$780 (downtrend line of the triangle).
📈 Bullish scenario (short-term):
A breakout above $780 with strong volume could trigger a move toward $805 (first target) and $830 (second target).
Stop-loss: A sustained close below $740.
📉 Bearish scenario (short-term):
A breakdown below $740 opens the door for a quick drop toward $710, and possibly $680.
Stop-loss: Recovery and close back above $760.
🔹 Long-Term Outlook (3–6 months)
The broader trend remains bullish, and the recent pullback looks more like a consolidation within the larger uptrend.
If the price breaks and holds above $805, the medium-term targets are $860 and then $920.
On the downside, losing $680 could trigger a deeper correction toward $620.
✅ Summary:
Short-term: The triangle is nearing completion; whichever side breaks first will define the next move.
Long-term: As long as $680 holds, the bigger picture remains bullish.
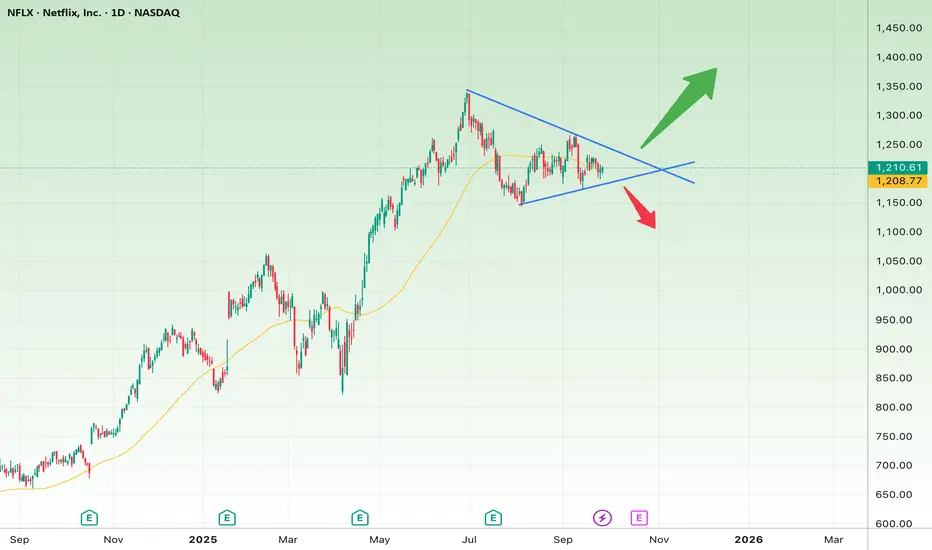
Netflix’s Make-or-Break Moment in a Symmetrical TriangleThe Netflix (NFLX) daily chart is showing a symmetrical triangle pattern. This usually forms before a strong breakout, and right now price is sitting at a decision point.
🔎 Short-Term Outlook (1–3 weeks)
Pattern: Symmetrical triangle around $1,200
Bullish Scenario:
A breakout above the upper trendline ($1,230–$1,240) could trigger strong buying momentum.
Targets:
First target: $1,300
Second target: $1,350
Stop-loss: Below $1,180
Bearish Scenario:
A breakdown below the lower trendline ($1,190) may lead to increased selling pressure.
Targets:
First target: $1,120
Second target: $1,050
Stop-loss: Above $1,240
🔎 Long-Term Outlook (2–6 months)
The overall trend since late 2024 has been bullish, with the 50-day moving average still supporting price action.
Bullish Scenario:
A confirmed breakout and consolidation above $1,240 could pave the way toward:
First target: $1,400
Second target (long-term): $1,500
Bearish Scenario:
If the triangle breaks downward and price holds below $1,150, the medium-term bullish structure could collapse.
Targets:
$1,050
$950 (key long-term support)
Stop-loss (long-term): Below $1,150
📌 Summary:
In the short term, the $1,190–$1,240 range is the key decision zone.
In the long term, the bias remains bullish unless price loses $1,150.
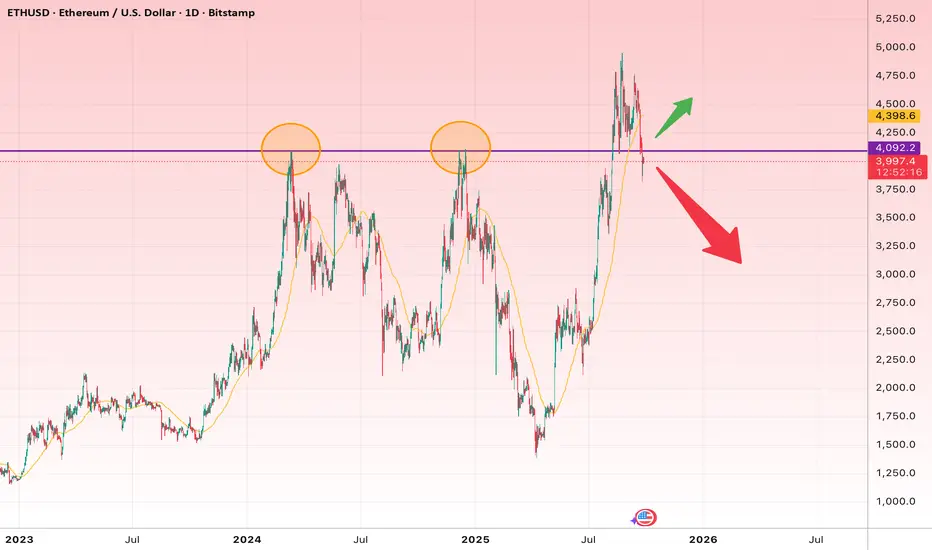
Ethereum at a Historical Crossroads: Breakout or Major Rejection
Based on the ETH/USD daily chart you shared, here’s a professional breakdown:
🔎 Technical Overview
Key Level: $4,000 – $4,100
This zone is a multi-year resistance (price was rejected here twice before → double top).
Currently, price is sitting just below this line — a true decision point.
Pattern Outlook
A confirmed breakout above $4,100 could open the way for a strong bullish rally.
A rejection here could trigger a deep correction, similar to the past two times.
100-Day Moving Average
Acting as dynamic mid-term support. A clean break below it would be a strong bearish signal.
📈 Short-Term Outlook (1–3 weeks)
Bullish Scenario:
Break and daily close above $4,100–$4,200 → Target 1: $4,500, Target 2: $4,850.
Stop-loss: Daily close below $3,900.
Bearish Scenario:
Rejection and breakdown below $3,850 → Target 1: $3,400, Target 2: $3,000.
Stop-loss: Daily close above $4,150.
📊 Long-Term Outlook (3–9 months)
Bullish (if resistance breaks):
Mid-term targets: $5,250 (next historical peak) → then potentially $6,000–$6,500 if momentum continues.
Stop-loss: Sustained close below $3,400.
Bearish (if resistance holds):
Likely correction towards $2,750–$3,000.
In a broader market downturn, a retest of $2,200–$2,400 is also possible.
⚠️ Key Takeaway: Price is sitting at a critical resistance zone. Risk management is crucial — trading without a stop-loss here could be dangerous.
BULL 4H - Bulls are back in town?On the 4H chart, the setup looks solid: a falling wedge breakout with both MA50 and MA200 left below the price. Buyers stepped in with volume, confirming interest in the move. The first target sits around $18.35, and if momentum continues, the next checkpoints are $22 and $27.6.
From a fundamental angle, Webull keeps expanding its client base and strengthening its position in the competitive brokerage market. With retail trading demand still alive, recovery scenarios for the stock look plausible.
The tactical play is simple: as long as the price stays above the moving averages, bulls are in control. Still, watch for pullbacks - markets love to test support after breakouts.
And yes, the ticker “BULL” practically screams the trend. Just make sure you don’t treat it like a real bull - those don’t care about targets.

Adobe (ADBE) – Double Bottom + EMA50 Breakout PotentialOn the Daily timeframe, NASDAQ:ADBE is showing early signs of strength:
A Double Bottom pattern has formed, often seen as a bullish reversal signal.
RSI divergence was present at the pattern lows, and RSI has broken above its trendline, suggesting momentum shift.
Price closed above the EMA50 , an important technical milestone.
MACD is in positive territory, supporting a potential continuation upward.
Volume has not spiked dramatically, but it is gradually increasing compared to recent history.
Key Levels:
If the downtrend resistance line is broken and price retests neckline/downtrend area successfully, the pattern projects a move at least towards the next local resistance zone.
Confirmation is crucial: a breakout without retest can be a false signal.
Important Note:
This analysis is not a buy/sell signal. It highlights potential upside if key technical levels are broken and confirmed. Patience for breakout + retest may provide a clearer setup.
(For educational purposes only, not financial advice.)

GDS 1D - golden cross and key buying zoneOn the daily chart of GDS, price is moving within a steady ascending channel and is now correcting toward the key support zone at 31.08–33.14. This zone is reinforced by the 0.618 Fibo level (33.10), the lower channel boundary, and the cluster of SMA50/100/200 averages, which remain under buyers’ control. On the weekly timeframe, a golden cross has formed, signaling a long-term bullish momentum.
The current structure suggests a pullback into 31.08–33.14, followed by a potential bounce. If demand confirms in this area, the technical target lies at 39.74, with an extended bullish scenario aiming for the 1.618 Fibo at 50.49. A break below 31.00 would invalidate the bullish outlook.
Fundamentally , GDS continues to benefit from rising demand for data centers in China and active infrastructure expansion. The long-term trend is supported by strong capital inflows into the tech sector, though short-term corrections within the channel remain part of the normal cycle.
Tactical plan: watch for reaction in the 31.08–33.14 zone; a confirmed buy signal could trigger entries targeting 39.74 and 50.49. Strong setup, but requires disciplined execution.

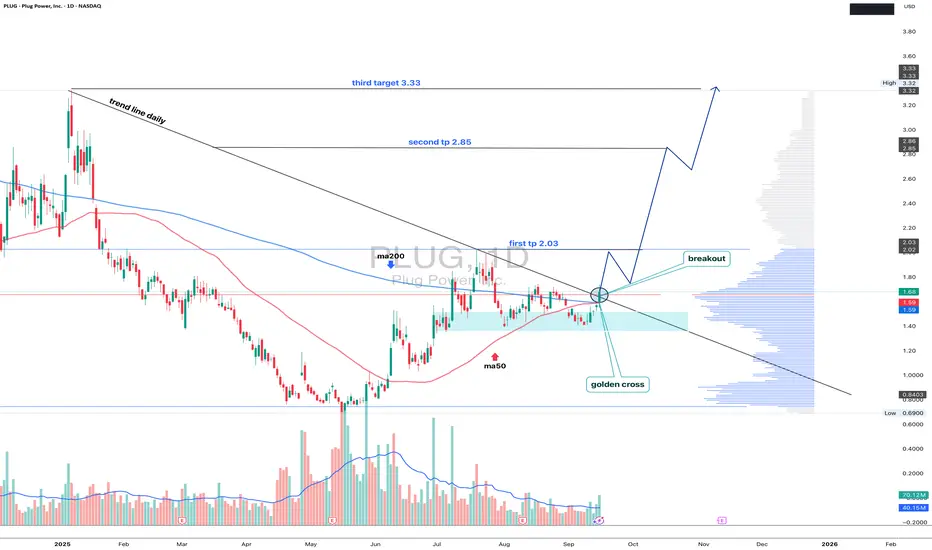
PLUG 1D - powered by a golden crossThe current PLUG chart highlights a key technical shift: the golden cross (MA50 crossing above MA200), usually seen as a potential mid-term reversal signal. Price has broken out of its downtrend structure and is retesting the breakout zone around 1.60–1.68, forming a possible accumulation base. Targets are defined step by step: first at 2.03 (major resistance and Fibo 1), second at 2.85 (Fibo 1.618), and third at 3.33 where strong volume and supply zone meet.
Fundamentally , Plug Power remains a high-risk play: heavy debt, negative cash flows, yet renewed investor attention thanks to green energy incentives.
The tactical view is clear: if the stock holds above 1.68, the road opens toward 2.03, and further breakout may accelerate momentum. A drop back below MA50, however, would invalidate the bullish case.
In short, the market is now deciding whether PLUG becomes a green-energy comeback star or just another unplugged socket.
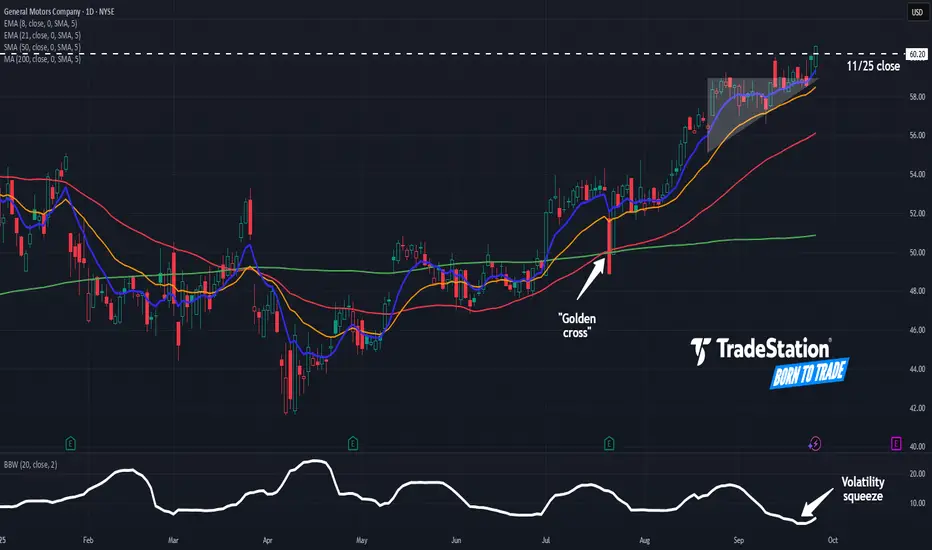
General Motors Could Be AcceleratingGeneral Motors has pushed higher amid low volatility, and some traders may think the automaker is starting to accelerate.
The first pattern on today’s chart is the series of higher lows since mid-August. Prices mostly remained below $59 until last week, creating an ascending triangle. They now seem to be escaping that potentially bullish continuation pattern.
Second, GM ended Thursday at its highest daily closing price since early 2022.
Third, Bollinger Band Width recently fell to its lowest reading since July 2017. Will that price compression give way to expansion?
Next, the 50-day simple moving average (SMA) had a “golden cross” above the 200-day SMA in July and has remained there since. That could reflect a more positive long-term uptrend.
Finally, the 8-day exponential moving average (EMA) has remained above the 21-day EMA since late June. That may be consistent with a short-term uptrend.
TradeStation has, for decades, advanced the trading industry, providing access to stocks, options and futures. If you're born to trade, we could be for you. See our Overview for more.
Past performance, whether actual or indicated by historical tests of strategies, is no guarantee of future performance or success. There is a possibility that you may sustain a loss equal to or greater than your entire investment regardless of which asset class you trade (equities, options or futures); therefore, you should not invest or risk money that you cannot afford to lose. Online trading is not suitable for all investors. View the document titled Characteristics and Risks of Standardized Options at www.TradeStation.com . Before trading any asset class, customers must read the relevant risk disclosure statements on www.TradeStation.com . System access and trade placement and execution may be delayed or fail due to market volatility and volume, quote delays, system and software errors, Internet traffic, outages and other factors.
Securities and futures trading is offered to self-directed customers by TradeStation Securities, Inc., a broker-dealer registered with the Securities and Exchange Commission and a futures commission merchant licensed with the Commodity Futures Trading Commission). TradeStation Securities is a member of the Financial Industry Regulatory Authority, the National Futures Association, and a number of exchanges.
TradeStation Securities, Inc. and TradeStation Technologies, Inc. are each wholly owned subsidiaries of TradeStation Group, Inc., both operating, and providing products and services, under the TradeStation brand and trademark. When applying for, or purchasing, accounts, subscriptions, products and services, it is important that you know which company you will be dealing with. Visit www.TradeStation.com for further important information explaining what this means.
Gold (XAU/USD) – ORH Rejection Signals Potential Drop Toward PDOGold on the 15-min chart is showing a strong rejection from the ORH zone near resistance, supported by Dizzy HOLO indicator signals. Price action suggests a possible move lower toward PPF (3744) and PDOL (3739) levels if the bearish momentum holds.
⚡ Key Highlights:
Rejection from supply zone marked by ORH.
Breakout trap above resistance followed by reversal candles.
Next downside targets: PPF 3744 → PDOL 3739.
Bias remains bearish unless price breaks above ORH zone with volume.

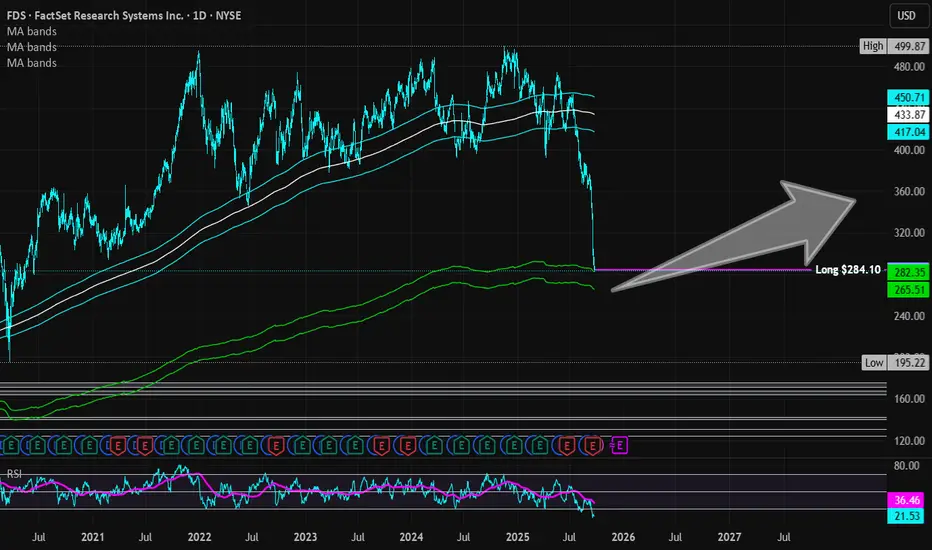
FactSet Research Systems | FDS | Long at $284.10FactSet Research Systems NYSE:FDS is a leading provider of financial data, analytics, and software solutions primarily serving the investment and finance industry. As of 2025, it supports over 218,000 users across more than 8,200 client institutions worldwide, including buy-side and sell-side firms, investment managers, hedge funds, banks, wealth managers, asset owners, private equity firms, and corporate users. Its clients span industries such as financial services (19% of users), higher education (11%), and investment management (7%), with a strong focus on large organizations (38% of clients have revenue >$1B).
Technical Analysis:
The price is currently touching the top of my "crash" historical simple moving average bands (green lines). This area is often reserved for share accumulation and can signal a bottom. The price, however, may extend to the bottom of "crash" bands which is currently near $265.00. These bands don't always signal a bottom - there is a still a "major crash" zone - but the company's niche clientele and earnings/revenue growth into 2029 may signal a buy opportunity.
Earnings and Revenue Growth
EPS growth between 2025 ($16.98) and 2029 ($22.30): 31.3%
Revenue growth between 2025 ($2.32 billion) and 2029 ($2.86 billion): 23.3%
www.tradingview.com
Health
Debt-to-Equity: 0.63x (good)
Altman's Z-Score/Bankruptcy Risk: 6.6 (great, very low risk)
Insiders
Warnings: selling outweighs buying, but an insider two days ago purchased $100k near $296.
openinsider.com
Action
Due to the expected earnings and revenue growth into 2029, great overall financial health, niche market served, and technical analysis signals, NYSE:FDS is in a personal "buy zone" at $284.10. Additional opportunities for entry may exist near $265 and a bit lower in the near-term. However, if estimates are correct and continued growth is in the future of NYSE:FDS , the long-term outlook may be quite positive for investors. Time will tell.
Targets in 2028
$320 (+12.6%)
$350 (+23.2%)
$BTC Bulls Must Step Up Or Next Target 200MA₿itcoin testing the perimeter of the DANGER ZONE ⚠️
Thankfully closed inside of it.
Notice how well PA respects this zone.
Bulls really need to step up here, otherwise the long awaited retest of the 200MA awaits CRYPTOCAP:BTC at $104k.
It has to retest there eventually nonetheless.
Note the RSI is nearly at the level we bottomed on Liberation Day.

Pre-stage 2 breakoutHere's what will most likely happen if DXY breaks down. Forget about demand. Nothing is getting cheaper, starting with raw materials. Bottoming and breakout is almost looking bullish with price over weekly EMA30.

Long Swing Entry OpportunitySolana still performing as a strong beta play to Ethereum. This pull back is steep but hitting all the right zones for a long entry (log trend line and EMA bands). The Steepness of the recent pullback I attribute to fairly large liquidation of over levered longs exploited in a bear attack to force a long squeeze, uncorrelated to a change in the fundamental market sentiment for Solana.

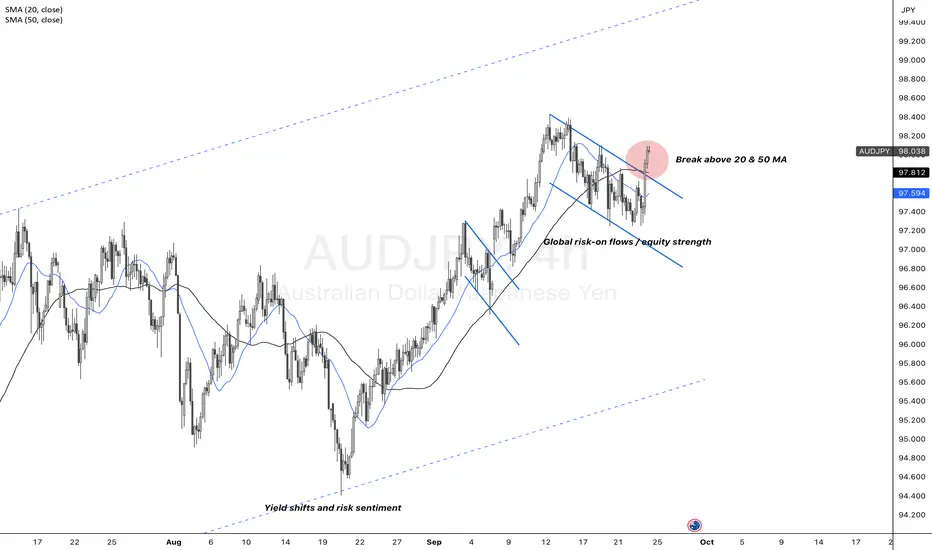
AUDJPY | Fresh Flag Breakout Within Channel – What’s Next?AUDJPY has extended its breakout from the flag formation, reinforced by a decisive move above the 20- and 50-day moving averages. This alignment signals strengthening trend momentum within the broader ascending channel. Near-term catalysts remain RBA policy signals, BOJ guidance, and broader risk sentiment, with the upper channel boundary now the next technical focus.
Powell: Stock Prices appear "Fairly Highly Valued"“We do look at overall financial conditions, and we ask ourselves whether our policies are affecting financial conditions in a way that is what we’re trying to achieve,” Powell said. “But you’re right, by many measures, for example, equity prices are fairly highly valued.”
“Markets listen to us and follow and they make an estimation of where they think rates are going. And so they’ll price things in,” Powell said in part of the conversation dealing with mortgage rates.
Though Powell noted the lofty equity values, he said this is “not a time of elevated financial stability risks.”
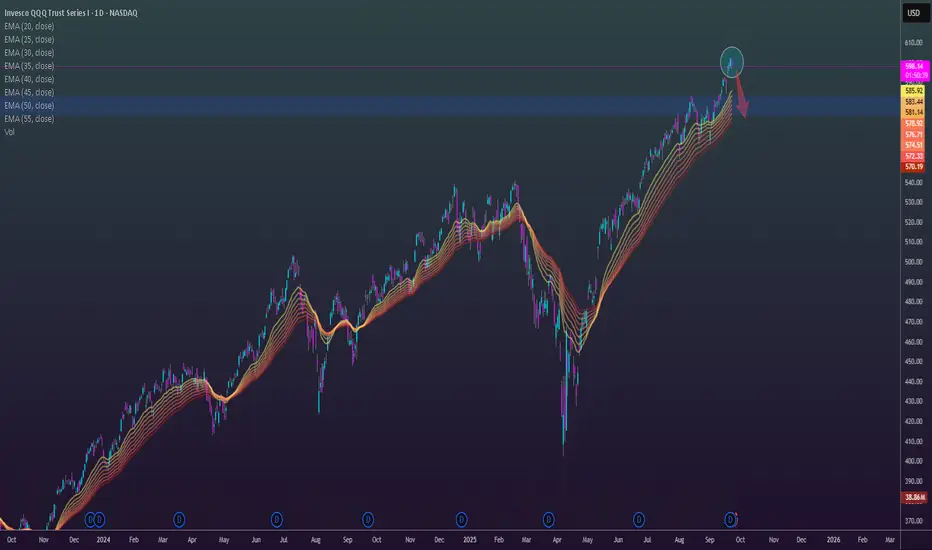
Not really something you want your central banker saying to keep positive momentum in the stock market. Particularly when the Nasdaq is fairly stretched. A downside scenario could see us pulling back into the EMA bands to 575s for the $QQQ.
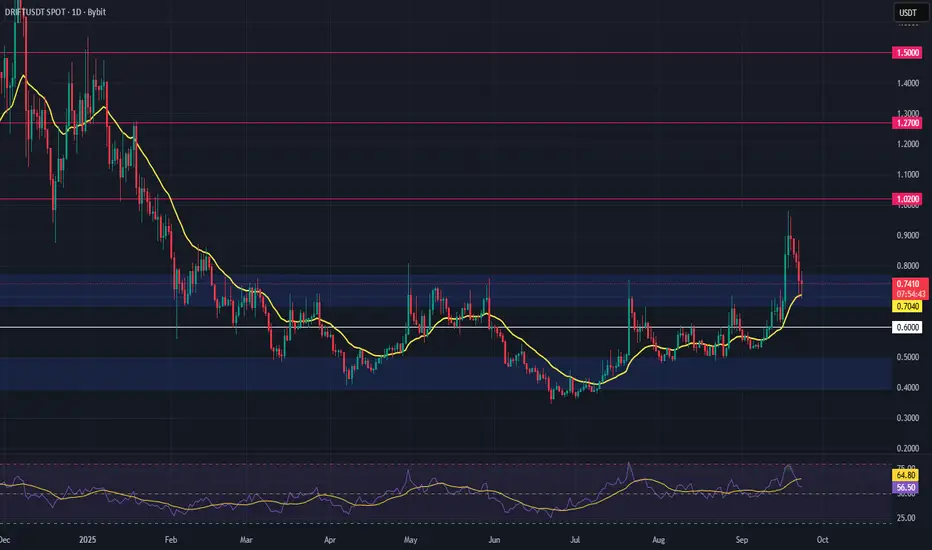
DRIFT Breakout Setup – Higher High + Retest in PlayDRIFT is showing strong bullish momentum after months of accumulation. The token has broken out, printed a higher high, and is now retesting the previous range high as support — a classic setup for continuation.
With price hovering near the 21-day EMA, this zone could act as a launchpad if sentiment holds. The structure supports a potential leg higher, making this a high-reward, low-risk opportunity for swing traders.
🔹 Trade Setup
Entry Zone: $0.68 – $0.72
Take Profit Targets:
🥇 $1.02
🥈 $1.27
🥉 $1.50
Stop Loss: Daily candle close below $0.60
📊 Keep an eye on volume confirmation and overall market sentiment. A clean bounce from this support zone could validate the setup.
📌 Like, comment, or share your thoughts below!
🔔 Follow for more crypto setups and technical insights.
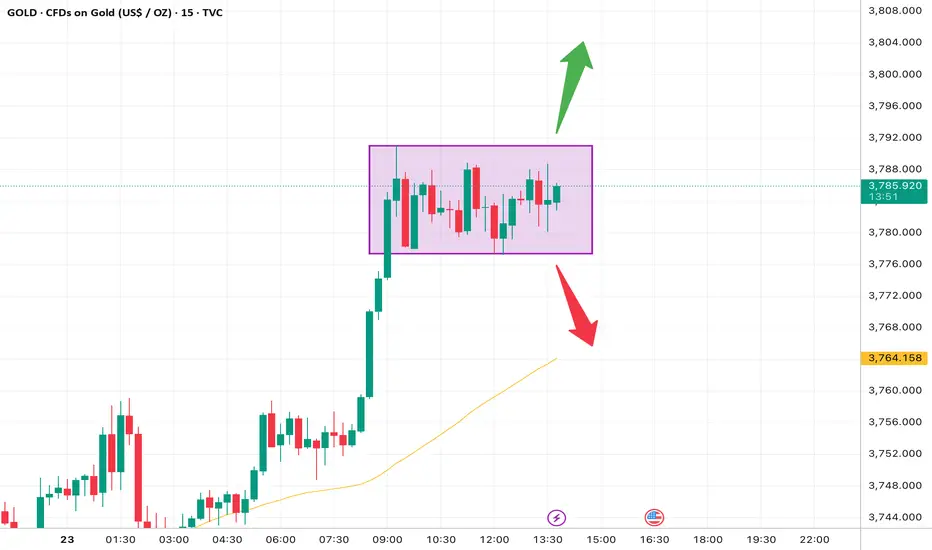
Gold in Tight Range. Breakout Imminent on 15M Chart📊 Professional Analysis
Timeframe & Price Action
This is XAUUSD on the 15-minute chart. After a strong bullish impulse, price has entered a sideways consolidation range between 3780 – 3790 (purple box).
Market Structure
Prior trend: Strong bullish rally.
Current action: A box/range formation — the market is gathering liquidity before the next move.
This is often a continuation pattern, but both directions remain possible.
Moving Average
The yellow line (likely 50-period MA) is trending upward and is well below current price, confirming the bullish bias. However, the distance suggests a possible short-term pullback if the range breaks downward.
Scenarios
🔼 Bullish Breakout:
If price closes above 3790, next upside targets are 3805 (first resistance) and 3810–3812 (extended target).
🔽 Bearish Breakdown:
A break and close below 3780 could trigger a drop toward 3765 and possibly 3760–3755 near the MA support.
🎯 Trading Plan (15-Minute Setup)
Bullish Scenario (Breakout Up)
Entry: Above 3790 after a confirmed 15M candle close.
Stop Loss: Below the box, around 3778.
Take Profit:
TP1: 3805
TP2: 3810 – 3812
Bearish Scenario (Breakout Down)
Entry: Below 3780 with confirmation.
Stop Loss: Above the box, around 3793.
Take Profit:
TP1: 3765
TP2: 3755 – 3760 (near the MA).
⚖️ Risk Management & Notes
On the 15M chart, false breakouts are common — wait for a full candle close beyond the box.
Keep risk per trade around 1–2% max.
Momentum is still bullish, so the upside breakout has slightly higher probability, but always be prepared for the downside scenario.