EUR/USD Rallies from 2025 Uptrend After ECB, U.S. InflationEUR/USD is trading higher on Thursday morning in the wake of the September European Central Bank (ECB) rate decision as well as the dual U.S. data releases, weekly jobless claims and the August U.S. consumer price index (CPI). From the ECB, upgrades to growth and inflation targets are helping reduce cut odds on the Euro’s side. While headline U.S. inflation was a bit warmer on the monthly reading (+0.4% vs +0.3% expected), traders seem more concerned with the jump in initial claims (263K vs 236K expected). The U.S. 10-year yield dropped below 4% for the first time since April.
In the above chart, EUR/USD rates are displaying signs of a meaningful rebound from a technical perspective. The pair rallied off uptrend support that has defined price action since the start of 2025, as well as the 50-day exponential moving average (EMA). Candlestick analysis likewise suggests that a bullish reversal is transpiring. A bullish key reversal is forming, with Thursday’s low exceeding Wednesday’s low; a close today above yesterday’s high would mark the reversal candle.
Moving Averages

CME Group (CME) – Critical Technical Setup!CME is currently trading inside a descending channel and has just touched the bottom support line. Yesterday, we saw a strong bounce of +3%, signaling that buyers are stepping in.
Key Levels to Watch:
Support Zone: $252 – $254 → If this breaks, we could see a slide toward $245 and even $236.
Resistance Levels:
First test: $268 – $272 (mid-channel resistance)
Next hurdle: $276 – $280 (channel top)
Bearish Scenario: A breakdown below $252 would confirm further downside pressure.
Bullish Scenario: A solid close above $260–262 could fuel a run toward $272 and possibly $280.
Takeaway:
CME is at a make-or-break level. The bounce from the channel’s bottom gives bulls a chance, but failure to hold $252 could trigger deeper declines. This is one of those “watch closely” moments!

Comeback for Constellation Energy?Constellation Energy has been powering down for the last month, but now some traders may think the electricity stock is ready for a comeback.
The first pattern on today’s chart is the weekly close of $297.49 on May 23. CEG tested and held that zone several times in early June. Prices returned to that level last week and are now bouncing. That may suggest old support remains in effect.
Second, the 100-day simple moving average is rising through the same area on the chart. That may confirm a longer-term uptrend.
Third, stochastics are turning up from an oversold condition.
Next, CEG has pushed back against a falling trendline and the 21-day exponential moving average. That could reflect more bullishness in the short term.
Finally, investors may refocus on big-picture points. First, there are hopes of rate cuts after producer price inflation was lower than expected. Second is the ongoing AI buildout (with all the associated demand for electricity) following Oracle’s NYSE:ORCL strong guidance last night.
TradeStation has, for decades, advanced the trading industry, providing access to stocks, options and futures. If you're born to trade, we could be for you. See our Overview for more.
Past performance, whether actual or indicated by historical tests of strategies, is no guarantee of future performance or success. There is a possibility that you may sustain a loss equal to or greater than your entire investment regardless of which asset class you trade (equities, options or futures); therefore, you should not invest or risk money that you cannot afford to lose. Online trading is not suitable for all investors. View the document titled Characteristics and Risks of Standardized Options at www.TradeStation.com . Before trading any asset class, customers must read the relevant risk disclosure statements on www.TradeStation.com . System access and trade placement and execution may be delayed or fail due to market volatility and volume, quote delays, system and software errors, Internet traffic, outages and other factors.
Securities and futures trading is offered to self-directed customers by TradeStation Securities, Inc., a broker-dealer registered with the Securities and Exchange Commission and a futures commission merchant licensed with the Commodity Futures Trading Commission). TradeStation Securities is a member of the Financial Industry Regulatory Authority, the National Futures Association, and a number of exchanges.
TradeStation Securities, Inc. and TradeStation Technologies, Inc. are each wholly owned subsidiaries of TradeStation Group, Inc., both operating, and providing products and services, under the TradeStation brand and trademark. When applying for, or purchasing, accounts, subscriptions, products and services, it is important that you know which company you will be dealing with. Visit www.TradeStation.com for further important information explaining what this means.

Americold Realty Trust | COLD | Long at $13.28Americold Realty Trust NYSE:COLD
Technical Analysis:
The price is currently touching the top of my "crash" historical simple moving average bands (green lines). This area is often reserved for share accumulation and can signal a bottom. The price, however, may extend to the bottom of "crash" bands which is currently near $11.80. These bands don't always signal a bottom - there is a still a "major crash" zone - but with interest rates likely dropping in the next 1-2 months, REIT's are poised to benefit as money flows into dividend-paying stocks ( NYSE:COLD dividend is just over 6%).
Earnings and Revenue Growth
EPS and revenue growth are expected between 2025 and 2028 (while REITs are rarely high-growth, the future appears relatively good for the company - especially if their debt levels drop)
www.tradingview.com
Health
Debt-to-Equity: 1.29x (not great, but not terrible)
Altman's Z-Score/Bankruptcy Risk: .5 (high risk - likely higher than 50% chance the company could go bankrupt in the next 24 months *if* interest rates don't drop, but ....)
Market Niche
NYSE:COLD operates in a specialized sector with high barriers to entry due to the capital-intensive nature of building and maintaining temperature-controlled facilities.
The company is an esential service - critical for food safety and pharmaceutical integrity, providing stable demand even in economic downturns.
The company's extensive network ( NASDAQ:KHC , NYSE:CAG , NYSE:WMT , etc) and global footprint (facilities in the US, Australia, New Zealand, Canada, and Europe give it a competitive edge over smaller players.
Insiders
$2 million in recent insider purchases near $17.
openinsider.com
Action
Due to the high likelihood of interest rate lowering and the market niche NYSE:COLD has as a REIT, I am personally going long at $13.28 and will liekly add more share in the $11 range *if* fundamentals improve. Major warning is bankruptcy risk.
Targets in 2028
$15.00 (+12.9%)
$18.60 (+40.1%)

TSLA (daytrading) 2 plan for itPlan 2 could be possible because:
(p1 price is on sma 50 d1,p2 could be sma 200)
TSLA still has a small gap below that might need to be filled.
This week doesn’t look good for the overall market.
I will continue to watch it closely

AUD/USD Trades to 2025 High After U.S. Jobs Revisions, Soft PPIAUD/USD is advancing on Wednesday, nudging above 0.6610 amid a softer U.S. dollar driven by growing optimism around Federal Reserve rate cuts. Investors are betting the Fed will deliver a 25-bps reduction next week, with growing expectations of a 50-bps move. Weaker than expected U.S. jobs revisions yesterday and a PPI reading that went into negative territory month-over-month is keeping pressure on the greenback. Rebounding metals and energy prices are likewise propping up AUD/USD rates.
The above chart shows that, technically, AUD/USD rates have traded into key resistance, the 2025 high carved out in July at 0.6625. Bullish momentum is firming up, with Slow Stochastics extending into overbought territory and daily MACD rising to its highest levels since early-July. A move into new highs could increase the possibility of a retest of the November 2024 swing high at 0.6788.

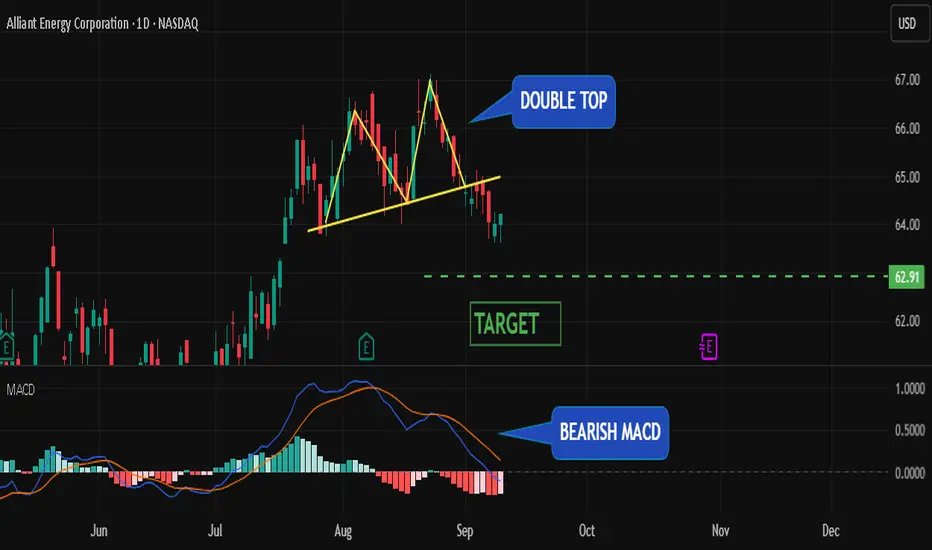
Double-Top Breakdown in Alliant Energy | Short Target ₹62.90Price action in Alliant Energy has developed a clear double-top reversal pattern , with the neckline now broken on strong momentum. This structure signals exhaustion of the prior uptrend and the possibility of a bearish leg unfolding.
Adding further conviction, the MACD indicator has printed a bearish crossover (MACD line crossing below the signal line), showing that momentum has shifted in favor of sellers. This dual confirmation — pattern + momentum — strengthens the short-side outlook.
Trade Plan :
Entry : On breakdown or retest of the neckline zone.
Stop-loss : Just above the recent top / right shoulder (adjust as per risk tolerance).
Target : ₹62.90 (measured move objective).
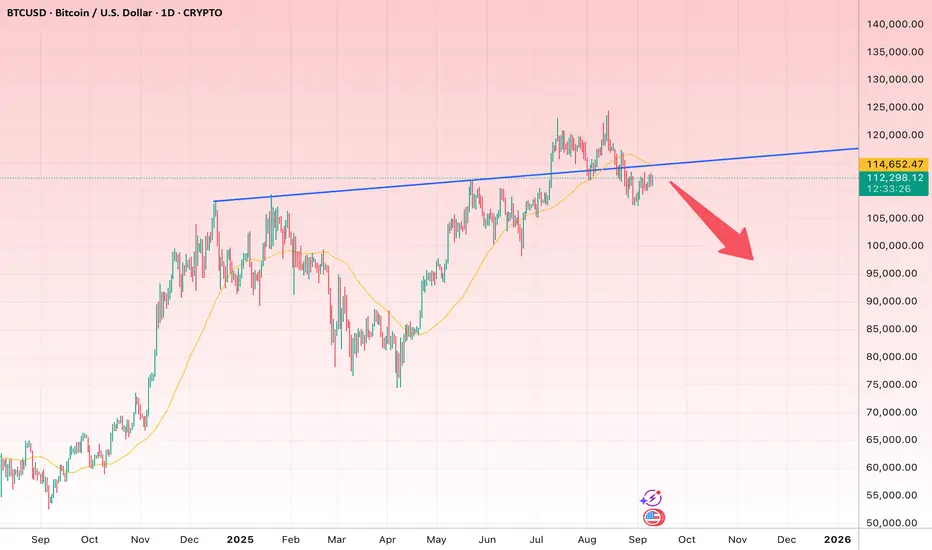
Bitcoin Breakdown Ahead? Why the $100K Level Is Back on the TablTechnical Analysis of Bitcoin (BTC/USDT) – Daily Chart
1. Trendline (Key Resistance):
o A major ascending trendline (blue) that previously acted as a strong resistance has once again turned into dynamic resistance.
o After a failed breakout above this trendline, price slipped back below it — a clear sign of weakening bullish momentum.
2. Moving Average (MA50):
o The 50-day moving average is visible on the chart.
o Bitcoin is currently trading below this MA, which strengthens bearish pressure in the short term.
3. Market Structure:
o After topping around $131,700, BTC entered a corrective phase.
o Lower highs and lower lows are gradually forming, pointing to the emergence of a short-term downtrend.
4. Bearish Signals:
o Failed retest of the broken trendline.
o Price rejection near the MA50.
o A potential bearish divergence (if checked with RSI).
o The red arrow on the chart suggests further downside pressure.
5. Key Levels to Watch:
o Resistance Zone: $114,500 – $118,000 (trendline + MA50).
o First Support: $100,000 – $103,000.
o Second Support: $95,000 – $97,000.
o Critical Support: $90,000.
6. Possible Scenarios:
o If Bitcoin fails to reclaim and hold above $114,500 – $118,000, the path toward $100K and even $95K remains open.
o A decisive breakout and strong close above $118K would invalidate the bearish bias and could trigger another rally toward the $130K region.
Conclusion:
At this stage, Bitcoin is showing more bearish than bullish signals. The failed breakout above the trendline and rejection below the MA50 increase the probability of a deeper correction. Unless BTC regains strength above the $114.5K–$118K resistance, downside targets at $100K and $95K look more likely.
XRP Up 4% as Fed Rate Cut Bets as Bulls Eye $3.00 BreakoutTitle: XRP Climbs 4% as Fed Rate Cut Bets Hit 99% — Bulls Eye $3.00 Breakout While Institutional Flows Dictate the Range
XRP extended its recent upside, gaining roughly 4% intraday as market-implied odds of a Federal Reserve rate cut surged to 99%. The move sent XRP back to the critical psychological level at $3.00, where it briefly tagged the handle before consolidating. While support has held firmly above $2.88, repeated failures near $2.99 underscore how institutional flows are increasingly dictating short-term ranges, with systematic and high-frequency participants leaning on predefined liquidity pockets. The big question now: Can bulls engineer a clean break and weekly close above $3.00 to unlock a sustained trend toward $3.30–$3.60?
Below, we unpack the macro catalyst driving crypto risk appetite, the microstructure of XRP’s order flow around $3.00, the key technical levels to watch on multiple timeframes, and how sector stories—from stablecoin settlement initiatives to real-estate tokenization narratives—might reinforce or derail momentum. We also briefly revisit the regulatory overhang and expert takes on whether the Ripple lawsuit paradoxically protected crypto market structure at a fragile moment.
1. Macro Tailwind: Fed Cut Probability at 99% Reignites Risk Appetite
• Policy backdrop: Markets now price a near-certainty of a 25-basis-point rate cut at the Fed’s September 17 meeting, according to interest-rate derivatives and futures-implied probabilities. In crypto, such a setup typically marginally lowers the discount rate on long-duration risk assets, boosts liquidity appetite, and narrows the opportunity cost of holding non-yielding tokens.
• Liquidity impulse: Crypto has historically responded positively to dovish inflections, especially when dovish signals coincide with risk-friendly cross-asset flows—softening yields, a weaker dollar, and compression in credit spreads. While a 25 bp cut is modest in isolation, the signaling effect—especially if paired with data-dependent guidance—can keep speculative positioning skewed to the upside.
• Caveat: With a 99% probability already priced, the risk of a “buy the rumor, sell the news” reaction grows. If the Fed underwhelms on forward guidance or flags stickier inflation risks, crypto could see a fast fade from local highs. That puts heavy emphasis on the path of real yields and the post-meeting press conference tone.
2. Market Microstructure: Institutions Framing the $2.88–$2.99 Range
• Range mechanics: XRP has established a resilient support shelf above $2.88, with responsive buying stepping in on each probe lower. Conversely, the $2.99–$3.00 area continues to attract supply. This behavior often reflects larger players managing liquidity with tight stop-clusters and iceberg orders near round numbers.
• Repeated failures near $2.99: Such failures typically indicate either (a) active distribution by larger holders who prefer to offload inventory into strength, or (b) systematic strategies (quant funds, HFT) sweeping micro-liquidity into offers and resetting the book to keep price contained until a new exogenous catalyst hits.
• Order book dynamics: Thick sell walls near $3.00 can be both a magnet and a lid. The magnet effect pulls price upward during risk-on waves, while the lid effect stalls rallies unless buyers are willing to consume stacked liquidity. A clean break often requires a combination of momentum ignition (positive macro headline, cross-asset tailwind) and absorption of passive offers.
3. Technical Landscape: Higher Lows Intact, $3.00 the First Gate
Intraday and hourly structure
• Trend context: XRP is trading above $2.90 and the 100-hour Simple Moving Average, keeping the immediate trend biased to the upside. A bullish trend line supports price near $2.93 (Kraken spot data), with a near-term defense zone down to $2.86–$2.88.
• Key intraday bullets:
o XRP price is facing hurdles and struggling to clear the $3.00 resistance.
o The price is trading above $2.90 and the 100-hourly SMA.
o A bullish trend line is forming with support near $2.930 on the hourly chart.
o The pair could continue to rise if it holds above the $2.860–$2.88 zone.
• Alternative micro-view: In earlier sessions, price action emphasized the $2.90–$2.92 band as an initial pivot. Dip wicks into $2.86–$2.87 have been bought, aligning with the 100-hourly SMA and trend-line confluence around $2.865–$2.93.
Momentum and RSI
• RSI stance: Hourly RSI has remained constructive, avoiding deep oversold prints even on pullbacks. That supports the “higher lows” narrative. If RSI holds above the midline on dips while price defends the trend line, bulls retain the initiative.
• Breakout momentum: A decisive hourly or 4-hour close above $3.00, followed by a successful retest holding $2.97–$2.99 as new support, would likely tilt momentum accounts long and invite fresh breakout buyers. Such a confirmatory structure reduces the probability of a false break.
Higher timeframes
• Daily chart context: The market is coiling beneath a psychological barrier. A daily close above $3.00 with expanding volume would project toward $3.15–$3.20 initially, then $3.30—a level that aligns with measured move projections from prior range widths.
• Pattern watch: A narrowing descending triangle under $3.00 has formed over recent sessions. While descending triangles are often bearish continuations, in crypto they can also resolve upward when macro tailwinds are strong. The critical tell is whether buyers keep front-running higher lows into the apex.
4. Scenario Map: Paths Above and Below $3.00
Bullish continuation (probability improves on Fed follow-through)
• Trigger: Clean 4-hour close above $3.00, ideally accompanied by rising volume and positive breadth across large-cap alts.
• Upside targets:
o $3.15–$3.20: First resistance band from prior supply and extension targets based on the local range height.
o $3.30: Key magnet if momentum persists; confluence with measured move from the $2.88–$2.99 box.
o Stretch target $3.45–$3.60: Requires continuation flow, favorable macro tone, and sector risk-on. A path to $3.60 likely needs cumulative breadth improvement and rotation from BTC or ETH dominance.
• Market structure tells:
o Flip of $3.00 to support on retests.
o Shallow pullbacks that hold the 20- and 50-period MAs on 1-hour/4-hour frames.
o Momentum divergence avoidance on RSI and MACD.
Neutral consolidation (base-building under resistance)
• Behavior: Price oscillates between $2.88 and $3.00, with volatility compressing. This can be constructive if it resolves higher. Watch for absorption at $2.92–$2.95: sustained bid depth indicates smart-money accumulation.
• Risks: Choppy stop-runs against both sides. Patience and disciplined entries near range extremes become important.
Bearish fade (news or liquidity shock)
• Triggers: Disappointing Fed guidance, risk-off in equities, or an adverse regulatory headline.
• Downside levels:
o $2.88: First defense. A clean break opens $2.86–$2.85 (trend-line and 100-hourly SMA cluster).
o $2.82–$2.80: Next liquidity shelf; loss of this area would weaken the intermediate uptrend.
o $2.72–$2.75: High-volume node from prior consolidation, potential swing-long reload zone if broader trend remains constructive.
5. Order Flow and Liquidity: What to Watch Around $3.00
• Liquidity pockets: Expect resting offers at $2.99–$3.02 and stop clusters just beyond. A burst through $3.02–$3.05 often reflects stop-fuel rather than sustained demand. The follow-through test is whether bid support appears on the first retest.
• VWAP and session profiles: Monitor intraday VWAP alignment. If price holds above session VWAP after the breakout, it signals strong participation; repeated reversion below VWAP suggests weaker conviction.
• Funding and perp basis: Elevated long funding rates without spot confirmation can forewarn of squeezes. A healthy breakout typically shows rising spot volumes and moderate-perp leverage.
6. Cross-Asset Check: Is Crypto-Wide Breadth Confirming?
• BTC and ETH: If Bitcoin holds or advances alongside XRP, breakouts tend to stick better. Conversely, a BTC pullback from resistance or ETH weakness can sap liquidity from alts and render XRP breakouts vulnerable.
• Dollar and yields: A softer DXY and benign real-yield backdrop would reinforce crypto appetite. Watch the 10-year real yield. A re-acceleration higher could cap upside in risk assets.
• Equities and credit: Positive equity momentum and stable credit spreads are supportive. Risk-off rotations often tighten crypto ranges or trigger downside wicks.
7. Narrative Catalysts: From RLUSD Payments to Real-Estate Tokenization
• RLUSD payments angle: Reports of an electric car maker tapping RLUSD for payments has refocused attention on enterprise-grade settlement rails and Ripple-adjacent stablecoin strategies. If RLUSD or similar fiat-linked tokens embed more deeply into commercial workflows, network effects could lift transactional relevance for XRP and related liquidity pools. Watch for on-chain settlement volumes and treasury adoption headlines.
• Real estate tokenization: The idea that real estate could unlock the next parabolic leg for XRP hinges on two levers: (a) tokenized asset issuance/settlement requiring high-throughput, low-cost rails; (b) institutional-grade custody and compliance frameworks. If pilot programs scale—fractionalized property claims, escrow automation, and cross-border closings—liquidity migration to chains and bridges that interoperate with Ripple ecosystem tools could grow. Concrete KPIs to track include tokenized asset market cap growth, settlement finality times, and custodial integrations with major brokers.
• Payments and remittances: Continued traction in corridors—especially where FX frictions are high—can underpin a fundamental bid for liquidity tokens. Macro volatility tends to increase remittance volumes, indirectly supportive for settlement networks if fees and speed remain competitive.
8. Regulatory Overhang: Did the Ripple Case “Save Crypto” or Just Buy Time?
• Expert discourse: Some analysts argue that the Ripple lawsuit, by forcing clarity on the application of securities laws to token distributions and secondary market activity, reduced systemic legal uncertainty at a critical juncture. The view is that the case delineated boundaries that prevented broader enforcement spillover into secondary liquidity for many assets.
• Counterpoint: Others caution that the landscape remains fragmented. Jurisdictional differences and evolving interpretations keep headline risk alive. Markets may have priced in a partial détente, but precedent is not monolithic, and appeals or parallel actions can re-introduce volatility.
• Trading implication: Regulatory catalysts tend to be binary and gap-inducing. Position sizing around major court dates and policy announcements should reflect that asymmetry.
9. Strategy Playbook: Traders’ Checklist Into and After the Fed
For breakout traders
• Entry logic: Wait for a 4-hour close above $3.00, then look for a retest of $2.97–$2.99 holding as support. Confirmation improves if the retest coincides with an intraday VWAP reclaim and rising spot volume.
• Risk: Place invalidation below the retest low or below $2.93 (trend-line confluence), depending on risk tolerance. Avoid chasing if funding spikes and spot-volume confirmation is lacking.
• Targets: Scale at $3.15–$3.20; trail remainder toward $3.30. Only pursue $3.45–$3.60 if momentum and breadth broaden.
For range traders
• Buy-response zones: $2.86–$2.88 with tight stops if trend line and 100-hour SMA remain supportive.
• Sell-response zones: $2.99–$3.00 if order flow shows absorption and lack of follow-through; cover quickly on decisive breaks.
• Tools: Footprint charts, delta, and cumulative volume profiles to gauge absorption vs. initiative buying.
For swing traders
• Thesis: As long as daily closes hold above $2.82–$2.85, the medium-term bias remains constructive. A weekly close above $3.00 turns the path of least resistance up toward $3.30–$3.60 over coming weeks, contingent on macro tone.
• Invalidations: A daily close below $2.80 suggests a breakdown from the base, opening risk to $2.72–$2.75.
10. Risk Management: Practical Guardrails
• Volatility budgeting: Size positions based on realized volatility. Consider scaling rather than all-in entries around binary macro events.
• Correlation traps: Avoid over-concentration in alts that move in lockstep. If you’re long XRP into the Fed, offset with cash or lower-beta exposures.
• Leverage discipline: Elevated funding and crowded longs can unwind fast. Keep leverage modest and stops hard, especially near psychological levels like $3.00.
• News reaction function: Predefine responses to three scenarios—dovish surprise, baseline cut with cautious guidance, or hawkish tilt. Adjust exposure automatically rather than emotionally.
11. What the Tape Is Saying Now
• Price behavior: XRP has surged through $2.88, probed $2.92, and repeatedly tested $2.99–$3.00. Each dip toward $2.86–$2.90 has found buyers, aligning with the 100-hourly SMA and ascending trend line near $2.93.
• Participation: The best breakouts in XRP historically come on broad-based alt strength and rising spot participation. Watch whether volumes cluster on green candles during NY hours; institutional involvement often intensifies then.
• Sentiment skew: Elevated expectations around the Fed cut can create asymmetry—good news may be “priced in,” while any disappointment can trigger fast downside to first supports.
12. Price Levels Summary
• Immediate resistance: $3.00, then $3.02–$3.05. A strong break above targets $3.15–$3.20 and $3.30.
• Immediate support: $2.93 trend-line, then $2.90, with a stronger shelf at $2.86–$2.88. Below that, $2.82–$2.85 and $2.72–$2.75.
• Momentum markers: RSI holding above midline on pullbacks; MACD on 1-hour/4-hour staying positive; rising OBV on rallies.
13. Frequently Asked Questions
Q: Why does $3.00 matter so much?
A: It’s a psychological round number clustered with offers, stop orders, and optionality hedging. Breaking and holding above it often forces systematic strategies to rebalance, creating momentum.
Q: How reliable is the Fed cut catalyst for crypto?
A: Cuts tend to support risk assets if they signal easier financial conditions ahead. However, when odds are near 100%, the market demands supportive guidance to avoid a fade. It’s the path of policy, not the single step, that matters.
Q: Could XRP reach $3.60 on this leg?
A: It’s possible if $3.00 flips to support, $3.15–$3.30 clears with volume, and macro remains benign. Realistically, $3.15–$3.30 is the first major test; $3.45–$3.60 would likely need follow-through and broader alt strength.
Q: How do institutional flows “dictate” the range?
A: Large players anchor liquidity at key levels, providing both buy-side and sell-side depth. They often fade extremes unless a meaningful catalyst forces them to move, resulting in repeated tests and rejections around known levels.
Q: Is the descending triangle bearish?
A: By textbook definition, yes. But crypto often violates textbook patterns when macro liquidity turns supportive. The resolution depends on who runs out of patience first—sellers defending the ceiling or buyers stepping up on higher lows.
14. Bottom Line
• The setup: XRP is coiled just beneath $3.00 after a 4–5% push, with $2.88–$2.93 acting as a dependable springboard. The hourly trend remains constructive above the 100-hour SMA, and RSI supports further upside if pullbacks stay shallow.
• The catalyst: A near-certain Fed cut anchors the macro bid, but with odds already near 99%, sustained upside likely requires reassuring forward guidance or a concurrent broad-based crypto risk-on.
• The trigger: A decisive close and hold above $3.00 is the primary unlock. If achieved, $3.15–$3.20 and then $3.30 come into view, with $3.45–$3.60 reserved for stronger momentum phases.
• The risk: Failure to clear $3.00 followed by a loss of $2.86–$2.88 would hand control back to sellers and invite a deeper test toward $2.80–$2.75.
As XRP consolidates under $3.00 and the descending triangle narrows, the next directional move will likely hinge on whether institutional sellers maintain the lid or capitulate to momentum post-Fed. Traders should remain flexible, respect key levels, and let the tape confirm the path.

NCMI Breaks Through Downward Sloping Resistance This week NCMI broke through a downward sloping support line that started earlier this year. The price is currently above the 20SMA and about to cross over the 50SMA.
Analysts are targeting around a 3$ increase over the next year.
Analyzing the options chain for 12Dec2025 5$ strike, there is a significant disparity between the open interest of calls to puts (7950 vs 226) suggesting an overwhelmingly positive sentiment for NCMI.
Entering 5c 12Dec2025 @ 0.4

MARI ShortSince July 2023, Mari has never breached and closed below SMA10 on monthly timeframe.
If it breaches it and closes below 588, the downfall will be sharp.
Its first stop would be 519 and then 446 and 415 can also be on cards.
Sorry for Mari lovers but it can become a harsh reality.
However, 415 to 446 can be an ideal time for accumulation for long term investment purpose.
its not a buy / sell call, just my personal opinion.

How to Use Moving Averages in TradingViewMaster moving averages using TradingView's charting tools in this comprehensive tutorial from Optimus Futures.
Moving averages are among the most versatile technical analysis tools available, helping traders analyze trends, identify overbought/oversold conditions, and create tradeable support and resistance levels.
What You'll Learn:
Understanding moving averages: lagging indicators with multiple applications
Simple moving average basics: calculating price averages over set periods
Key configuration choices: lookback periods, price inputs, and timeframes
How to select optimal lookback periods (like 200-day) for different trading styles
Using different price inputs: close, open, high, or low prices
Applying moving averages across all timeframes from daily to 5-minute charts
Analyzing price relative to moving averages for trend identification
Using 50-day and 200-day moving averages for trend analysis on E-Mini S&P 500
Mean reversion trading: how price tends to return to moving averages
Trend direction analysis using moving average slopes
Famous crossover signals: "Death Cross" and "Golden Cross" explained
Trading moving averages as dynamic support and resistance levels
Advanced moving average types: weighted and exponential moving averages
Applying moving averages to other indicators like MACD and Stochastics
Balancing sensitivity vs. noise when choosing periods
This tutorial may benefit futures traders, swing traders, and technical analysts who want to incorporate moving averages into their trading strategies.
The concepts covered could help you identify trend direction, potential reversal points, and dynamic trading levels across multiple timeframes.
Learn more about futures trading with TradingView:
optimusfutures.com
Disclaimer:
There is a substantial risk of loss in futures trading. Past performance is not indicative of future results. Please trade only with risk capital. We are not responsible for any third-party links, comments, or content shared on TradingView. Any opinions, links, or messages posted by users on TradingView do not represent our views or recommendations. Please exercise your own judgment and due diligence when engaging with any external content or user commentary.
This video represents the opinion of Optimus Futures and is intended for educational purposes only. Chart interpretations are presented solely to illustrate objective technical concepts and should not be viewed as predictive of future market behavior. In our opinion, charts are analytical tools—not forecasting

Atlassian Corp | TEAM | Long at $180.12Atlassian Corp NASDAQ:TEAM
Technical Analysis:
Currently trading withing my historical simple moving average zone (i.e. reversion to the mean). This area is typically reserved for share accumulation. Many gaps above to close (as high as $420.80. I anticipate the price to stairstep up over the next few years as the company moves to AI.
Earnings and Revenue Growth
3x EPS growth by 2028 and revenue growth from ~$5 billion to ~$9 billion.
www.tradingview.com
Health
Debt-to-Equity: 0.73x (good)
Altman's Z-Score/Bankruptcy Risk: 6.8 (excellent/very low risk)
Insiders
Warning: Tremendous amount of selling.
openinsider.com
Action
Due to the high-growth potential of NASDAQ:TEAM and solid health, I am personally going long at $180.12. Only major warning is the amount of insider selling.
Targets in 2028
$223.00 (+23.8%)
$380.00 (+111.0%)

Coca-Cola Might Have Lost its PopCoca-Cola has gone nowhere for a year, and some traders may see downside risk.
The first pattern on today’s chart is the series of lower highs since April -- despite an uptrend in the broader market at the same time. Does that relative weakness indicate a lack of buying interest?
Second, the soft-drink maker ended Friday at $67.96. It was the lowest weekly close since early February. It’s also below its 200-day simple moving average. Those signals may represent a break in support.
Third, KO bounced at $69.05 on August 16 but couldn’t get back above that level early this month. That could suggest that old support has become new resistance.
Fourth, prices are under the declining 50-day simple moving average. MACD is also falling and the 8-day exponential moving average (EMA) is below the 21-day EMA. Those patterns may reflect bearish trends in the intermediate and short terms.
TradeStation has, for decades, advanced the trading industry, providing access to stocks, options and futures. If you're born to trade, we could be for you. See our Overview for more.
Past performance, whether actual or indicated by historical tests of strategies, is no guarantee of future performance or success. There is a possibility that you may sustain a loss equal to or greater than your entire investment regardless of which asset class you trade (equities, options or futures); therefore, you should not invest or risk money that you cannot afford to lose. Online trading is not suitable for all investors. View the document titled Characteristics and Risks of Standardized Options at www.TradeStation.com . Before trading any asset class, customers must read the relevant risk disclosure statements on www.TradeStation.com . System access and trade placement and execution may be delayed or fail due to market volatility and volume, quote delays, system and software errors, Internet traffic, outages and other factors.
Securities and futures trading is offered to self-directed customers by TradeStation Securities, Inc., a broker-dealer registered with the Securities and Exchange Commission and a futures commission merchant licensed with the Commodity Futures Trading Commission). TradeStation Securities is a member of the Financial Industry Regulatory Authority, the National Futures Association, and a number of exchanges.
TradeStation Securities, Inc. and TradeStation Technologies, Inc. are each wholly owned subsidiaries of TradeStation Group, Inc., both operating, and providing products and services, under the TradeStation brand and trademark. When applying for, or purchasing, accounts, subscriptions, products and services, it is important that you know which company you will be dealing with. Visit www.TradeStation.com for further important information explaining what this means.

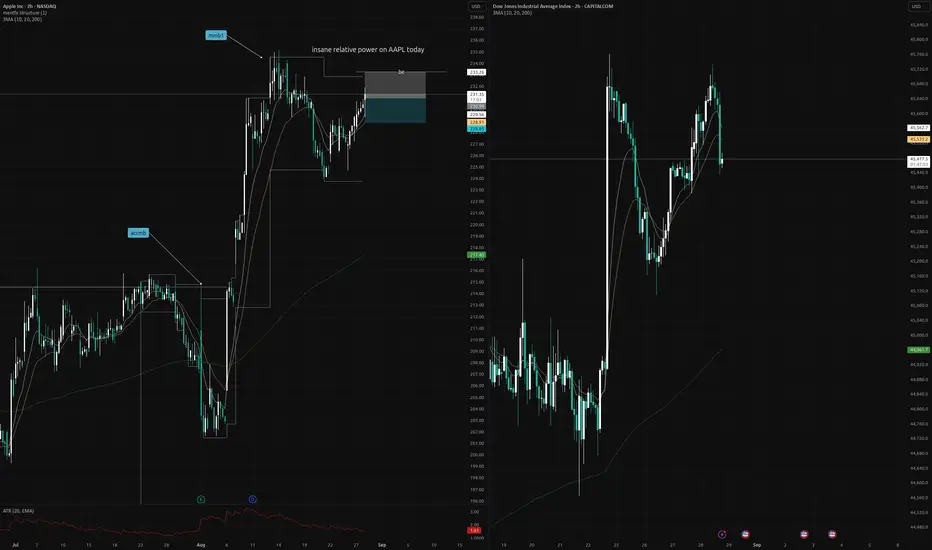
AAPL relative strength to US30 today Because APPLE is going up but US30/US2000 is falling like crazy, we can say that APPLE is one of the strongest stock in comparison with the overall stock market in US
What you think about this trade?
The 3 Step Rocket Booster Strategy ExplainedIn this video i show you
the rocket booster strategy + Fibonacci levels.
So what is the rocket booster strategy:
It has 3 steps:
1-The price has to be below the 50 ema
2-The price has to be below the 200 ema
3-The price should gap down
In this video we see the bearish engulfing pattern
and the falling 3 soldiers patterns.
Watch this video to learn more.
Disclaimer: Trading is risky please learn risk management and profit taking strategies.Also feel free to use a simulation trading account before you trade with real money.

The #1 Reason There Is No Going Back Once You Master TradingSo yesterday i was bored.
As i decided to start reading comic book news.
You may be thinking "Comic book news?"
Yes my friend comic book news.
Am trying to improve my reading culture so
am only going to read what interests my mind.
Am not compromising on my reading
because i want to read what i enjoy.
If you dont enjoy trading just stop
reading this article right now.
Am writing this for one who enjoys
this profession.
there is no going back after
you reach a certain point.
Thats something no one will tell
you in this trading
industry.Trading is like you working
as a marketeer, and insurance agent
at the same time.
Its like you are playing detective
but you dont know what the crime is.
I woluld rather be ignorant
about this game.
Listen stay as ignorant about
trading as possible.
Trust me once you know the truth
you wont go back to normal life.
This game can suck you to a place of no return.
Its kind of like you will cross over to the dark side.
On this side there are so many dead bodies from
washed up traders who just give up.
Then become gamblers.I have seen it with my
own eyes.I have introduced two of my close friends
to trading and i regret it.They both are
still addicted to
gambling.And they luck financial discipline.
This is what happens to you if you don't
master this skill.
\
There is no going back the moment you
feel the rush of a win with real money.
This is why am trying my best
to keep you on the simulation
trading account
because the moment you trade with
real money ..Its game over.I want you
to stay on simulation trading mode.
After i finished reading comic
book news i pasted out
fell fast asleep.
Then i woke up jumped on my screen.
I saw a buying opportunity.
Look at the candle the green OANDA:AUDJPY
one behind.
The wick has poked through
the resistance Fibonacci level.
Honestly i dont know what this means.
And im not interested in knowing.
But it looks like a bull with horns .
Rocket boost this content to learn more.
Disclaimer:Trading is risky please learn risk
management and profit taking strategies.
Also feel free to use a
simulation trading account before you
trade with real money.

Downtrend in Dell?Dell Technologies has lagged the market for months, and some traders may see further downside in the maker of computer hardware.
The first pattern on today’s chart is the bearish gap on August 29 following quarterly results. While earnings and revenue beat estimates, investors focused on weaker margins amid higher costs and intense competition for AI servers.
Second is the August 21 closing price of $127.83, where DELL stalled last week. Has old support become new resistance?
Third, MACD is falling and the 8-day exponential moving average (EMA) is below the 21-day EMA. Those signals may reflect short-term bearishness.
Next, the stock is back under its 50-day simple moving average and has remained below a bearish gap from November. Those points may reflect weakness in the intermediate and long term.
TradeStation has, for decades, advanced the trading industry, providing access to stocks, options and futures. If you're born to trade, we could be for you. See our Overview for more.
Past performance, whether actual or indicated by historical tests of strategies, is no guarantee of future performance or success. There is a possibility that you may sustain a loss equal to or greater than your entire investment regardless of which asset class you trade (equities, options or futures); therefore, you should not invest or risk money that you cannot afford to lose. Online trading is not suitable for all investors. View the document titled Characteristics and Risks of Standardized Options at www.TradeStation.com . Before trading any asset class, customers must read the relevant risk disclosure statements on www.TradeStation.com . System access and trade placement and execution may be delayed or fail due to market volatility and volume, quote delays, system and software errors, Internet traffic, outages and other factors.
Securities and futures trading is offered to self-directed customers by TradeStation Securities, Inc., a broker-dealer registered with the Securities and Exchange Commission and a futures commission merchant licensed with the Commodity Futures Trading Commission). TradeStation Securities is a member of the Financial Industry Regulatory Authority, the National Futures Association, and a number of exchanges.
TradeStation Securities, Inc. and TradeStation Technologies, Inc. are each wholly owned subsidiaries of TradeStation Group, Inc., both operating, and providing products and services, under the TradeStation brand and trademark. When applying for, or purchasing, accounts, subscriptions, products and services, it is important that you know which company you will be dealing with. Visit www.TradeStation.com for further important information explaining what this means.

Solana's Price Coils in Rare Bullish FormationSolana's Price Coils in Rare Bullish Formation, Hinting at a Potential Rally to $230
Solana (SOL) has captured the attention of the cryptocurrency market, with its price charting a course that suggests a significant upward movement may be on the horizon. After a robust gain over the past month and a powerful rebound from its recent lows, the high-performance blockchain's native token is trading within a classic technical pattern known as a symmetrical triangle. A decisive breakout from this formation could propel SOL towards a price target of $230 in the coming days, a move supported by strengthening on-chain metrics, resurgent NFT market activity, and bullish sentiment in the derivatives market.
The digital asset has shown considerable strength, rallying to intraday highs well above the $200 mark before stabilizing. This price point not only marks a significant recovery but also positions SOL tantalizingly close to the upper boundary of its consolidation pattern. This technical setup, combined with strong fundamental tailwinds, is creating a compelling narrative for a potential bullish continuation.
The Anatomy of a Bullish Setup: The Symmetrical Triangle
At the heart of the current bullish thesis for Solana is the formation of a symmetrical triangle on its price chart, a pattern that has been developing over recent weeks. In technical analysis, a symmetrical triangle is characterized by two converging trendlines—one descending line connecting a series of lower highs and one ascending line connecting a series of higher lows. This pattern visually represents a period of consolidation and indecision in the market, where the trading range tightens and volatility contracts. It signifies a temporary equilibrium between buyers and sellers, often preceding a significant price move or "breakout."
While a symmetrical triangle is technically a continuation pattern—suggesting the price will likely resume the trend it was in prior to the triangle's formation—it can break in either direction. However, for Solana, which has been in a broader uptrend, a breakout to the upside is the more anticipated outcome. Analysts are closely watching for a decisive close above the triangle's upper trendline, ideally accompanied by a spike in trading volume, which would serve as confirmation of the breakout.
Multiple analyses converge on a significant price target should this breakout occur. The height of the triangle at its widest point, projected upward from the breakout point, suggests a potential rally that could take SOL to the $230 mark. Other technical strategists have identified targets in a similar range, with some pointing to the $230-$235 area and others looking at a near-term pivot range that could open the path toward higher targets.
Strengthening this possibility are key momentum indicators. The Moving Average Convergence Divergence (MACD), a popular trend-following indicator, has shown its primary line crossing above its signal line, a classic sign of a strengthening uptrend and building bullish momentum.
The Road to Recovery: A Powerful Rebound Ignites Momentum
Solana's current consolidation does not exist in a vacuum. It follows a period of impressive recovery that has renewed investor confidence. After dipping to a notable low in the preceding month, SOL has mounted a formidable comeback of over 30%. This rebound demonstrates strong buying pressure at lower price levels and has established a solid foundation for the current market structure.
Over the past month alone, SOL has registered a double-digit percentage increase in value, a period during which the symmetrical triangle began to take shape. This price action suggests that the recent consolidation is a healthy pause, allowing the market to digest recent gains before a potential next leg up. The series of higher lows established since late August is particularly constructive, indicating that buyers remain active and are stepping in to defend key support levels.
The cryptocurrency is currently consolidating above a critical support level in the high $190s. This price zone is considered highly significant by on-chain analysts, as a massive volume of tokens has historically been traded at this level, creating a strong foundation of support that bulls are actively defending.
Beyond the Charts: Fundamental Tailwinds Gathering Strength
While the technical picture is compelling, a confluence of fundamental factors is adding significant weight to the bullish case for Solana.
The NFT Ecosystem Reawakens
A notable catalyst has been a sharp resurgence in activity within Solana's non-fungible token (NFT) ecosystem. In a recent notable 24-hour window, sales volume for Solana-based NFTs experienced a dramatic spike, more than doubling from the previous day's figures and reaching well into the millions of dollars. This surge propelled Solana to become the second-largest NFT market globally by daily sales volume, trailing only Ethereum.
This spike was largely driven by the explosive popularity of certain new collections, which saw their daily sales volumes skyrocket by orders of magnitude. Other collections also posted significant gains. While the broader NFT market has seen fluctuations, Solana's performance showcases a notable relative strength and a growing appeal for its high-speed, low-cost architecture among NFT creators and collectors. This renewed retail and speculative interest in Solana's NFT scene could be a powerful driver of market momentum.
Bullish Bets in the Derivatives Market
Sentiment among professional traders, especially in the derivatives market, has shifted decisively toward a bullish outlook. Open interest in SOL futures, which represents the total value of all outstanding futures contracts, has seen a substantial increase over the past month, climbing by several billion dollars. This indicates a high degree of speculative interest and suggests a growing number of traders are positioning for a future price increase.
Furthermore, SOL's weighted funding rate has remained consistently positive for an extended period. The funding rate is a mechanism used by perpetual futures exchanges to keep the contract price in line with the spot price. A positive funding rate indicates that traders holding long positions are paying a premium to those holding short positions, a clear sign that the prevailing sentiment is bullish and traders expect the price to continue rising.
The Institutional Stamp of Approval
A steady drumbeat of institutional adoption continues to provide a strong fundamental floor for Solana's valuation. The launch and subsequent inflows into Solana-focused Exchange-Traded Funds (ETFs) in North America have signaled growing confidence from traditional finance. These products have seen millions of dollars in inflows on strong trading days.
This trend extends to corporate treasuries. The listing of Solana-focused companies on major stock exchanges, holding significant amounts of SOL tokens, brings considerable Wall Street exposure to the asset. This institutional demand, coupled with whale accumulation, where large holders have been observed adding to their positions, provides a powerful source of buying pressure.
The Alpenglow Upgrade
Adding to the long-term bullish case is the anticipated Alpenglow network upgrade. Approved by an overwhelming majority of validators, this upgrade is set to slash transaction finality times significantly, bringing them down to a fraction of a second. This enhancement would provide Solana with Web2-level settlement speeds, dramatically increasing its competitiveness in high-frequency applications like decentralized finance (DeFi) and gaming, and potentially driving a new wave of developer and user adoption.
Navigating the Hurdles: Resistance and Risks on the Horizon
Despite the overwhelmingly bullish confluence of factors, investors should remain aware of the potential risks and key resistance levels that lie ahead. The symmetrical triangle, until a breakout is confirmed, remains a pattern of indecision. A break below the lower support trendline could invalidate the bullish thesis and trigger a move to the downside, with potential targets at lower support levels.
Even with an upward breakout, the path to $230 is not without obstacles. Solana faces immediate resistance in the zone just above its current trading range, an area that has been tested multiple times. A more significant band of resistance is anticipated in the range between $210 and $250, where sellers may look to take profits.
Furthermore, some on-chain metrics suggest that while momentum is building, some long-term holders may be taking the opportunity to distribute their holdings, which could create selling pressure. The broader cryptocurrency market remains subject to volatility, and a downturn in major assets like Bitcoin or Ethereum could negatively impact altcoins like Solana, regardless of their individual technical and fundamental strength.
Conclusion
Solana currently presents one of the most compelling risk-reward setups in the cryptocurrency market. The formation of a rare symmetrical triangle on its price chart, following a powerful rebound, has laid the technical groundwork for a potential rally toward $230. This bullish structure is not merely a product of chart patterns; it is underpinned by a potent combination of fundamental drivers. A re-energized NFT ecosystem, overwhelmingly positive sentiment in the derivatives market, growing institutional adoption, and a landmark network upgrade on the horizon all contribute to a powerful narrative of growth and expansion.
While traders and investors must remain vigilant of key resistance levels and the inherent risks of the crypto market, the evidence suggests that Solana is coiling for a potentially explosive move. A confirmed breakout in the coming days could validate the bullish setup and send SOL on the next major leg of its upward journey, solidifying its position as a leading blockchain platform for the future of decentralized applications.

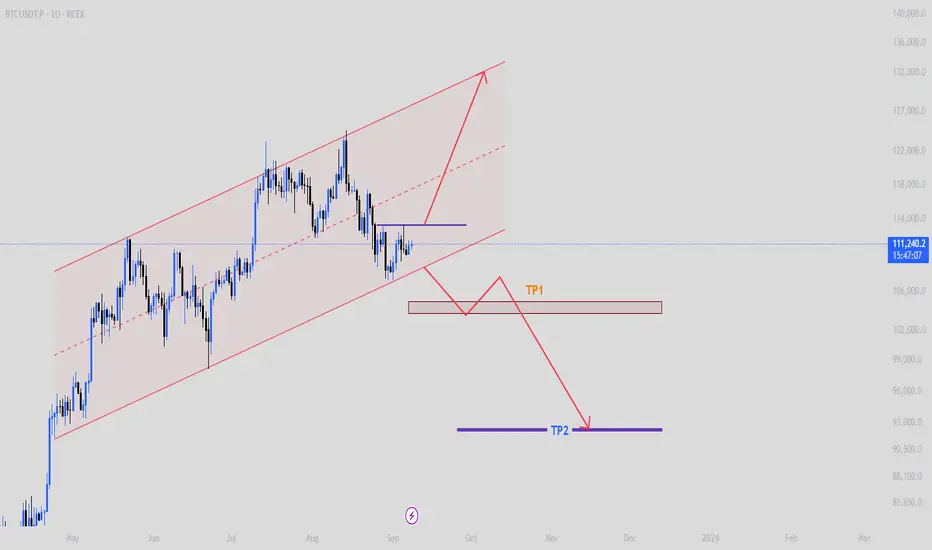
BTCUSDTThe chart is in a situation where it is impossible to decide, but two cases occur: if the channel breaks through the bottom, the targets are TP1 and TP2. Otherwise, we enter in the direction of price growth after breaking through the top.
CAD/CHF – Bearish Outlook In 3 StepsCAD/CHF – Bearish Outlook 🚨
Pair: CAD/CHF
Bias: Bearish
The CAD/CHF is showing signs of weakness
on the charts. Here’s what to think about:
Fibonacci Breakdown 📉
Price has broken below key Fibonacci
retracement levels, confirming
that the upward correction is exhausted.
Sellers are now in control, and deeper
retracement toward lower
fib zones is expected.
MACD Crossover 🔻
The MACD has crossed bearish, signaling
momentum is shifting
strongly to the downside.
This crossover aligns with the Fibonacci
breakdown, giving confluence
to the bearish setup.
Trend Context 📊
On higher timeframes, CAD/CHF
has been struggling near resistance.
Current structure suggests a potential
continuation lower as the
Canadian Dollar weakens against the Swiss Franc.
📌 Trading Plan
Sell Bias: Look for short entries
below broken fib levels.
Targets: Next Fibonacci zones
lower (0.618 → 0.786 retracement area).
Stop Loss: Above the broken
fib retracement + MACD confirmation zone.
👉 In simple words: CAD/CHF is crashing,
and technicals (Fibonacci + MACD crossover)
confirm the bearish momentum.
Rocket boost this content to learn more.
Disclaimer: Please use a simulation
trading account before you trade with
real money because trading is risky.

$FARTCOIN 50% Correction IncomingSomeone opened the bathroom window and let the air out 🪟
$FARTCOIN appears to have found a local top and closed its 2nd consecutive week below the .236 Fib
If someone doesn't shut the window this week, FARTCOIN could face ~50% correction to its next support.
that stinks 💩

ETH LONG SETUPBelow are key levels to watch
$4300 Hold on 4hr and 1hr could sustain bullish momentum
Eth went lower over the weekend to $4236 which now enables the bears to target lower prices
the 4hr EMA was held on Saturday and bullish momentum was seen at those levels, a break of the 4hr ema @4252 would send price action into bearish momentum on a longer time frame
In my opinion breaking the $4280 level will invalidate most bullish momentum and the next but of support comes in at $4250 which itself will create more bearish momentum if it gets there.
Even with all these bearish indicators, I do see price action currently swaying towards the bullish side on lower time frames,
We are looking for a retest and gold of $4300 on higher time frames.
thoughts ? lets get this bread together !!!!
