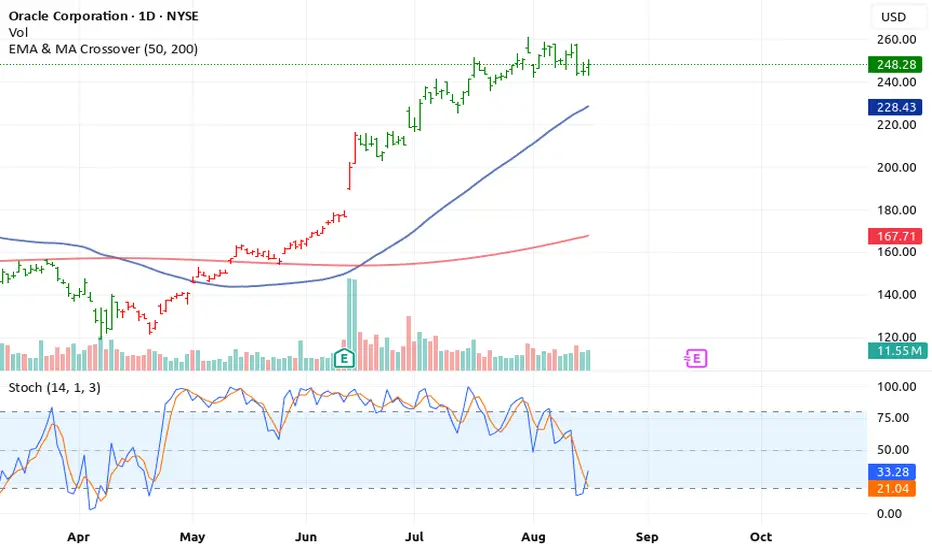
Oracle (ORCL) – 4 Bullish Signals Building UpOracle (ORCL) – 4 Bullish Signals Building Up
Technical indicators are showing that ORCL may be gearing up for a strong upward move. Multiple timeframes confirm buyers are in control. Here’s the breakdown:
1. Positive Volume Support
Recent sessions show increasing volume on upward moves, indicating that buyers are actively driving the price higher. Strong
volume confirms that the rally is supported and not a weak, unsustainable move.
2. Balance of Power (BOP) Turns Bullish
The Balance of Power (BOP) indicator has shifted into positive territory, showing that buyers have the upper hand. A bullish BOP
suggests strength and momentum in the hands of bulls, aligning with the volume trend.
3. EMA Crossover Confirms Uptrend
The short-term EMA (50 EMA) has crossed above the long-term EMA (200 EMA), a classic bullish signal. EMA crossovers often indicate a trend reversal or continuation of upward momentum.
4. Stochastic Oscillator Supports Bullish Momentum
The Stochastic oscillator shows oversold conditions that are reversing upward and is in alignment with price action. No bearish
divergence is present, confirming that the bullish momentum is healthy and sustainable.
⚡ Conclusion
All key indicators — positive volume, bullish BOP, EMA cross up, and Stochastic support — are pointing to a potential rally in
ORCL NYSE:ORCL . Traders may consider long positions, scaling in on pullbacks, or holding for trend continuation while managing risk.
Rocket boost this content to learn more
Disclaimer: This is technical analysis only and not financial advice. Always use a simulation
trading account before trading with real money, and take the time to learn risk management and profit-taking strategies to protect your capital.
Moving Averages
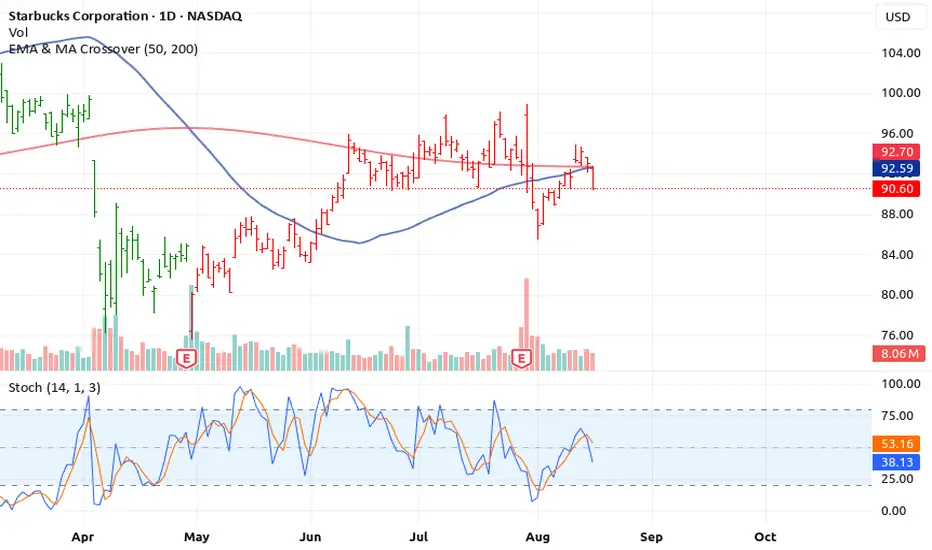
Starbucks (SBUX) – 4 Warning Signs Point to a Potential..Starbucks (SBUX) – 4 Warning Signs Point to a Potential Downturn
Traders and investors should be cautious on SBUX as multiple technical indicators are signaling a bearish outlook across different timeframes. Here’s a breakdown of the red flags:
1. Negative Volume Pressure
Recent trading sessions have shown a decline in volume on upward moves, while downward moves are backed by heavier
selling volume. This imbalance suggests that buyers are losing control, and the stock may be set for a further pullback.
2. Balance of Power (BOP) Turns Bearish
The Balance of Power (BOP) indicator, which measures buyer vs.
seller dominance, has flipped into negative territory. A bearish BOP indicates that sellers are gaining control over the market, confirming the negative volume trend.
3. EMA Crossover Signals Trend Weakness
The short-term EMA (e.g., 50 EMA) has started crossing below the
long-term EMA (e.g., 200 EMA), a classic signal of a downtrend formation. EMA crossovers are widely regarded as reliable indicators for trend direction.
4. Stochastic Divergence Confirms Bearish Momentum
Finally, the Stochastic oscillator is showing a bearish divergence, with price making higher highs while Stoch fails to confirm them.
This often precedes sharp reversals or pullbacks.
⚠️ Conclusion
All four indicators — negative volume, bearish BOP, EMA cross down, and Stochastic divergence — align to suggest that SBUX
may be heading toward a correction or short-term crash. Traders should consider tightening stops, reducing exposure, or exploring short positions in accordance with their risk strategy.
Also remember we are using the 50,200 EMA thats the rocket booster strategy
Rocket boost this content to learn more.
Disclaimer: This is technical analysis only and not financial advice. Always conduct your own research and consider your risk tolerance before making trading decisions.
Also use a simulation trading account before you trade with real money, learn risk management and profit taking strategies.
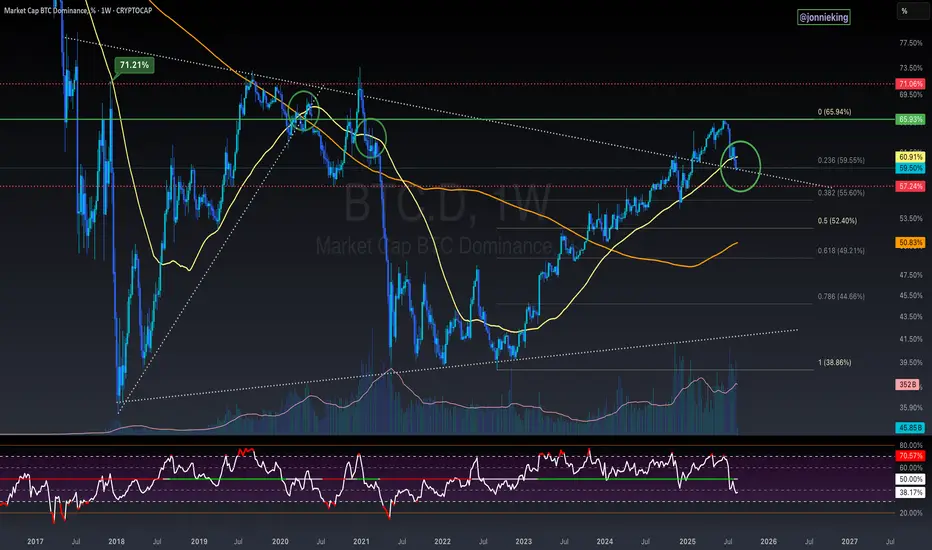
$BTC.D On the Cusp Of Breaking Down - What to WatchNothing too exciting to write home about for the Weekly Closes today, but ₿itcoin Dominance shows continued signs of breaking down, now closing the past 2 weeks below the 50WMA.
If we get one more decisive Weekly close beneath it, I’d feel very comfortable calling Alt Season.
BTC.D is also on the verge of breaking below the 8-year trendline, as well as the 0.236 Fib which would add confluence.
Breaking below 57% should seal the deal.
This will be a big week to watch.
XAU/USD 15-Min Time Frame Overview🧠 Strategy: Smart Money Concepts (SMC) + ICT-based Trade Setup
🔥 Currently, gold (XAU/USD) is trading around the 3336 zone after showing signs of accumulation within a falling wedge. A clear breakout scenario is being monitored! 👀
🟢 If price respects the lower demand block zone between 3330 to 3334 and holds this structure, we may anticipate a bullish continuation targeting:
🎯 First TP: 3339.50
🎯 Second TP: 3343.65
🎯 Final TP: 3348.79
These are clearly marked resistance levels that align with liquidity zones visible in the recent market structure.
❗ However, any strong rejection or a clean break below 3330.68 could invalidate this setup and shift bias back to bearish — so stay alert.
🛠️ This analysis is based on smart money liquidity traps, imbalance correction zones, and possible trendline manipulation, closely following institutional price behavior.
📌 Disclaimer: This content is for educational and informational purposes only and should not be considered financial advice. Always do your own research before making any trading decisions.

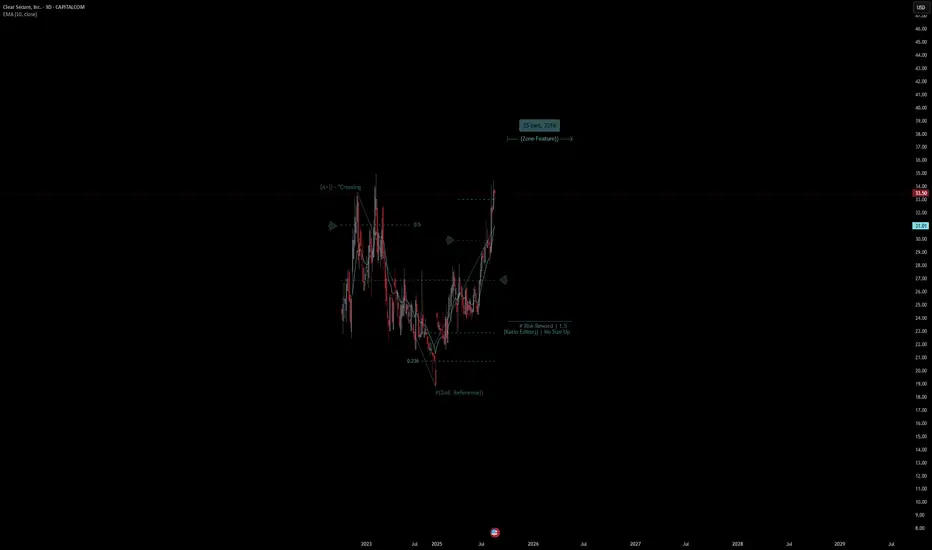
Clear Secure, Inc. | Chart & Forecast SummaryKey Indicators On Trade Set Up In General
1. Push Set Up
2. Range Set Up
3. Break & Retest Set Up
Notes On Session
# Clear Secure, Inc.
- Double Formation
* (A+)) - *Crossing - *Shift Entry - *10EMA | Subdivision 1
* #(2nd. Reference)) At 18.00 USD | No Size Up | Completed Survey
* 55 bars, 231d | Date Range Method - *(Uptrend Argument))
- Triple Formation
* (P1)) / (P2)) & (P3)) | Subdivision 2
* 3 Daily Time Frame | Trend Settings Condition | Subdivision 3
- (Hypothesis On Entry Bias)) | Regular Settings
* Stop Loss Feature Varies Regarding To Main Entry And Can Occur Unevenly
- Position On A 1.5RR
* Stop Loss At 27.00 USD
* Entry At 30.00 USD
* Take Profit At 35.00 USD
* (Uptrend Argument)) & No Pattern Confirmation
- Continuation Pattern | Not Valid
- Reversal Pattern | Not Valid
* Ongoing Entry & (Neutral Area))
Active Sessions On Relevant Range & Elemented Probabilities;
European-Session(Upwards) - East Coast-Session(Downwards) - Asian-Session(Ranging)
Conclusion | Trade Plan Execution & Risk Management On Demand;
Overall Consensus | Buy
ETH/USD 1H TIME FRAME OVERVIEWSmart ICT Follow-Up and Smart Money Concept
Ethereum is currently trading between 4460 – 4480, at a critical decision zone.
🔑 Key Points / Signals:
✅ Bullish case: If ETH holds above 4460–4480, price may push towards 4650 first, and if momentum sustains, a retest of 4790 phase is possible.
🔻 Bearish case: If rejection occurs at this range, ETH could decline towards 4300, with an extended move down to 4160 support.
📌 Traders should monitor this consolidation zone closely as it will decide the next swing move.
⚡ Price is currently coiling in a make-or-break range, awaiting confirmation for the next impulsive leg.
Disclaimer: This analysis is for educational purposes only and does not represent financial advice.

Information Services Group, Inc. | Chart & Forecast SummaryKey Indicators On Trade Set Up In General
1. Push Set Up
2. Range Set Up
3. Break & Retest Set Up
Notes On Session
# Information Services Group, Inc.
- Double Formation
* (A+)) - *Crossing - *Shift Entry - *50EMA | Subdivision 1
* #Risk Reward | 1.5 - (Structure Editor)) | No Size Up | Completed Survey
* 128 bars, 3898d | Date Range Method - *(Uptrend Argument))
- Triple Formation
* (P1)) / (P2)) & (P3)) | Subdivision 2
* Monthly Time Frame | Trend Settings Condition | Subdivision 3
- (Hypothesis On Entry Bias)) | Regular Settings
* Stop Loss Feature Varies Regarding To Main Entry And Can Occur Unevenly
- Position On A 1.5RR
* Stop Loss At 2.30 USD
* Entry At 4.00 USD
* Take Profit At 6.50 USD
* (Uptrend Argument)) & No Pattern Confirmation
- Continuation Pattern | Not Valid
- Reversal Pattern | Not Valid
* Ongoing Entry & (Neutral Area))
Active Sessions On Relevant Range & Elemented Probabilities;
European-Session(Upwards) - East Coast-Session(Downwards) - Asian-Session(Ranging)
Conclusion | Trade Plan Execution & Risk Management On Demand;
Overall Consensus | Buy

Nabors Energy Transition Corp. | Chart & Forecast SummaryKey Indicators On Trade Set Up In General
1. Push Set Up
2. Range Set Up
3. Break & Retest Set Up
Notes On Session
# Nabors Energy Transition Corp.
- Double Formation
* (EMA Settings)) - *Continuation Entry - *25EMA | Subdivision 1
* (A+)) - *Crossing At 11.00 USD | Completed Survey
* 61 bars, 427d | Date Range Method - *(Uptrend Argument))
- Triple Formation
* (P1)) / (P2)) & (P3)) | Subdivision 2
* Weekly Time Frame | Trend Settings Condition | Subdivision 3
- (Hypothesis On Entry Bias)) | Regular Settings
* Stop Loss Feature Varies Regarding To Main Entry And Can Occur Unevenly
- Position On A 1.5RR
* Stop Loss At 10.50 USD
* Entry At 11.10 USD
* Take Profit At 11.50 USD
* (Uptrend Argument)) & No Pattern Confirmation
- Continuation Pattern | Not Valid
- Reversal Pattern | Not Valid
* Ongoing Entry & (Neutral Area))
Active Sessions On Relevant Range & Elemented Probabilities;
European-Session(Upwards) - East Coast-Session(Downwards) - Asian-Session(Ranging)
Conclusion | Trade Plan Execution & Risk Management On Demand;
Overall Consensus | Buy

NEXTNAV INC | Chart & Forecast SummaryKey Indicators On Trade Set Up In General
1. Push Set Up
2. Range Set Up
3. Break & Retest Set Up
Notes On Session
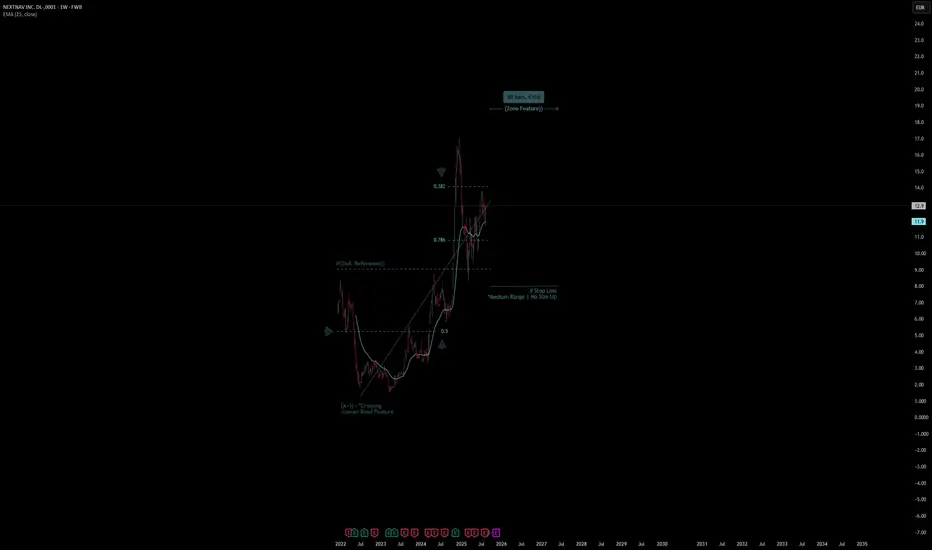
# NEXTNAV INC
- Double Formation
* (A+)) - *Crossing - Lower Band Feature - *Retest Entry - *25EMA | Subdivision 1
* #(2nd. Reference)) | No Size Up | Completed Survey
* 88 bars, 616d | Date Range Method - *(Uptrend Argument))
- Triple Formation
* (P1)) / (P2)) & (P3)) | Subdivision 2
* Weekly Time Frame | Trend Settings Condition | Subdivision 3
- (Hypothesis On Entry Bias)) | Regular Settings
* Stop Loss Feature Varies Regarding To Main Entry And Can Occur Unevenly
- Position On A 1.5RR
* Stop Loss At 8.00 EUR
* Entry At 11.00 EUR
* Take Profit At 16.00 EUR
* (Uptrend Argument)) & No Pattern Confirmation
- Continuation Pattern | Not Valid
- Reversal Pattern | Not Valid
* Ongoing Entry & (Neutral Area))
Active Sessions On Relevant Range & Elemented Probabilities;
European-Session(Upwards) - East Coast-Session(Downwards) - Asian-Session(Ranging)
Conclusion | Trade Plan Execution & Risk Management On Demand;
Overall Consensus | Buy
Western Asset Managed Fund | Chart & Forecast SummaryKey Indicators On Trade Set Up In General
1. Push Set Up
2. Range Set Up
3. Break & Retest Set Up
Notes On Session
# Western Asset Managed Fund
- Double Formation
* (Trending Attitude)) - *(A+)) - *Shift Entry - *100EMA | Subdivision 1
* # Risk Reward | 1.5 - (Ratio Editor)) | No Size Up | Completed Survey
* 201 bars, 6118d | Date Range Method - *(Downtrend Argument))
- Triple Formation
* (P1)) / (P2)) & (P3)) | Subdivision 2
* Monthly Time Frame | Trend Settings Condition | Subdivision 3
- (Hypothesis On Entry Bias)) | Regular Settings
* Stop Loss Feature Varies Regarding To Main Entry And Can Occur Unevenly
- Position On A 1.5RR
* Stop Loss At 13.00 USD
* Entry At 10.00 USD
* Take Profit At 8.00 USD
* (Downtrend Argument)) & No Pattern Confirmation
- Continuation Pattern | Not Valid
- Reversal Pattern | Not Valid
* Ongoing Entry & (Neutral Area))
Active Sessions On Relevant Range & Elemented Probabilities;
European-Session(Upwards) - East Coast-Session(Downwards) - Asian-Session(Ranging)
Conclusion | Trade Plan Execution & Risk Management On Demand;
Overall Consensus | Sell

GBP/JPY Bullish Breakout Setup – 2 Key Signals to Watch!We're keeping a close eye on a potential bullish breakout forming on the OANDA:GBPJPY and there are two strong signals pointing in that direction:
1️⃣ A recent daily Chore candle showing bullish intent
2️⃣ An Inside Bar the day after suggesting potential momentum buildup
⚠️ One thing to note: we haven’t yet violated the previous key resistance level, which could be a red flag for some traders. However, for aggressive breakout traders, this could present a solid opportunity if we get a confirmed bullish push.
If you have any questions or comments, please leave them below. And remember to hit that like button before you go.
Akil

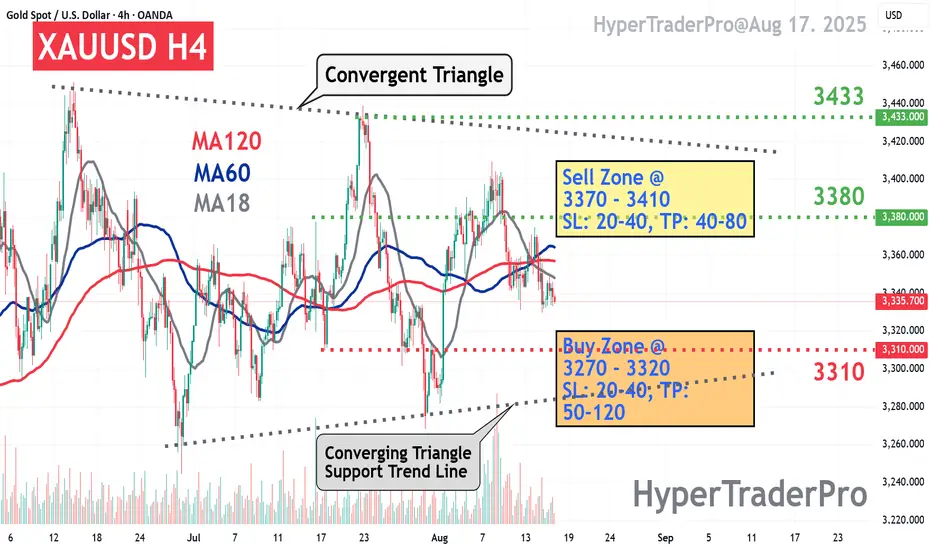
H4 shows a converging triangle patternAs shown in the chart, H4 shows a converging triangle pattern. It's recommended to trade within this converging triangle pattern: buy low and sell high. Consider buying low at the lower level of the support trend line, as a false fall breakout and rebound is possible.
Strategy:
Sell Zone @ 3370 - 3410
SL: 20-40, TP: 40-80
Buy Zone @ 3270 - 3320
SL: 20-40, TP: 50-120
ETH Dip Before ATHSimple strategy using bolinger bands and various moving averages. Liquidity zone is around $4100. Expect to dip into that and maybe wick lower before the next leg up and break through ATH.

The 3 Step Rocket Booster "Once you master this strategy ..."When you watch this video i want you to think of the
the 3 step rocket booster strategy.
Once you master this strategy then it will
be easy for you understand the other indicators
and how they work.
This video is very very advanced and i dont expect you to understand
unless you are a trading expert.
But the point am trying to make to you
is that everything is connected.
Even understanding one strategy is better than
understanding not even one.
understanding one strategy is the building block.
So in this video am taking you through
the building blocks of trading.
My strategy is very advanced but i want to show you
that even in this advanced strategy
the Rocket booster strategy
is a building block.
So watch this video to learn more now.
Rocket boost this content to learn more.
Disclaimer:Trading is risky please learn risk management and profit taking strategies also feel
free to use a simulation trading account
before you trade with real money.

RR Kabel LTD | Chart & Forecast SummaryKey Indicators On Trade Set Up In General
1. Push Set Up
2. Range Set Up
3. Break & Retest Set Up
Notes On Session
# RR Kabel LTD
- Double Formation
* (A+)) - *Crossing - *Shift Entry - *10EMA | Subdivision 1
* # Stop Loss - *Medium Range | No Size Up | No Size Up | Completed Survey
* 47 bars, 329d | Date Range Method - *(Downtrend Argument))
- Triple Formation
* (P1)) / (P2)) & (P3)) | Subdivision 2
* Weekly Time Frame | Trend Settings Condition | Subdivision 3
- (Hypothesis On Entry Bias)) | Indexed To 100
* Stop Loss Feature Varies Regarding To Main Entry And Can Occur Unevenly
- Position On A 1.5RR
* Stop Loss At 125.00 INR
* Entry At 107.00 INR
* Take Profit At 80.00 INR
* (Downtrend Argument)) & No Pattern Confirmation
- Continuation Pattern | Not Valid
- Reversal Pattern | Not Valid
* Ongoing Entry & (Neutral Area))
Active Sessions On Relevant Range & Elemented Probabilities;
European-Session(Upwards) - East Coast-Session(Downwards) - Asian-Session(Ranging)
Conclusion | Trade Plan Execution & Risk Management On Demand;
Overall Consensus | Sell

NextGen Infrastructure Income Fund | Chart & Forecast SummaryKey Indicators On Trade Set Up In General
1. Push Set Up
2. Range Set Up
3. Break & Retest Set Up
Notes On Session
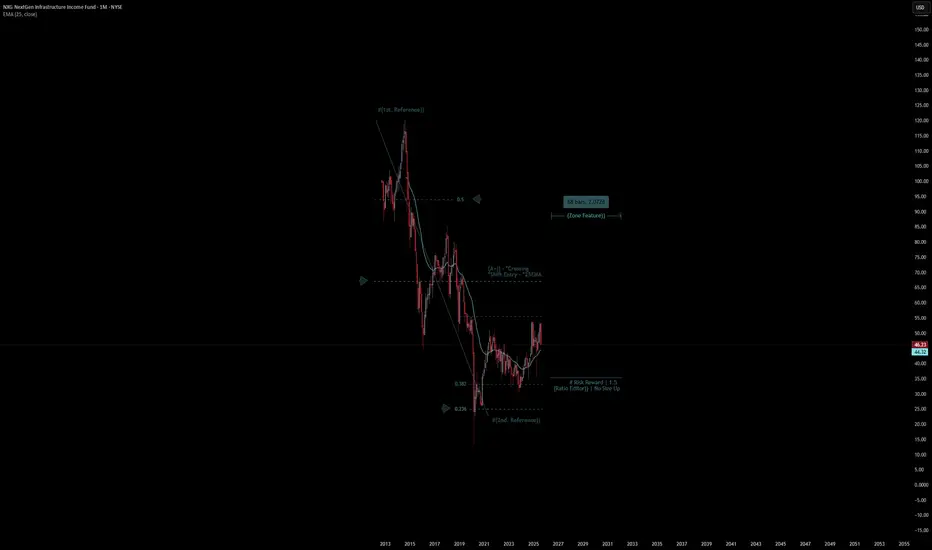
# NextGen Infrastructure Income Fund
- Double Formation
* (A+)) - *Crossing - *Shift Entry - *25EMA | Subdivision 1
* # Risk Reward | 1.5 - *(Ratio Editor)) | No Size Up | Completed Survey
* 68 bars, 2072d | Date Range Method - *(Uptrend Argument))
- Triple Formation
* (P1)) / (P2)) & (P3)) | Subdivision 2
* Monthly Time Frame | Trend Settings Condition | Subdivision 3
- (Hypothesis On Entry Bias)) | Regular Settings
* Stop Loss Feature Varies Regarding To Main Entry And Can Occur Unevenly
- Position On A 1.5RR
* Stop Loss At 23.00 USD
* Entry At 44.00 USD
* Take Profit At 76.00 USD
* (Uptrend Argument)) & No Pattern Confirmation
- Continuation Pattern | Not Valid
- Reversal Pattern | Not Valid
* Ongoing Entry & (Neutral Area))
Active Sessions On Relevant Range & Elemented Probabilities;
European-Session(Upwards) - East Coast-Session(Downwards) - Asian-Session(Ranging)
Conclusion | Trade Plan Execution & Risk Management On Demand;
Overall Consensus | Buy
Duol pivot long Teaching sessionDuol had exceptional earnings. This company is heavily Fudded and misunderstood. The massive earnings pump it saw is completely erased. We noted a recent and large capitulation candle with the massive wick, and then a dip towards the 100 EMA that was bought up. The 55 EMA has held up twice, this is the first time this moving average has been broken.
Let's look at the weekly setup from a bird's eye view. Check.
1. Average volume is rising on the weekly check.
2. BBWP was recently elevated and either flashed red or blue. Check
3. Stochastic RSI peaked or bottomed. Check
4. Bounce near a key moving average, 100 EMA. Check
The plan:
If you're bullish on the fundamentals this is a key time to add before a hopeful drop to the EMA.
If youre trading this short term I would expect a bounce and average into shares.
If youre multi week/month swing trading calls 6 months out should pair nicely with the setup.

Martin Marietta Materials Inc | Chart & Forecast SummaryKey Indicators On Trade Set Up In General
1. Push Set Up
2. Range Set Up
3. Break & Retest Set Up
Notes On Session
# Martin Marietta Materials Inc
- Double Formation
* (Diagonal Shift)) - *(A+)) - *10EMA | Subdivision 1
* #(2nd. Reference)) At 0.5 Retracement Area | Completed Survey
* 49 bars, 1494d | Date Range Method - *(Uptrend Argument))
- Triple Formation
* (P1)) / (P2)) & (P3)) | Subdivision 2
* 3 Monthly Time Frame | Trend Settings Condition | Subdivision 3
- (Hypothesis On Entry Bias)) | Indexed To 100
* Stop Loss Feature Varies Regarding To Main Entry And Can Occur Unevenly
- Position On A 1.5RR
* Stop Loss At 510.00 MXN
* Entry At 595.00 MXN
* Take Profit At 720.00 MXN
* (Uptrend Argument)) & No Pattern Confirmation
- Continuation Pattern | Not Valid
- Reversal Pattern | Not Valid
* Ongoing Entry & (Neutral Area))
Active Sessions On Relevant Range & Elemented Probabilities;
European-Session(Upwards) - East Coast-Session(Downwards) - Asian-Session(Ranging)
Conclusion | Trade Plan Execution & Risk Management On Demand;
Overall Consensus | Buy

DWS Deutschland | Chart & Forecast SummaryKey Indicators On Trade Set Up In General
1. Push Set Up
2. Range Set Up
3. Break & Retest Set Up
Notes On Session
# DWS Deutschland
- Double Formation
* (Short Cut Attitude)) - *25EMA | Subdivision 1
* (A+)) - *Crossing At 0.5 Retracement Area | Completed Survey
* 48 bars, 4382d | Date Range Method - *(Uptrend Argument))
- Triple Formation
* (P1)) / (P2)) & (P3)) | Subdivision 2
* 3 Monthly Time Frame | Trend Settings Condition | Subdivision 3
- (Hypothesis On Entry Bias)) | Indexed To 100
* Stop Loss Feature Varies Regarding To Main Entry And Can Occur Unevenly
- Position On A 1.5RR
* Stop Loss At 315.00 EUR
* Entry At 365.00 EUR
* Take Profit At 435.00 EUR
* (Uptrend Argument)) & No Pattern Confirmation
- Continuation Pattern | Not Valid
- Reversal Pattern | Not Valid
* Ongoing Entry & (Neutral Area))
Active Sessions On Relevant Range & Elemented Probabilities;
European-Session(Upwards) - East Coast-Session(Downwards) - Asian-Session(Ranging)
Conclusion | Trade Plan Execution & Risk Management On Demand;
Overall Consensus | Buy

Fasadgruppen Group AB | Chart & Forecast SummaryKey Indicators On Trade Set Up In General
1. Push Set Up
2. Range Set Up
3. Break & Retest Set Up
Notes On Session
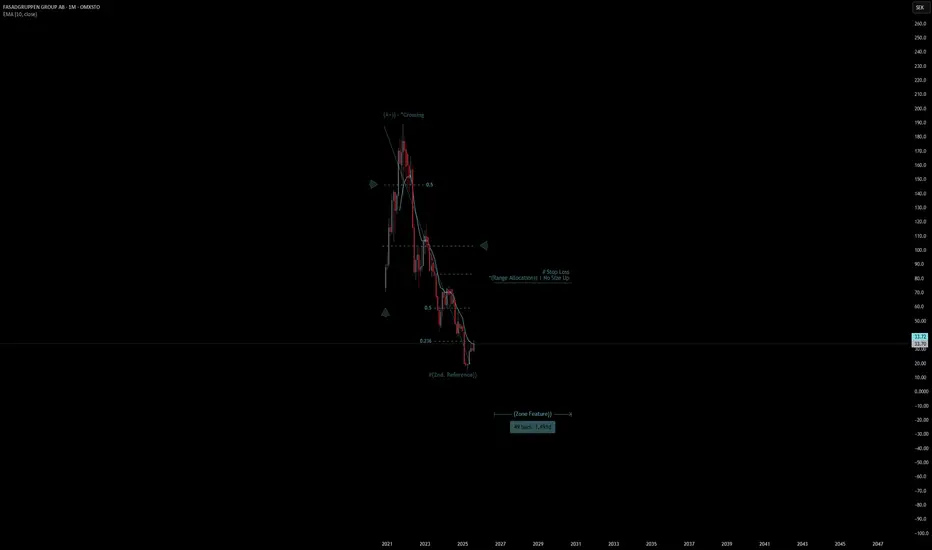
# Fasadgruppen Group AB
- Double Formation
* (A+)) - *Crossing - *10EMA | Subdivision 1
* #(2nd. Reference)) At 10.00 SEK | Completed Survey
* 49 bars, 1491d | Date Range Method - *(Downtrend Argument))
- Triple Formation
* (P1)) / (P2)) & (P3)) | Subdivision 2
* Monthly Time Frame | Trend Settings Condition | Subdivision 3
- (Hypothesis On Entry Bias)) | Indexed To 100
* Stop Loss Feature Varies Regarding To Main Entry And Can Occur Unevenly
- Position On A 1.5RR
* Stop Loss At 113.00 SEK
* Entry At 70.00 SEK
* Take Profit At 5.00 SEK
* (Downtrend Argument)) & No Pattern Confirmation
- Continuation Pattern | Not Valid
- Reversal Pattern | Not Valid
* Ongoing Entry & (Neutral Area))
Active Sessions On Relevant Range & Elemented Probabilities;
European-Session(Upwards) - East Coast-Session(Downwards) - Asian-Session(Ranging)
Conclusion | Trade Plan Execution & Risk Management On Demand;
Overall Consensus | Sell
Federated Hermes, Inc | Chart & Forecast SummaryKey Indicators On Trade Set Up In General
1. Push Set Up
2. Range Set Up
3. Break & Retest Set Up
Notes On Session
# Federated Hermes, Inc
- Double Formation
* (Diagonal Shift)) - *(A+)) - *10EMA | Subdivision 1
* 0.382 Retest Area At 45.00 USD | Completed Survey
* 30 bars, 5480d | Date Range Method - *(Uptrend Argument))
- Triple Formation
* (P1)) / (P2)) & (P3)) | Subdivision 2
* 6 Monthly Time Frame | Trend Settings Condition | Subdivision 3
- (Hypothesis On Entry Bias)) | Regular Settings
* Stop Loss Feature Varies Regarding To Main Entry And Can Occur Unevenly
- Position On A 1.5RR
* Stop Loss At 35.00 USD
* Entry At 45.00 USD
* Take Profit At 60.00 USD
* (Uptrend Argument)) & No Pattern Confirmation
- Continuation Pattern | Not Valid
- Reversal Pattern | Not Valid
* Ongoing Entry & (Neutral Area))
Active Sessions On Relevant Range & Elemented Probabilities;
European-Session(Upwards) - East Coast-Session(Downwards) - Asian-Session(Ranging)
Conclusion | Trade Plan Execution & Risk Management On Demand;
Overall Consensus | Buy

Kaushalya Logistics LTD | Chart & Forecast SummaryKey Indicators On Trade Set Up In General
1. Push Set Up
2. Range Set Up
3. Break & Retest Set Up
Notes On Session
# Kaushalya Logistics LTD
- Double Formation
* (Short Cut Attitude)) - *10EMA | Subdivision 1
* (Diagonal Shift)) - *(A+)) At 70.00 INR | Completed Survey
* 38 bars, 266d | Date Range Method - *(Downtrend Argument))
- Triple Formation
* (P1)) / (P2)) & (P3)) | Subdivision 2
* Weekly Time Frame | Trend Settings Condition | Subdivision 3
- (Hypothesis On Entry Bias)) | Regular Settings
* Stop Loss Feature Varies Regarding To Main Entry And Can Occur Unevenly
- Position On A 1.5RR
* Stop Loss At 105.00 INR
* Entry At 87.00 INR
* Take Profit At 60.00 INR
* (Downtrend Argument)) & No Pattern Confirmation
- Continuation Pattern | Not Valid
- Reversal Pattern | Not Valid
* Ongoing Entry & (Neutral Area))
Active Sessions On Relevant Range & Elemented Probabilities;
European-Session(Upwards) - East Coast-Session(Downwards) - Asian-Session(Ranging)
Conclusion | Trade Plan Execution & Risk Management On Demand;
Overall Consensus | Sell

AFCOM - Weekly closing near support levelSharp pullback seen from near 40W EMA to 10W EMA. Closing above Rs. 906 and volume need to be monitored.
