Rough Rice Commodity Quote | Chart & Forecast SummaryKey Indicators On Trade Set Up In General
1. Push Set Up
2. Range Set up
3. Break & Retest Set Up
Notes On Session
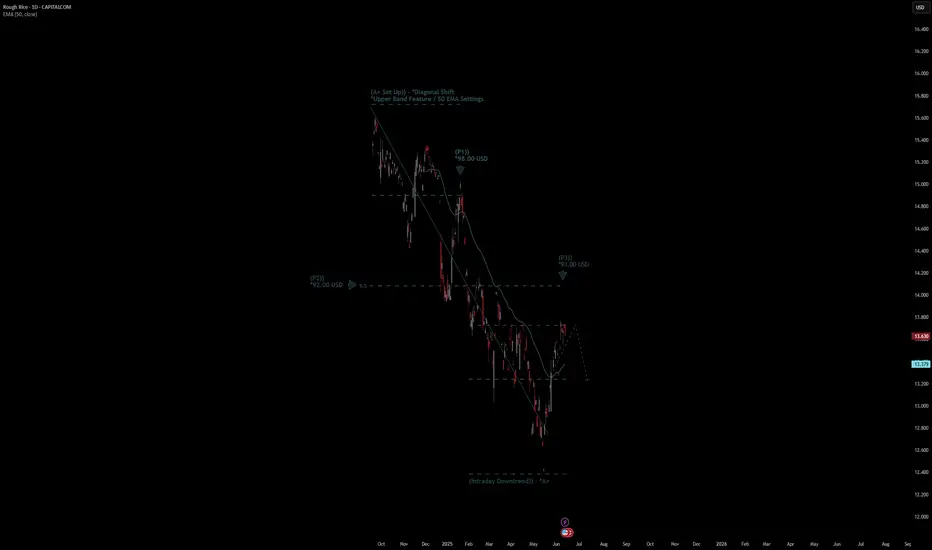
# Rough Rice Commodity Quote
- Double Formation
* (A+ Set Up)) - *Diagonal Shift | Completed Survey
* (Intraday Downtrend)) - *A+ | Subdivision 1
- Triple Formation
* (P1)) / (P2)) & (P3)) | Subdivision 2
* (TP1) | Subdivision 3
* Daily Time Frame | Trend Settings Condition
- (Hypothesis On Entry Bias)) | Indexed To 100
- Position On A 1.5RR
* Stop Loss At 90.00 USD
* Entry At 89.00 USD
* Take Profit At 86.00 USD
* (Downtrend Argument)) & No Pattern Confirmation
* Ongoing Entry & (Neutral Area))
Active Sessions On Relevant Range & Elemented Probabilities;
European-Session(Upwards) - East Coast-Session(Downwards) - Asian-Session(Ranging)
Conclusion | Trade Plan Execution & Risk Management On Demand;
Overall Consensus | Sell
Moving Averages
#XRPUSDT #4h (Bitget Futures) Descending channel near breakoutRipple just printed a dragonfly doji resting 50MA regained support, looks ready for short-term recovery.
⚡️⚡️ #XRP/USDT ⚡️⚡️
Exchanges: Bitget Futures
Signal Type: Regular (Long)
Leverage: Isolated (8.0X)
Amount: 5.2%
Entry Zone:
2.2438 - 2.2088
Take-Profit Targets:
1) 2.3535
2) 2.4493
3) 2.5450
Stop Targets:
1) 2.1199
Published By: @Zblaba
CRYPTOCAP:XRP BITGET:XRPUSDT.P #4h #Ripple #MadeInUsa xrpl.org
Risk/Reward= 1:1.2 | 1:2.1 | 1:3.0
Expected Profit= +45.7% | +80.1% | +114.5%
Possible Loss= -38.2%
Estimated Gaintime= 1-2 weeks

#AXSUSDT #4h (Bitget Futures) Falling wedge breakout and retestAxie Infinity just pulled back to 50MA support where it's bouncing, looks ready for recovery towards 200MA resistance and more.
⚡️⚡️ #AXS/USDT ⚡️⚡️
Exchanges: Bitget Futures
Signal Type: Regular (Long)
Leverage: Isolated (4.0X)
Amount: 4.7%
Current Price:
2.509
Entry Zone:
2.489 - 2.407
Take-Profit Targets:
1) 2.758
2) 2.991
3) 3.224
Stop Targets:
1) 2.189
Published By: @Zblaba
NYSE:AXS BITGET:AXSUSDT.P #4h #AxieInfinity #P2E axieinfinity.com
Risk/Reward= 1:1.2 | 1:2.1 | 1:3.0
Expected Profit= +50.7% | +88.7% | +126.8%
Possible Loss= -42.3%
Estimated Gaintime= 1-2 weeks

Novartis | NVS | Long at $99.00As one of the largest pharmaceutical companies in the world, Novartis NYSE:NVS is poised to grow well into 2027. It's trading at a 17x P/E, earnings are forecast to grow 7% per year, it has low debt, and has been raising its dividend over the past few years (3.8%). The price on the daily chart is nearing the historical simple moving average line and may be poised for another move up. However, entry into the lower $90's or even $80's is still not off the table and, in my view, a great opportunity. Thus, at $99.00, NYSE:NVS is in a personal buy zone.
Target #1 = $110.00
Target #2 = $120.00

AMC Entertainment Holdings | AMC | Long at $3.66First, I'm not an " NYSE:AMC APE" and have zero interest in becoming one. Second, don't trade NYSE:AMC unless you are fully aware the investment could go to zero or the company may devalue your trade via share dilution or other means (i.e., don't simply do as I do or blindly follow anyone else's moves, for the matter).
With that aside, I started a position/gambling play today in NYSE:AMC at $3.66. The reason is 80% technical analysis and 20% fundamentals.
Technical Analysis:
The blue line on the chart represents an average true range (ATR) from a historical simple moving average (SMA) that I use for trading. For simplicity, the historical SMA is not show on the chart - just the ATR. This blue ATR line has historically been a major line of resistance and support. When it breaks through and holds, the stock goes bull - but history may not repeat. The price recently broke the blue ATR line, fell below, and the broke out again today. This may be a sign that the downward trend (overall) is changing - perhaps furthering the accumulation phase in the $3s or a gradual rise from here. And with today's breakout, I grabbed shares at $3.66.
Fundamentals
Since 2020, NYSE:AMC has shown major gains in revenue and net income (loss reduction, that is). Revenu: $1.24 billion (2020); $2.53 billion (2021); $3.91 billion (2022); 4.81 billion (2023); $4.4 billion (2024, Q1-3 only). Net Income: -$4.5 billion (2020); -$1.27 billion (2021); -$973 million (2022); -$396 million (2023); -$399 million (2024, Q1-3 only). The company is not expected to become profitable until Q4 of 2026 , but the improvements are what one would like to see.
Counter-arguments and statements the stock is junk are totally valid. But the chart is quite interesting as the company moves toward profitability (maybe...).
Targets:
$4.30
$6.00
Squeeze/mass hysteria: $18.00, $40.00, and ridiculousness: $85.00

Ironwood Pharmaceuticals | IRWD | Long at $0.61Ironwood Pharma NASDAQ:IRWD stock dropped ~89% in the past year due to disappointing Phase 3 Apraglutide trial results, FDA requiring an additional trial, weak Q1 2025 earnings (-$0.14 EPS vs. -$0.04 expected), high debt ($599.48M), and analyst downgrades. So why would I be interested in swing trading this company? The chart. The price has entered my "crash" simple moving average zone, which often results in a reversal - even if temporary. Also, Linzess (GI drug) revenue is steady, and I thoroughly believe that alone pushes the fair value near $0.95, if not higher. Thus, at $0.61, NASDAQ:IRWD is in a personal buy zone with the potential for additional declines before future rise.
Target:
$0.95 (+55.7%)

BUYS PROJECTION OF XAUUSD Hey everyone good afternoon and yes this entry will be the one I will be executing yesterday own was good but this is much better after refining my charts again so I will be waiting for price to breakout 3434 zone and set up a buy limit to take buys to a new ATH the reason am interested on that zone is that anytime Gold gets to a strong zone either support or resistance price moves hugely and that zone is one of them so let’s see how it plays out….

MercadoLibre Pulls BackMercadoLibre rallied to new highs last month, and some traders may see an opportunity in its latest pullback.
The first pattern on today’s chart is the $2,374.54 level. MELI first touched that price on February 21 after reporting strong earnings. The stock gapped above the level in May on another strong quarterly report and has now retested it. Will the old resistance emerge as new support?
Second, price gains after the last two quarterly reports may reflect positive fundamental sentiment in the Latin American e-commerce company.
Third, stochastics have dipped to an oversold condition.
Check out TradingView's The Leap competition sponsored by TradeStation.
TradeStation has, for decades, advanced the trading industry, providing access to stocks, options and futures. If you're born to trade, we could be for you. See our Overview for more.
Past performance, whether actual or indicated by historical tests of strategies, is no guarantee of future performance or success. There is a possibility that you may sustain a loss equal to or greater than your entire investment regardless of which asset class you trade (equities, options or futures); therefore, you should not invest or risk money that you cannot afford to lose. Online trading is not suitable for all investors. View the document titled Characteristics and Risks of Standardized Options at www.TradeStation.com . Before trading any asset class, customers must read the relevant risk disclosure statements on www.TradeStation.com . System access and trade placement and execution may be delayed or fail due to market volatility and volume, quote delays, system and software errors, Internet traffic, outages and other factors.
Securities and futures trading is offered to self-directed customers by TradeStation Securities, Inc., a broker-dealer registered with the Securities and Exchange Commission and a futures commission merchant licensed with the Commodity Futures Trading Commission). TradeStation Securities is a member of the Financial Industry Regulatory Authority, the National Futures Association, and a number of exchanges.
TradeStation Securities, Inc. and TradeStation Technologies, Inc. are each wholly owned subsidiaries of TradeStation Group, Inc., both operating, and providing products and services, under the TradeStation brand and trademark. When applying for, or purchasing, accounts, subscriptions, products and services, it is important that you know which company you will be dealing with. Visit www.TradeStation.com for further important information explaining what this means.

eHealth | EHTH | Long at $4.22eHealth NASDAQ:EHTH , the largest online private health insurance marketplace, may be undervalued. The book value is listed around $19 a share and it has a debt-to-equity of 0.07x (healthy), a quick ratio of 2.5 (strong liquidity, can cover liabilities), growing revenue since 2021 (over $500M in 2024), and insiders have recently bought shares/awarded options. However, profitability is still a concern, but the company is expected to be profitable by 2026. With the US's aging population and the need for affordable healthcare coverage, eHealth *may* standout as a major insurance marketplace... but time will tell.
From a technical analysis perspective, the stock price is near the bottom of its historical simple moving average. I do not doubt, however, that the stock may slip to cover the small price gap between $3.09 and $3.23 (which will be another entry point if fundamentals do not change). This stock may trade sideways for some time. But it has a 27M float and as we saw in 2014 and 2020, it can REALLY get going if buyers see the opportunity...
Thus, at $4.22, NASDAQ:EHTH is in a personal buy zone with more opportunity potentially near $3 in the future.
Targets:
$6.00 (+42.2%)
$8.00 (+89.6%)

Kinetik Holdings Inc. Stock Quote | Chart & Forecast SummaryKey Indicators On Trade Set Up In General
1. Push Set Up
2. Range Set up
3. Break & Retest Set Up
Notes On Session
# Kinetik Holdings Inc. Stock Quote
- Double Formation
* (A+ Set Up)) Start At 70.00 USD | Completed Survey
* (Area Of Value)) Ending At 40.00 USD | Subdivision 1
- Triple Formation
* (P1)) / (P2)) & (P3)) | Subdivision 2
* (TP1) | Subdivision 3
* Daily Time Frame | Trend Settings Condition
- (Hypothesis On Entry Bias)) | Regular Settings
- Position On A 1.5RR
* Stop Loss At 48.00 USD
* Entry At 44.00 USD
* Take Profit At 37.00 USD
* (Downtrend Argument)) & No Pattern Confirmation
* Ongoing Entry & (Neutral Area))
Active Sessions On Relevant Range & Elemented Probabilities;
European-Session(Upwards) - East Coast-Session(Downwards) - Asian-Session(Ranging)
Conclusion | Trade Plan Execution & Risk Management On Demand;
Overall Consensus | Sell

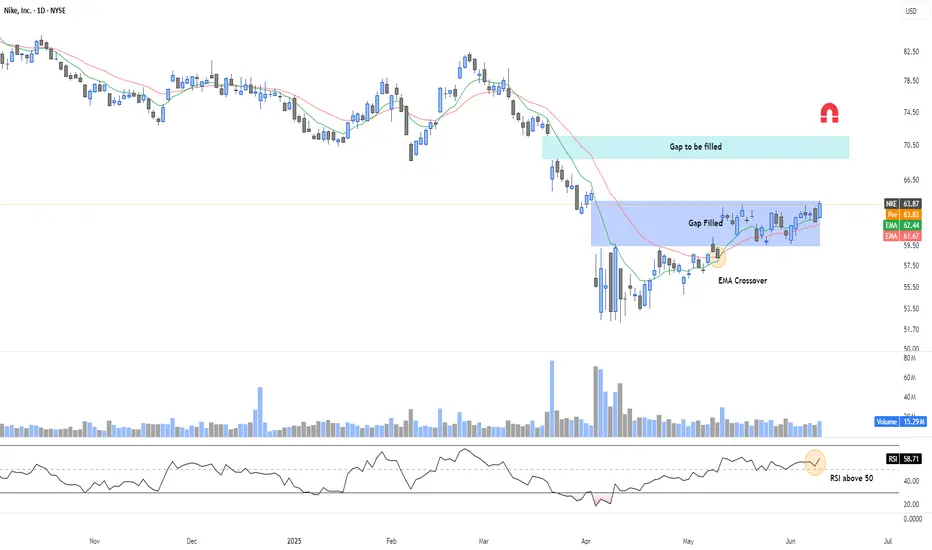
NKE – EMA Crossover and Bullish Continuation PotentialNIKE (NKE) has completed a clean technical gap fill and is now showing early signs of a trend reversal.
🔍 Key Technical Factors:
✅ Gap Filled: The March-April gap was filled cleanly and held.
✅ EMA Crossover: EMA 9 crossed above EMA 21 → bullish short-term signal.
✅ RSI > 50: Momentum shifting bullish; RSI reclaiming territory above neutral.
✅ Volume Confirmation: Increasing activity during the breakout attempt.
🎯 Next Target: Gap to fill around $70.50
📈 Strategy Outlook:
If price closes above $64.00, this could trigger continuation toward the next gap.
Invalidation below $61.50 (EMA cluster and recent base).
VIC hope you are watching it.---
### 🇻🇳 Vin Group (VIC): An On-the-Ground Perspective from Vietnam 📈
After first visiting Vietnam in 2022, it became clear Vin Group is doing a lot of interesting things in Vietnam. To me, Vin Group seemed like an obvious thing to get exposure to a lot of the growth in Vietnam.
* **Accessibility Note:** HOSE:VIC is not easily available outside Vietnam, other than within Vietnamese indexes.
---
### The NASDAQ:VFS Anomaly & Free Float Insights
While in 2023, NASDAQ:VFS (VinFast) went to prices that defied all logic on US markets, US media most likely had no idea about $VIC. All you needed to do was see that HOSE:VIC held most of the NASDAQ:VFS shares (I thought it was 80%, but some suggestions indicate it might have been closer to 99%).
* **Key Takeaway:** A lot of retail investors won't understand free float risks. Starting my investing journey in the crypto space, I am well versed in dealing with assets with low float.
**(Image 1: VFS Marketcap)**
` `
*VFS Marketcap*
**(Image 2: VIC Marketcap & The Disconnect)**
` `
*VIC Marketcap – Note: VIC is in VND, VFS in USD. At one point, HOSE:VIC (approx. $12B USD) held VFS shares valued vastly higher, highlighting a significant market disconnect.*
> Needless to say, I wanted exposure to the things Vin Group was doing but chose to wait rather than join that insanity.
---
### An Expat's View: Seeing Vietnam's Transformation zmiany
As of Q4 2023, I moved to Vietnam. Living here, I get to see what's going on. Though I am still a foreigner, I get a different perspective.
> You see, when you look in the mirror every day, it's hard to see the changes. Then you see that family member you haven't seen in a while who still thinks you're 6, but you're actually 16. This is the case in Vietnam; many people came years ago and think it's the same or worse, or perhaps just watched a movie.
---
### Understanding Vietnam's Economic DNA: Đổi Mới and its People 🚀
To understand economics in Vietnam, you must first understand **Đổi Mới** – those changes are the start of economic success in Vietnam.
* **Human Capital:**
* First-generation university/college-educated individuals are very common.
* First-generation English, Chinese, or Korean speakers are gaining more access to markets outside Vietnam. (Korean is significant for FDI and cultural influence like movies/TV).
* **The Vietnamese Grit:** Many Vietnamese had very rough younger lives, and grit is a character trait they could win prizes for. It's seen in an extreme you don't find in other places. They just won't quit.
* **International Relations:** International business requires friendliness, and they choose to be friendly with everyone.
> Investing is about backing winners so that you can win with them.
---
### Navigating Vin Group's Diverse Portfolio:
**1. Real Estate Market & HOSE:VIC :**
The real estate market has struggled after the incident with Truong My Lan. A lot of stuff is empty and unsold. I have no clue when Vietnamese housing will top or bottom. While HOSE:VIC is largely made up of real estate, I believe that with lower mortgage rates now, they will sell properties they have and don't want, moving debt and assets off the balance sheet.
**2. VinFast ( NASDAQ:VFS ) & Xanh SM 🚕:**
* **Indonesian Expansion:** Watch for expansion into Indonesia – a massive, often underestimated market. (Unless it's someone who follows National GDP rankings globally and other macroeconomics.)
* **Path to Profitability:** VinFast just needs to reach a point where it's no longer cash-flow negative.
* **Long-Term Value:** The money will come from the Vision training they are doing.
* **Xanh SM (Taxi Service):**
* Now the largest taxi company in Vietnam.
* Creates organic demand (buy pressure) for VinFast cars.
* **A Better "Green" Product:** Unlike my experience in Canada where "green" options often felt forced and uncompetitive, Xanh SM is something you take because it's simply a *better product*. Smart, innovative people can make something "Green" AND better for the consumer. If you haven't tried it, just try it – it's better in every way (specifically the VinFast cars).
* **Scooter Critique:** The VinFast scooter needs a very simple change. The handle to hold onto the scooter located on the back is really bad. If I had one request, it would be to change that handle; it's awful. Put a large man in the front and try it.
**3. Vin Bus 🚌:**
Wow, the bus is the same quality as the newest buses I have seen in Canada, with one huge change: They are *extremely clean*. I have never been on a dirty VinBus.
**4. Vin Homes 🏡:**
Truly amazing, with great amenities. Lots of people run or play sports in the early morning. Mall access, VinBus access.
**5. Other Ventures:**
* **VinSchool & VinMec:** I've heard a lot of great stuff, but I haven't used them personally.
* **VinWonders Theme Park:** Also a lot of fun.
* **Vin Group Hotels:** Can also be really great.
---
### My Investment Journey with HOSE:VIC charted
**(Image 3: My Entry Point)**
` `
*So when did I actually get into Vin Group? In 2024.*
**(Image 4: Weekly MACD Signal)**
` `
*To me, this weekly MACD made it really obvious downside momentum was done. It was a matter of time to buy it up.*
* **Stop-Loss:** Having a stop-loss was also pretty obvious with the 2023 low.
* **Sentiment:** Sentiment was also really low.
* **Conviction:** Yet, I kept using the products of HOSE:VIC subsidiary companies, thinking the only way I see this company not doing better is if it goes bankrupt. The products are definitely amazing.
* **Debt vs. Rates:** If you looked at the company balance sheets, debt was a risk, but Vietnam changed its rates, and eventually, most nations will change their rates.
---
### Price Targets & Risk Management for HOSE:VIC 📈📉
**(Image 5: Long-Term View & Current RSI)**
` `
* **Long-Term Target:** I think this Company could go well over **200k VND**.
* **Short-Term Caution:** Price going straight up is risky. With 2024 buying, you could have a narrow stop-loss. In 2025, with this price movement, a simple weekly reversion to the mean would be very rough.
* **Overbought RSI:** The RSI hit 97 – not a number that makes me think, "Wow, lots of room to grow immediately."
> For me, I want to hold enough stock that I am okay if, before going to 200k VND, we first go back to 60k VND.
---
**Disclaimer:**
*The information provided in this post is for educational and informational purposes only. It does not constitute financial advice, investment recommendations, or a solicitation to buy or sell any financial instruments. All investments involve risk, and the past performance of a security, market, or trading strategy does not guarantee future results. I am not a financial advisor. Please conduct your own thorough research and consult with a qualified financial professional before making any investment decisions. You are solely responsible for any investment decisions you make.*

Swing Trade Plan: Rama Phosphates Ltd“Rama Phosphates Ltd is showing a technically strong breakout backed by volume and supported by a fundamentally improving outlook. The current level offers a favorable risk-reward swing opportunity for a 5–10 day holding period.”
Technical Overview:
Current Price: ₹123.03
20 EMA: ₹117.96 (Price above 20 and 50 EMA = short term and medium term indicator)
Breakout after facing a consolidation zone (₹113–₹119 range) with Strong bullish candle and volume confirmation.
📌 Fundamental View:
The company is fundamentally stable with growth potential in the fertilizer sector, especially during monsoon-driven demand spikes. Technical strength now aligns with mid-term fundamental value.
Company P/E ratio is attractive debt free or low debt which is positive sign for small cap. company's quarterly performance is good. company gives regular dividends which adds investors confidence.
📊 Trade Levels:
Buy Zone 121–123 Breakout confirmation entry
Stop Loss 116 Below 20 EMA and recent support zone
Target 1 130 Previous swing high
Target 2 138–140
Risk–Reward ~1:2.5

GD : Worth WatchingI am one of those who think that General Dynamics stock should be watched carefully for a while.
The trend line was drawn by taking into account past tariff discussions and the price movements that resulted from them.
What we need:
Volume data with a clear increase
Persistence above the 50 and 200-period moving averages
Persistence above the FIBO 0.5 retracement level (278.23) for a while
I am currently neutral but keeping an eye on long positions.
Regards.

Is BNB About to Explode—or About to Collapse?Yello Paradisers! Could this be the beginning of the next BNB rally, or just another classic trap to liquidate early longs before the real move begins? Let’s dive into this high-probability setup before it’s too late.
💎BNBUSDT is currently showing good signs of bullish continuation. The price has successfully broken out of a descending channel and performed a precise retest of that structure—an early confirmation of strength. Following this, we’ve seen a strong reaction from a Fair Value Gap (FVG) and the 200 EMA, both of which align perfectly with the inducement taken just before the bounce. This confluence of technical signals significantly increases the probability of a sustained bullish move in the near term.
💎If price pulls back from current levels, it could offer us a more attractive risk-to-reward opportunity for long entries. Traders who are targeting higher RR ratios, such as 1:2 or beyond, may prefer to wait for a deeper pullback into our predefined support zone for a cleaner entry. This zone remains critical for maintaining our bullish bias.
💎However, if the price breaks down and we see a full candle close below that support zone, the entire bullish scenario becomes invalid. In such a case, it would be more prudent to stay on the sidelines and wait for a clearer and more favorable price action setup to emerge before jumping back in.
We are playing it safe right now. If you want to be consistently profitable, you need to be extremely patient and always wait only for the best, highest probability trading opportunities.
MyCryptoParadise
iFeel the success🌴

BX : First Attempt at Silent StockBlackstone has now decided to invest in Europe.
The stock is technically above the 50 and 200 period moving averages.
After leveling the trend line, an increase in volume was also observed.
In that case, holding a short-medium term or opening a long position with a reasonable risk/reward ratio in a small position size will not hurt us.
I have kept the stop-loss a little tighter now because even if the stop level comes in a sudden drop, it can be tried again. If that happens, I will share it as a new idea.
Risk/Reward Ratio : 3.00
Stop-Loss : 132.53
Take-Profit : 141.73

AVAX About to Nuke Longs Before Pumping to $30?Yello Paradisers — are you prepared for the next major #AVAX move, or will you once again fall into the trap smart money is setting right now? The chart is screaming probable bullish continuation, but not before one final trick to flush out weak hands. We warned you before — and now the game is unfolding exactly as expected.
💎#AVAXUSDT has clearly broken market structure by forming a higher high, confirming a potential trend shift. However, price failed to close above the 25.82–26.93 resistance zone, leaving the bullish breakout unconfirmed. This hesitation right at a critical level increases the probability of a fakeout or liquidity sweep before any continuation.
💎Right now, we are hovering just above the ascending trendline, and based on current structure, the most probable scenario is a sweep of that trendline liquidity, grabbing stops from impatient longs before the market forms a clean higher low and reverses aggressively to the upside.
💎The green zone around 22.00–23.00, which previously acted as resistance, has now flipped to support. As long as price holds above this level, the bullish probability remains dominant. However, if we see a temporary dip below the trendline toward the 19.08 region, where support lies, that would likely be a classic liquidity hunt — designed to trigger fear, force early exits, and then reverse powerfully into the next leg.
💎And while both scenarios favor upside, it is the path of maximum frustration — likely a wick into 19.00 — that has historically proven most probable before larger breakouts.
💎A sustained move above the 26.93 level, especially on a daily candle close, would significantly increase the probability of continuation toward the major resistance between 30.00 and 30.74. This zone remains the main upside target in the short to mid-term.
💎On the other hand, if price closes below 16.67, that would invalidate this bullish outlook and open the door to deeper downside. Until then, structure remains bullish, and the higher-probability outcome still favors upside after a potential short-term shakeout.
This is the point where the weak hands get shaken out and smart money reloads, Paradisers. If you're aiming for long-term success, wait for high-probability setups and protect your capital. Strive for consistency, not quick profits. Treat the market as a businessman, not as a gambler.
MyCryptoParadise
iFeel the success🌴

Broadcom Dips After EarningsBroadcom is pulling back after reporting quarterly results, and potential buyers may be waiting.
The first pattern on today’s chart is the price zone between the late-May weekly low of $221.60 and the February high of $237.93. This may be an initial area where traders look for support.
Second, the 21-day exponential moving average (EMA) is approaching from below. That may suggest the chip stock’s short-term trend is still bullish.
Third, Wilder’s Relative Strength Index (RSI) is dipping from an overbought condition. A reading closer to the midpoint around 50 could potentially satisfy investors worried about chasing.
Finally, AVGO is an active underlier in the options market. (Its average daily volume is about 240,000 contracts in the last month.) That could make it easier for traders to take positions with calls and puts.
Check out TradingView's The Leap competition sponsored by TradeStation.
TradeStation has, for decades, advanced the trading industry, providing access to stocks, options and futures. If you're born to trade, we could be for you. See our Overview for more.
Past performance, whether actual or indicated by historical tests of strategies, is no guarantee of future performance or success. There is a possibility that you may sustain a loss equal to or greater than your entire investment regardless of which asset class you trade (equities, options or futures); therefore, you should not invest or risk money that you cannot afford to lose. Online trading is not suitable for all investors. View the document titled Characteristics and Risks of Standardized Options at www.TradeStation.com . Before trading any asset class, customers must read the relevant risk disclosure statements on www.TradeStation.com . System access and trade placement and execution may be delayed or fail due to market volatility and volume, quote delays, system and software errors, Internet traffic, outages and other factors.
Securities and futures trading is offered to self-directed customers by TradeStation Securities, Inc., a broker-dealer registered with the Securities and Exchange Commission and a futures commission merchant licensed with the Commodity Futures Trading Commission). TradeStation Securities is a member of the Financial Industry Regulatory Authority, the National Futures Association, and a number of exchanges.
Options trading is not suitable for all investors. Your TradeStation Securities’ account application to trade options will be considered and approved or disapproved based on all relevant factors, including your trading experience. See www.TradeStation.com . Visit www.TradeStation.com for full details on the costs and fees associated with options.
Margin trading involves risks, and it is important that you fully understand those risks before trading on margin. The Margin Disclosure Statement outlines many of those risks, including that you can lose more funds than you deposit in your margin account; your brokerage firm can force the sale of securities in your account; your brokerage firm can sell your securities without contacting you; and you are not entitled to an extension of time on a margin call. Review the Margin Disclosure Statement at www.TradeStation.com .
TradeStation Securities, Inc. and TradeStation Technologies, Inc. are each wholly owned subsidiaries of TradeStation Group, Inc., both operating, and providing products and services, under the TradeStation brand and trademark. When applying for, or purchasing, accounts, subscriptions, products and services, it is important that you know which company you will be dealing with. Visit www.TradeStation.com for further important information explaining what this means.

Grocery Outlet Stock Quote | Chart & Forecast SummaryKey Indicators On Trade Set Up In General
1. Push Set Up
2. Range Set up
3. Break & Retest Set Up
Notes On Session
# Grocery Outlet Stock Quote
- Double Formation
* (A+ Set Up)) At 45.00 USD | Completed Survey
* Wave Feature On Wave *(5)) | Subdivision 1
- Triple Formation
* (P1)) / (P2)) & (P3)) | Subdivision 2
* (TP1) | Subdivision 3
* Daily Time Frame | Trend Settings Condition
- (Hypothesis On Entry Bias)) | Regular Settings
- Position On A 1.5RR
* Stop Loss At 17.00 USD
* Entry At 14.00 USD
* Take Profit At 8.00 USD
* (Downtrend Argument)) & No Pattern Confirmation
* Ongoing Entry & (Neutral Area))
Active Sessions On Relevant Range & Elemented Probabilities;
European-Session(Upwards) - East Coast-Session(Downwards) - Asian-Session(Ranging)
Conclusion | Trade Plan Execution & Risk Management On Demand;
Overall Consensus | Sell

Has JD.com Bottomed?JD.com has languished for a couple of months, but some traders may think the Chinese e-commerce stock has bottomed.
The first pattern on today’s chart is the April low of $31.80. JD closed below the level once in May but quickly rebounded. That could be interpreted as a false breakdown.
Second, MACD made a higher low as prices made a lower low . Such “bullish divergence” can potentially signal reversals.
Third, the stock crossed above the 8- and 21-day exponential moving averages and is pulling both higher. That may suggest its short-term direction is now pointing upward.
Fourth, the rising 200-day simple moving average could reflect the presence of a longer-term uptrend.
Last, consider the February low around $38. JD stalled around the same area in April and May. With the stock more than 10 percent below that old resistance, could chart watchers see further space to the upside?
Check out TradingView's The Leap competition sponsored by TradeStation.
TradeStation has, for decades, advanced the trading industry, providing access to stocks, options and futures. If you're born to trade, we could be for you. See our Overview for more.
Past performance, whether actual or indicated by historical tests of strategies, is no guarantee of future performance or success. There is a possibility that you may sustain a loss equal to or greater than your entire investment regardless of which asset class you trade (equities, options or futures); therefore, you should not invest or risk money that you cannot afford to lose. Online trading is not suitable for all investors. View the document titled Characteristics and Risks of Standardized Options at www.TradeStation.com . Before trading any asset class, customers must read the relevant risk disclosure statements on www.TradeStation.com . System access and trade placement and execution may be delayed or fail due to market volatility and volume, quote delays, system and software errors, Internet traffic, outages and other factors.
Securities and futures trading is offered to self-directed customers by TradeStation Securities, Inc., a broker-dealer registered with the Securities and Exchange Commission and a futures commission merchant licensed with the Commodity Futures Trading Commission). TradeStation Securities is a member of the Financial Industry Regulatory Authority, the National Futures Association, and a number of exchanges.
TradeStation Securities, Inc. and TradeStation Technologies, Inc. are each wholly owned subsidiaries of TradeStation Group, Inc., both operating, and providing products and services, under the TradeStation brand and trademark. When applying for, or purchasing, accounts, subscriptions, products and services, it is important that you know which company you will be dealing with. Visit www.TradeStation.com for further important information explaining what this means.

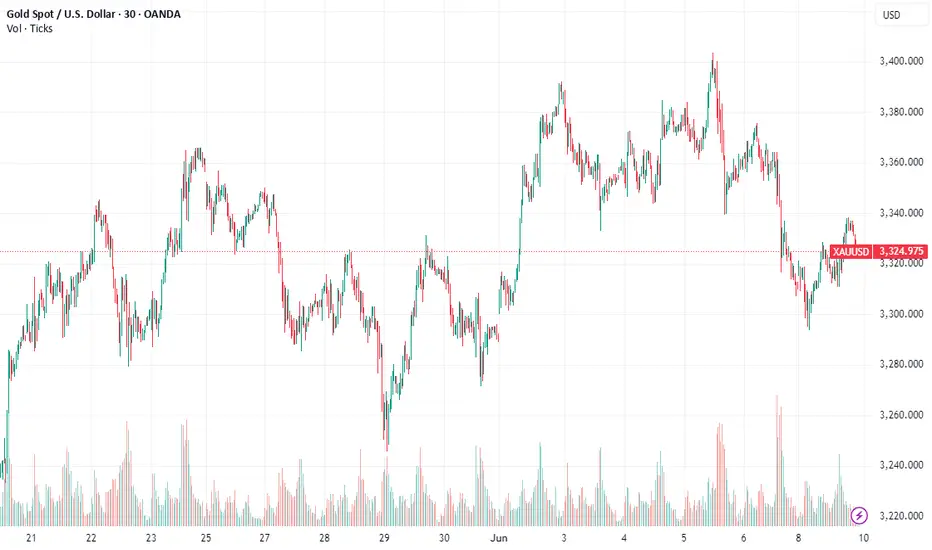
Gold to $3400As gold has a lot of support, June's pivot, 200MA on 4hour, the white trendline... and it has a bullish divergence, I think $3400 is very likely for gold.

$TOTAL Crypto Market Cap Relief Rally Could be MassiveHUGE relief rally today for Crypto CRYPTOCAP:TOTAL Market Cap 🚨
Need to reclaim local high at $3.5T to confirm this reversal.
If so, we could push to reclaim this cycle's high ~$3.75T
Nonetheless, glad I got some bids filled on this recent correction 😎
I still have some set in case we go lower tho.

Silver & Gold Surge: SLV Inflows & GLD TargetsThe precious metals market is currently experiencing a significant surge, with both silver and gold capturing the attention of investors worldwide. This rally is underpinned by a confluence of factors, ranging from robust investment inflows into exchange-traded funds (ETFs) to evolving macroeconomic landscapes and persistent geopolitical uncertainties. The iShares Silver Trust (SLV) ETF has witnessed an unprecedented influx of capital, signaling a strong bullish sentiment for the white metal, while gold, represented by the GLD, is poised for a potential rebound, with analysts eyeing key price levels. Understanding the intricate dynamics driving these movements is crucial for anyone looking to navigate the contemporary financial markets.
SLV ETF Inflows Surge: Silver's Accelerated Rally
The iShares Silver Trust (SLV), the world's largest silver-backed exchange-traded fund, has recently recorded its most substantial inflows in years, marking a pivotal moment for the silver market. Last week alone, the SLV ETF saw weekly inflows surge by $451 million, a dramatic increase from previous weeks, pushing its year-to-date inflows to over $458 million and its total assets under management to more than $17 billion. This remarkable accumulation of capital into SLV signifies a profound shift in investor sentiment, reflecting a strong conviction that silver prices are set for continued appreciation. When investors pour money into an ETF like SLV, it directly translates into the fund acquiring more physical silver, thereby tightening supply and exerting upward pressure on prices. This massive inflow is not merely speculative; it indicates a broad-based belief among both institutional and retail investors in silver's potential.
Several key factors are fueling this accelerated rally in silver prices. One significant driver is the record-breaking surge in gold prices. Historically, silver has often been referred to as "poor man's gold" due to its similar safe-haven properties but lower price point. When gold experiences a substantial rally, silver often follows suit, as investors look for a more affordable alternative within the precious metals complex. Gold's recent ascent to nearly $3,500 per ounce has undoubtedly created a halo effect for silver, drawing in capital from those seeking exposure to precious metals without the higher entry cost of gold.
Another compelling reason for silver's outperformance is its perceived undervaluation relative to gold. The gold/silver ratio, which measures how many ounces of silver are needed to buy one ounce of gold, had peaked at around 106 when gold was surging. However, this ratio has since dropped significantly to around 92, indicating that silver has begun to catch up, suggesting it was previously undervalued. This rebalancing of the ratio has encouraged investors to shift their focus towards silver, anticipating further narrowing of the gap.
Beyond its role as a monetary metal and safe haven, industrial demand plays a uniquely critical role in silver's price dynamics, distinguishing it from gold. Silver is an indispensable component in numerous high-tech and green energy applications due to its exceptional electrical conductivity, thermal properties, and reflectivity. The renewable energy sector, particularly photovoltaic (PV) solar panels, consumes substantial amounts of silver, with each panel containing approximately 20 grams of the metal. The global push towards decarbonization and the increasing adoption of solar energy are creating an insatiable demand for silver. Additionally, its use in electric vehicles (EVs), electronics manufacturing, 5G technology, and medical devices further bolsters its industrial consumption. Reports indicate that global silver demand reached 1.2 billion ounces in 2024, driven by these industrial applications, with a significant supply deficit projected to continue. This robust and growing industrial demand provides a strong fundamental floor for silver prices, making it less susceptible to purely speculative swings.
Geopolitical tensions and economic uncertainties also contribute to silver's appeal as a safe-haven asset. In times of global instability, investors tend to flock to tangible assets like precious metals to preserve wealth. While gold typically garners more attention in such scenarios, silver also benefits from this flight to safety. The ongoing geopolitical developments and concerns about inflation continue to reinforce the attractiveness of both gold and silver as hedges against economic volatility and currency depreciation.
From a technical analysis perspective, silver's rally appears robust. The iShares Silver Trust (SLV) has broken above significant resistance levels, such as $31.75, which had previously acted as a ceiling. The ETF is trading well above its 50-day and 100-day Exponential Moving Averages (EMA), indicating a strong bullish trend. While the Relative Strength Index (RSI) has moved closer to overbought levels, the overall trend remains bullish, and the MACD indicator continues to signal upward momentum. Analysts suggest that if these technical indicators hold, silver could target the $40 mark in the near future. The breadth of participation from both institutional and retail investors, coupled with increasing trading volumes, suggests that this rally has stronger foundations than typical short-term spikes.
Furthermore, expectations of potential interest rate cuts by the US Federal Reserve are also providing tailwinds for precious metals. Lower interest rates reduce the opportunity cost of holding non-yielding assets like silver and gold, making them more attractive to investors. The anticipation of such policy shifts often prompts investors to front-run these decisions, leading to increased demand for precious metals.
GLD ETF Weekly Forecast: Gold's Rebound Potential
While silver commands attention with its recent surge, gold, represented by the GLD remains the cornerstone of the precious metals market. Gold recently hit record highs, touching nearly $3,500 per ounce, before experiencing a slight retreat due to profit-taking and some strengthening of the US Dollar. However, analysts are now forecasting a potential rebound, with a target of $3430 on the cards for the current week, indicating that the bullish sentiment for gold remains largely intact.
GLD is influenced by a diverse array of factors, making its price movements complex yet predictable to those who understand its drivers. One of the primary factors is gold's status as a safe-haven asset. During periods of economic uncertainty, political instability, or market volatility, investors traditionally turn to gold to preserve capital. Recent geopolitical tensions, such as the ongoing conflict in Eastern Europe, have consistently driven inflows into gold, as it acts as a hedge against global crises.
The strength or weakness of the US Dollar plays a crucial role in gold's price. Gold is primarily priced in US Dollars, meaning that a weaker dollar makes gold comparatively cheaper for buyers holding other currencies, thereby increasing demand and pushing prices up. Conversely, a stronger dollar can make gold more expensive, potentially dampening demand. While there has been some recent dollar strength, the overall sentiment regarding the dollar's long-term trajectory and its inverse relationship with gold remains a key determinant.
Interest rates and monetary policy, particularly from the US Federal Reserve, significantly impact gold prices. As a non-yielding asset, gold becomes less attractive when interest rates are high, as investors can earn better returns from interest-bearing assets. Conversely, lower interest rates reduce the opportunity cost of holding gold, making it more appealing. The anticipation of future rate cuts by central banks often provides a strong impetus for gold rallies.
Inflation and deflationary pressures also influence gold's appeal. Gold is widely regarded as a hedge against inflation. When the purchasing power of fiat currencies erodes due to rising inflation, investors often turn to gold to protect their wealth. Conversely, in deflationary environments, gold's appeal as a store of value can also increase. Recent inflation data, such as the Consumer Price Index (CPI) and Producer Price Index (PPI), are closely watched for their potential impact on gold's trajectory.
Central bank reserves and their purchasing trends are another significant, albeit often overlooked, factor. Central banks globally hold gold as a reserve asset to diversify their portfolios and safeguard against financial turmoil. Increased gold purchases by central banks signal a broader institutional confidence in gold and can significantly impact its demand and price.
Supply and demand dynamics in the physical gold market, including mining production, recycling, and demand from jewelry and industrial sectors, also play a role. While new supply from mining is relatively small compared to the total existing stock, changes in production levels can still influence prices. Investment demand through ETFs and other financial products further contributes to the overall demand picture.
From a technical standpoint, gold's recent retreat from its $3,500 peak has led to some profit-taking. However, key support levels are being tested, and analysts are looking for a rebound. The immediate resistance levels are around $3340-$3345, with a more significant hurdle at $3400. A decisive break above these levels, particularly $3400, could pave the way for a retest of the $3430 mark and potentially higher, towards $3500 and even $3600. The current bias for gold remains bullish, with buying opportunities identified at key pivot levels. The market is closely watching economic reports, such as the upcoming CPI data, as well as geopolitical developments, which could act as catalysts for gold's next major move.
The Interplay Between Gold and Silver
The intertwined fortunes of gold and silver are a recurring theme in the precious metals market. While both are considered safe-haven assets, their individual characteristics lead to nuanced differences in their price drivers. Gold is predominantly viewed as a monetary asset and a store of value, making it highly sensitive to macroeconomic indicators, interest rates, and geopolitical stability. Silver, while sharing these attributes, also benefits significantly from its extensive industrial applications. This dual nature often makes silver more volatile than gold, as it reacts to both investment demand and industrial cycles.
The recent outperformance of silver, as evidenced by the massive SLV ETF inflows, suggests a market correction where silver is catching up to gold's earlier gains. The narrowing gold-silver ratio indicates that investors believe silver was undervalued and is now reasserting its true worth. This dynamic creates a powerful feedback loop: as gold rallies, it draws attention to the precious metals sector, prompting investors to look for relative value, which often leads them to silver. As silver then accelerates, it further validates the strength of the broader precious metals market.
The current environment, characterized by persistent inflation concerns, ongoing geopolitical tensions, and the global push towards green energy technologies, provides a fertile ground for both gold and silver. Gold offers a traditional hedge against uncertainty, while silver provides exposure to both safe-haven demand and the booming industrial sector. The significant institutional inflows into SLV underscore a growing recognition of silver's unique position at the intersection of finance and industry.
In conclusion, the precious metals market is currently in a robust uptrend, driven by a powerful combination of investment demand, safe-haven appeal, and fundamental industrial growth. The unprecedented inflows into the SLV ETF signal a strong bullish outlook for silver, fueled by its undervaluation relative to gold and its critical role in emerging green technologies. Concurrently, gold, despite recent fluctuations, maintains a strong bullish bias, with analysts forecasting a rebound to key price levels, supported by its enduring safe-haven status and macroeconomic tailwinds. For investors, understanding these intertwined dynamics and monitoring key economic and geopolitical developments will be paramount in capitalizing on the ongoing rally in both gold and silver. The message is clear: the precious metals are shining bright, and their current momentum suggests further upside potential.