GBP/USD Fails at 1.3200 for Second DayGBP/USD is trading lower on Friday after the U.K. government abandoned its planned income tax increases, a move that immediately raised concerns about how the Treasury will plug the emerging budget gap. Scrapping the tax increases leaves an estimated £20-30 billion shortfall that will need to be addressed in the Autumn Statement. Markets are already pricing wider risk premia around U.K. assets, with U.K. gilt yields rising across the curve to Sterling’s detriment.
In the above chart, GBP/USD rates have once again failed to break above 1.3200, where both the May and July monthly lows were carved out. The pair is likewise struggling to sustain price action above its 20-day exponential moving average (EMA). Concurrently, each of the 20-, 50-, and 100-day EMAs have a negative rate of change, signifying sustained bearish momentum. Daily MACD remains below its signal line, while Slow Stochastics are dropping through their median line. Bears are in control as long as GBP/USD fails to sustain a daily close north of 1.3200.
Moving Averages

SYRUPUSDT 4H – On-Trend Long in Institutional Credit RWA 1. Setup
BINANCE:SYRUPUSDT is the token of Maple Finance – an institutional on-chain credit / RWA platform with syrupUSDC/USDT products and a clear fee → buyback model.
Spot trades around 0.44–0.45 with 24h volume in the $45–58M range and a market cap near $510M. Drawdown from the June ATH at 0.6532 is only ~31%, so this is not a “dead rebound” but a mid-trend pullback.
My 4H On Trend Long strategy has triggered a fresh long after a higher low around the 4H EMA band, with all intraday timeframes (15m–3D) in “Above trend” state while only 1W remains below.
2. Technical context (4H)
Price has been oscillating around the 4H EMA ribbon, respecting it as dynamic support. The last dip into ~0.43–0.44 was bought up, leaving a higher low at the blue support block. From here I’m following the system and joining the existing uptrend instead of trying to catch an extreme deviation.
Trade levels on the current setup:
Entry zone ≈ 0.449
Invalidaton ≈ 0.428 (break below local demand / 4H EMA stack)
Main target ≈ 0.533–0.537 (prior local high and resistance cluster)
That’s roughly +18.6% upside vs −4.8% downside, R:R ≈ 3.9.
3. Strategy statistics – 4H On Trend Long (SYRUP)
Backtest sample: 65 trades, long only.
Winrate ~41.5% – many small scratches and failed trends.
Average PnL per trade +1.70%.
Average winner +5.6%, average loser −2.1% → win/loss size ratio ≈ 2.45.
Largest winner +22.1%, largest loser −7.3%.
Trades are relatively short-lived: ~5 bars in total on average, ~8 bars in winners.
So the edge is classic trend-following: lower hit-rate, but winners tend to pay for several losers. This current setup fits the profile – risk is kept close to the historical average loss, while the target lies in the upper zone of past winners.
4. Fundamentals & flows
TVL and AUM keep expanding: Maple has >$5B AUM in Q3, +66% QoQ, with institutional inflows above $500M recently.
Revenue momentum is strong: about $4M in Q3 (+41.5% QoQ), with an October revenue ATH around $2.16M.
The protocol directs 25% of protocol revenue into SYRUP buybacks, creating a direct link between credit growth and token demand.
Recent news highlighted integrations with Aave and other DeFi venues, plus a Q4 ecosystem call focused on 2026 plans – all keeping the RWA/credit narrative warm.
On derivatives, OI sits near $25M, with futures volume roughly 1.5–3x spot. This leverage mix can amplify moves in both directions, so invalidation needs to be respected.
Scorecard from my dashboard:
Sentiment +9, Momentum neutral, Liquidity high, Risk medium, Confidence ~80%.
5. Trade plan & invalidation
The idea is simple: follow the existing 4H uptrend with a system long, using the EMA ribbon as a dynamic line in the sand.
If price closes 4H below 0.428 and fails to quickly reclaim the EMA band, I treat the trend leg as broken and exit. If the move plays out, I’ll look to realise most profits around 0.53–0.54, where earlier sellers were active, and only keep a small runner in case the fundamental momentum drives a new ATH push.
Not financial advice – just a structured on-trend long setup in one of the stronger RWA / credit names.

PLUMEUSDT 4H – EMA Deviation Long on RWA + USDC CatalystSetup
BYBIT:PLUMEUSDT just printed a fresh 4H EMA Deviation long signal after a sharp flush below the EMA stack. Price is trading around 0.038–0.039, with all key timeframes (15m, 1H, 4H, 1D, 3D) in “Below / Oversold” state on my EMA Dev dashboard. Current 4H deviation is ~28%, above the historical oversold average (~26%), which fits my rules for a mean-reversion long.
I am looking for a bounce back into the 4H EMA band and the nearest supply zone, where the previous distribution leg started.
Technical context
The downtrend from 0.055–0.056 pushed price under the 4H and 1D EMAs and into the lower ATR corridor. The last impulsive candle washed out local longs and expanded deviation to one of the highest readings in the current sample.
Key levels on the chart:
• Entry zone: 0.038–0.039 (current 4H demand / max negative deviation)
• First target: 0.0485–0.0490 (4H EMA cluster + local supply)
• Optional second target: 0.055–0.056 (prior breakdown area / 1D EMA region)
• Invalidation: sustained 4H close below the spike low around 0.034–0.035
As usual with this strategy, I’m not trying to catch the exact bottom – the edge comes from entering when deviation is stretched and closing into the EMA / resistance band.
Strategy stats (PLUME, 4H EMA Dev long)
Backtest sample: 20 trades, long only.
Winrate: 75%.
Avg PnL per trade: +3.75%, avg winner +8.15%, avg loser −9.45% (win/loss ratio ~0.81).
Largest winner +17.4%, largest loser −15.4%.
Losing trades tend to last longer (≈62 bars) than winners (≈25 bars), so if price sits under EMAs too long without mean reversion, I prefer to cut rather than “marinate” in drawdown.
Given the current ~28% negative deviation, the upside to the 4H EMA/supply (~+25–28%) is larger than the historical average winner, while downside to invalidation is kept near the typical loss profile.
Fundamentals & narrative
Plume is positioning as an RWA chain with a focus on compliant tokenized assets:
CCTP V2 and native USDC are now live on Plume, enabling smoother cross-chain liquidity flows.
Nest Protocol is relaunching on Plume using Pendle-style mechanics with TVL in the hundreds of millions, supporting the yield/RWA narrative.
There is active collaboration with Circle (CCTP + USDC workshop) and a growing stack of institutional RWA products (WisdomTree funds, Galaxy allocation, prior SEC transfer-agent registration, etc.), although some of those catalysts are already “spent” in the short term.
Main overhang: an upcoming unlock of ~239.65M PLUME (~2.4% of supply) on 21 December, which can cap the upside if spot demand doesn’t keep up. My fundamental score here is around BBB+ – constructive RWA + USDC story, but with clear unlock risk.
Trade plan
Base case: fade the current oversold deviation on 4H, ride the move back into 0.048–0.049, and optionally trail a small remainder toward 0.055–0.056 if momentum and flows improve.
If price fails to bounce and closes 4H below 0.034–0.035, I consider the EMA Dev setup invalid for now and step aside until a new deviation cluster forms.
Not financial advice – this is a systematic mean-reversion long based on my EMA Deviation framework plus the current RWA / USDC catalysts on Plume.

Dogecoin (DOGE/USD) Technical Analysis – Monthly ChartStructure:
Long-term ascending channel since 2021.
Currently trading near the 50-month SMA (~$0.14) — a key support level that has held multiple times.
Bullish Scenario
If DOGE holds above $0.14–$0.16 and confirms a monthly close above $0.18,
momentum could push it higher within the channel.
Targets:
• Target 1: $0.30
• Target 2: $0.38
• Target 3 (major resistance): $0.50
Stop Loss: Below $0.13 (monthly close)
Bearish Scenario
If DOGE breaks and closes below $0.14, the long-term uptrend channel weakens.
A deeper correction could follow.
Downside Targets:
• Target 1: $0.10 (channel bottom)
• Target 2: $0.06 (major psychological support)
Stop Loss for shorts: Above $0.19 (monthly close)

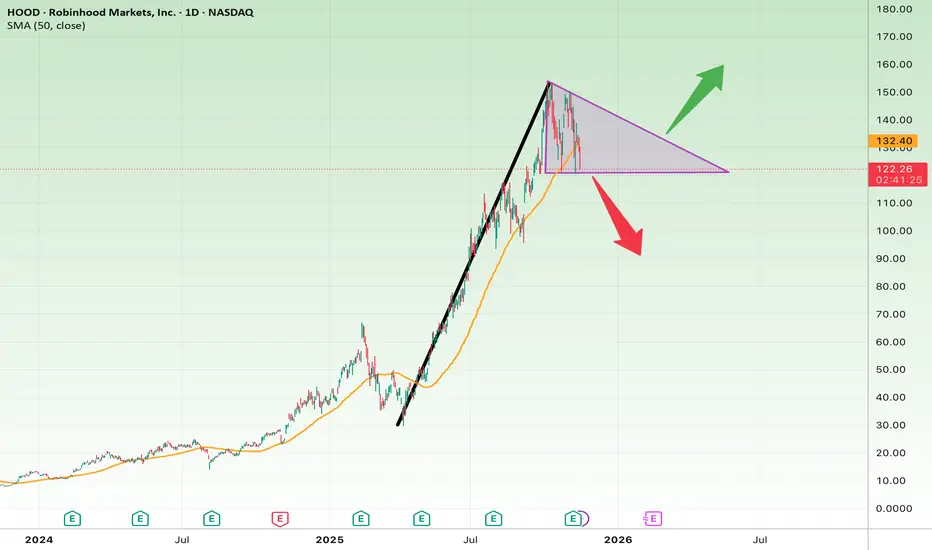
Robinhood at a Major TriangleHOOD formed a symmetrical triangle after a massive rally from ~$20 to ~$150. This consolidation now acts as a make-or-break zone.
Bullish Case:
• Break above $140 → continuation toward $160–$170
• Supported by the 50-day SMA at $111
Bearish Case:
• Drop below $120 → correction to $100–$85
Conclusion:
Robinhood is in a decisive consolidation. The breakout direction will define its next big move.
SoFi Testing Major Cup Breakout — Bull Run or Fakeout?SOFI has formed a large cup pattern over the past few years, now testing the key breakout zone around $28–$30. The 50-day SMA at $28 adds dynamic support.
Bullish Case:
• Breakout above $30 → targets $45–$50.
• Strong volume = confirmation of long-term uptrend continuation.
Bearish Case:
• Failure to hold $28 → pullback to $25, possibly $20 if weakness continues.
Conclusion:
SOFI is at a critical breakout level. Sustaining above $30 would confirm a multi-year reversal pattern with major upside potential.

EUR/USD Aiming for 1.1700, AgainEUR/USD has rallied near 1.1630 on Thursday, supported by firm messaging from European Central Bank officials and a moderate rebound in risk sentiment following the resolution of the U.S. government shutdown earlier this week. The pair briefly tested 1.1643, its highest level in two weeks, before easing slightly in midday trade.
Comments from ECB Executive Board member Isabel Schnabel helped underpin the Euro after she said inflation risks in the Eurozone remain “tilted a little to the upside,” suggesting policymakers are in no rush to discuss rate cuts. That hawkish tone reinforced expectations that the ECB will stay on hold through the end of the year. In the U.S., uncertainty persists following the short federal shutdown that delayed the release of key inflation and employment data.
In the above chart, EUR/USD rates have broken the downtrend from the September and October swing highs, suggesting the recent period of weakness may be ending. The pair is on pace for its first close above its 50-day exponential moving average (EMA) since October 16. From a technician’s perspective, a breach of recent swing highs near 1.1669 would confirm that the series of lower highs and lower lows has ended. Until then, resistance could appear at first blush in the area around the late-September swing lows/late-October swing highs.

EURUSD BUY OPPORTUNITY SWING TRADERS 30min There is a clear trend break and retest on 30min timeframe. Waiting for price to retest the support level and hit off 10 20 EMA. Targeting 1.17100. 4hr timeframe EMA's are also on uptrend. Potentially big rr trade....

TESLA Long SqueezeTesla has been trading within a sideways range but has recently broken down below it. Following some intriguing options data suggesting a potential positive gamma move above $450, many market participants may have become overly optimistic and begun anticipating new all-time highs.
However, at its current price level, Tesla appears to be in a danger zone. The recent rally lacks well-developed price action, indicating weak support until around $370. In that region, I have identified several VWAPs marking volume-weighted support areas, as well as the value area low from the volume profile of the previous trading range.
These zones align well with a potential support/resistance flip of the initial Wave 1 structure, and I’ll be watching for a possible Wave 4 low to form in this area.
According to Elliott Wave Theory, if Wave 4 falls below the highs of Wave 1, the structure is no longer considered impulsive and instead becomes corrective. This would increase the probability of Tesla’s price retracing toward previous lows—potentially dipping below $300 once again.
I plan to set alerts and monitor this zone closely for a possible long setup.

Aecon Group Inc. (TSX: ARE) — Swing Trade💰 Aecon Group Inc. (TSX: ARE) — Swing Trade Breakdown
Chart Date: Nov 13, 2025
RSI(2): 3.11 (deep oversold signal)
🏢 Company Snapshot
Aecon Group is one of Canada’s leading infrastructure and construction companies — active in transportation, utilities, and industrial projects. The stock has been trending higher since mid-2024, supported by strong backlog growth and resilient margins in public and energy projects.
📈 Fundamentals
Valuation remains moderate with a P/E around 9×, a healthy 3.4% dividend yield, and a manageable debt-to-equity ratio near 0.6. Free cash flow and liquidity are solid, positioning Aecon to capitalize on new government-funded infrastructure spending. Fundamentally sound and cash-generative — ideal for steady accumulation during pullbacks.
🔍 Technical Setup
ARE recently pulled back from its October peak near CAD $35 to test the 50-day moving average around $27–28, printing a strong RSI(2) oversold reading at 3.11 — historically a high-probability bounce zone on this ticker.
Price remains above the 200-SMA (~$21), confirming a sustained uptrend. Volume has stabilized after the post-earnings surge, showing orderly profit-taking rather than panic.
The pattern resembles a textbook pullback within an ongoing uptrend, where previous “BUY” signals at the 50-SMA have consistently led to multi-week rallies.
🎯 Trade Plan
Entry Zone: $27.00 – $27.50, near 50-SMA and RSI(2) signal confirmation.
Stop Loss: $25.80, below the 50-SMA and recent swing low.
Target: $31.50 – $33.00, near prior resistance and measured-move projection.
Risk/Reward: ~2.5× potential return to risk.
Aggressive traders may scale in at current levels; conservative traders can wait for a bullish reversal candle or reclaim of $28.00 with uptick in volume.
🧠 Swing Trader’s View
Aecon is in a bullish intermediate trend with short-term oversold momentum. RSI(2) at 3.11 is one of the lowest readings of 2025 — typically preceding a relief rally. As long as price holds above $26.00, the 50-SMA should act as dynamic support.
This setup aligns with prior buy triggers seen earlier in the trend (August and September), both leading to strong continuation swings.
💡 Outlook (Next 1–3 Weeks)
Expecting a technical rebound toward $31+ if the 50-SMA holds.
Favouring a buy-the-dip swing targeting mid-November strength — confirmation comes with an RSI(2) cross back above 10 and volume expansion off the 50-day line.

LYFT 1W from losses to profit investors believe,but for how longLYFT broke out of its long accumulation range between $8 and $20 and is now consolidating above the breakout level. The “breakout + retest” structure remains intact, with $20–21 acting as key support. A golden cross on the weekly chart confirms a shift toward bullish momentum. As long as price holds above $20, targets stay at $33.33 and $48.48.
Fundamentally , Lyft is in its strongest position in years. In Q3 2025, the company reported its first net profit of about $46 million after years of losses. Revenue grew 11% YoY to $1.68 billion, gross bookings rose 16%, and adjusted EBITDA reached roughly $139 million (+29% YoY). Active riders climbed past 28 million, average revenue per user increased, and corporate and premium rides strengthened overall performance. Cash flow improved, debt levels declined, and operating margins continued to expand.
The main challenge lies in competition and pricing pressure from Uber, as well as in sustaining profitability beyond a single quarter. While optimism is reflected in the stock price, consistent financial performance is now critical for further upside.
Technically, holding above $20 keeps the bullish setup valid. Any pullback toward $21–20 may offer a buy-the-dip opportunity with targets at $33 and $48.
Lyft finally turned profitable - now the real test is proving that growth isn’t just a quarterly anomaly.

Insight Enterprises | NSIT | Long at $92.10Insight Enterprises NASDAQ:NSIT
Technical Analysis
Price entered my "crash" simple moving average zone. Often, but not always, this is an area of algorithmic share accumulation and price reversal. A red flag, however, is that there are still open price gaps on the daily chart down to $50. A green flag is that there are open price gaps up to $215. While the price gaps below will likely get filled in the future, I am betting on a short-term reversal (if not longer-term one) given the prospective growth and its current P/E of 20x (electronic industry currently near 30x).
Insight AI
Stock enters the "crash" zone, and suddenly there is an generative AI announcement to drive revenue and EPS growth: www.businesswire.com . Intentional drive down of stock price for entry? Time will tell.
Revenue and Earnings-per-Share Growth into 2028
Revenue: $8.32 billion in 2025 to $9.88 billion in 2028 (+10.8%)
EPS: $9.64 in 2025 to $12.38 in 2028 (+28.4%)
Health
Debt-to-Equity: 0.9x (pretty good)
Quick Ratio / ability to pay current bills: 1.3 (1.5-3.0 is ideal, but still pretty good)
Alman's Z Score / risk of bankruptcy: 1.8 (3+ is ideal, so moderate risk)
EBIDTA: 5% to 7% range, which is generally considered healthy
Action
Given the "value", AI integration, technical analysis assessment, and growth, NASDAQ:NSIT is in a personal buy zone at $92.10. Caution if the stock dead-cat bounces and aims to drop further into the $50s, but I suspect fundamentals will have to dramatically change in the near-term for that to happen (or the economy crashes)...
Conservative Targets into 2028
$105.00 (+14.0%)
$117.00 (+27.0%)

GBPCHFGBPCHF at a major SUPPORT zone. Getting some confirmation for reversal. Also looking for a Break of pattern.

Earnings,MACD,And Candlesticks-Top 3 Catalysts That Give SignalsSo in this chart NYSE:DIS we are using
👉MACD
👉Earnings Report
👉Multi-time frame
👉Candlestick Analysis
What you need know:
-
Earnings are a catalyst to price gaps also MACD shows you buying momentum.
-
Also understand candlesticks give early signals.
-
The problem is the the light green MACD histogram on the 1H chart.
-
Also another challenge will be the broker executing the buy limit order.
-
If the broker doesn't execute your limit order don't try to. Hsse the position just let it go.
Because a buying opportunity is just around the corner.
If the price goes in the opposite direction, make you reserve 50% of your capital when you enter your
Trade .For example is you have $100 only trade $50.
This is part of risk management later when you gain experience you can increase your position size.
Am using Candlesticks, MACD, and MACD histogram.
This is my trading system.
Questions 🤔
👉What are multi time frame trading strategies?
👉What makes earnings report catalysts?
👉What is the MACD Histogram?
Leave your answers below..
Disclaimer ⚠️ Trading is risky please learn about risk management and profit taking strategies.
Also feel free to use a simulation trading account before you use real money.

Gold - Pattern that Pays
Gold - Pattern that Pays
The chart really speaks for itself.
◻️ The 100 DSMA (blue line) has been a great level for buying / bouncing of price.
◻️ Price falls during corrections to the 100 DSMA.
◻️ Pennants show price compression until price revisits 100 DSMA & then price continue upwards.
◻️ Its important to understand that at some stage in the future, the pennant will fail, price will fall out of the bottom of the pennant, which is where your stop should be placed. This is a real possibility after such a big gold run.
◻️ Breakouts from the upper part of the pennant (orange circles) are another great place to double down on a position, and appears to be a good confirmation of continued upside.
Keep the "cost of mistakes low" with your SL.
My stop loss will be 10% under the 10 DSMA line. I do not automate this because stop loss hunting by exchanges is rife this past several years. So I will manually bow out at approx. 10% price drop from entry, unless I believe it is a stop/liquidation sweep. Given my positions are a small 2 - 3% of my portfolio I am fine having high conviction and willing to lose 10% on these high conviction plays.
Furthermore, it is highly likely gold is on a multi year secular bull market, however, it is probable that we are entering a period where Gold stalls for a few years, so... this is an opportunity to stack and hold Gold for that 2 - 3 year timeframe.
The above chart is to trade on weekly and monthly timeframe, however there is an argument to build a long term stack, in the event a 2 - 3 year correction / sideways move materializes. Gold could be a good place to stack profits from other trades over a 12 - 36 month timeframe, for those of you that are seeking to park profits into some long term safety that gains....for those of you patient enough to execute that
Stay Patient and keep you mistakes cheap
P

ASTS at a Crucial Support — Rebound or Breakdown?After a strong rally from $30 to $110, ASTS has corrected down to retest its long-term ascending trendline, which currently aligns with the 50-day SMA (~$63). The price is hovering right at this confluence — marked by the black circle — suggesting a decision zone.
Bullish Scenario:
• Holding above $66–$67 keeps the bullish trend intact.
• Upside targets: $78, then $90–95.
Bearish Scenario:
• A daily close below $63 could signal a deeper correction toward $55 or $45.
Conclusion:
ASTS is at a make-or-break support zone. A rebound here could resume the uptrend, but losing $63 would shift momentum to the downside.

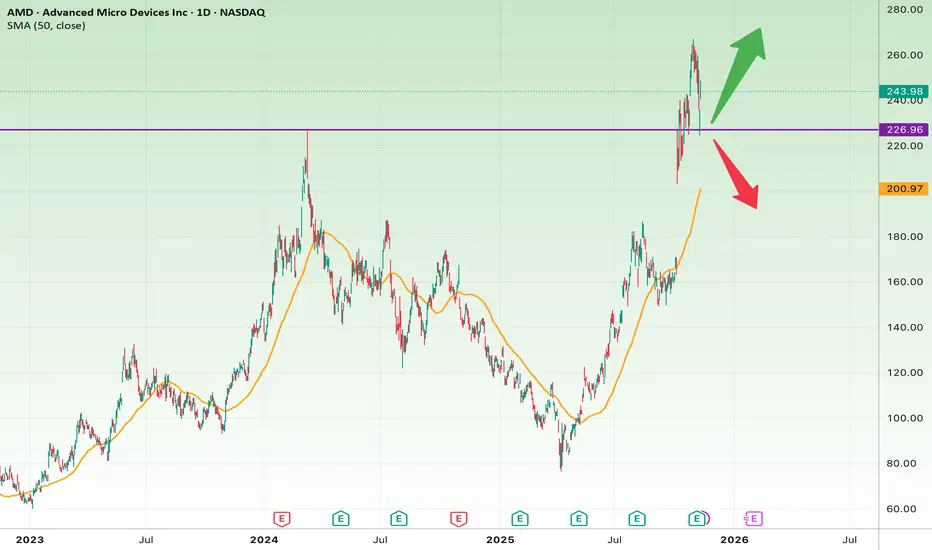
Retesting the Breakout — AMD at a Critical Decision PointAMD surged strongly from around $140 to nearly $275, and it’s now pulling back toward a key support zone around $230–$235, which was the previous breakout level. The 50-day SMA (around $199) is trending upward, providing dynamic support below.
Short-Term View (1–3 weeks):
• Holding above $230 would keep the bullish structure intact.
• Short-term target: $255–$265
• Stop-loss: below $225
Long-Term View (2–6 months):
• A confirmed rebound and breakout above $275 could extend the uptrend toward $300 or higher.
• A breakdown below $230, however, may trigger a correction toward $200–$185.
Summary:
AMD is at a decisive support level. If buyers defend the $230 zone, a new rally could form; otherwise, a deeper pullback is likely before the next leg up.
VSAT 1W – signal restoredOn the weekly chart, ViaSat (VSAT) finally broke out of a long-term falling wedge — a textbook bullish reversal pattern. After the breakout, price pulled back perfectly into the buy zone, confirming a clean retest on the weekly.
All moving averages (MA/EMA) now sit below the price - a clear sign that buyers are in control.
Technically, the setup looks strong:
✅ wedge breakout confirmed with volume;
✅ weekly retest completed;
✅ bullish momentum building up.
First target stands at 47.11, with higher resistances at 68.63 and 97.34 if the bullish structure holds.
Fundamentally, the company is stabilizing after a tough period - cost control, steady contracts, and renewed investor interest could all support the recovery.
After all, the ticker VSAT stands for communication - and right now, the market’s message seems pretty clear: “connection restored.”

SAI LIFESCIENCESSai Life Sciences Ltd. – Overview Sai Life Sciences Ltd., headquartered in Hyderabad, is a full-service Contract Research, Development, and Manufacturing Organization (CRDMO) serving global pharmaceutical and biotech innovators. With operations across India, the US, UK, and Germany, Sai offers integrated services from early discovery to commercial manufacturing. Its capabilities span: • Discovery Chemistry & Biology – early-stage drug discovery and lead optimization • Development Services – process R&D, analytical development, and regulatory support • Commercial Manufacturing – APIs and intermediates at scale, including HPAPIs
FY22–FY25 Snapshot (Consolidated Estimates) • Sales – ₹1,050 Cr → ₹1,250 Cr → ₹1,450 Cr → ₹1,650 Cr Growth driven by global outsourcing, oncology APIs, and biotech partnerships
• Net Profit – ₹90 Cr → ₹115 Cr → ₹140 Cr → ₹165 Cr Earnings supported by scale, high-margin CDMO contracts, and backward integration
• Operating Performance – Strong → Strong → Very Strong → Very Strong EBITDA margins improving with HPAPI scale-up and digital process control
• Dividend Yield (%) – Nil → Nil → Nil → Nil No payouts; reinvestment into capacity, compliance, and global expansion
• Equity Capital – Privately held No public float; backed by private equity and founder-led governance
• Total Debt – ₹420 Cr → ₹390 Cr → ₹360 Cr → ₹330 Cr Gradual deleveraging supported by export cash flows and high-value contracts
• Fixed Assets – ₹1,100 Cr → ₹1,200 Cr → ₹1,300 Cr → ₹1,400 Cr Capex focused on HPAPI block, digital labs, and European compliance
Institutional Interest & Ownership Trends Sai Life Sciences is privately held, with significant backing from private equity investors and the founding promoter group. While not listed, it has attracted strategic interest from global pharma clients and long-term investors in the CDMO space. Its governance structure emphasizes compliance, ESG alignment, and global regulatory readiness. The company is often cited in pre-IPO watchlists and strategic acquisition discussions within the life sciences ecosystem.
Business Growth Verdict Sai Life is scaling across discovery, development, and commercial manufacturing with global client stickiness Margins improving via high-value CDMO contracts, backward integration, and digital process control Debt is declining steadily with strong export cash flows and capacity utilization Capex supports long-term competitiveness in HPAPI, oncology, and EU/US regulatory compliance
Management Highlights • FY25: 25+ active programs in late-stage development; 3 commercial APIs launched • Sustainability: 100% green power at Bidar site; zero liquid discharge (ZLD) compliance • Digital: AI-enabled process optimization and predictive analytics in development labs • FY26 Outlook: 12–15% revenue growth, margin retention, and expanded US/EU client base
Final Investment Verdict Sai Life Sciences Ltd. offers a high-growth CRDMO story built on innovation, regulatory strength, and global partnerships. While not publicly listed, it remains a strategic asset in India’s life sciences ecosystem. With strong execution, high-margin capabilities, and global scale, Sai Life is a potential candidate for future listing or strategic acquisition in the pharma services space.

USD/CAD Reversal from Channel Resistance ContinuesUSD/CAD rates are continuing their reversal lower within their multi-month uptrend following last week’s Canadian jobs figures. Stronger than expected jobs growth in Canada has helped tamp down Bank of Canada (BoC) rate cut odds through the end of the year, while the prospect of Trump’s tariffs being struck down by the Supreme Court have likewise emboldened the Loonie. In the options market, Canadian Dollar futures are currently in the 48th percentile for volatility over the past year, highest among major USD-pairs.
In the above chart, USD/CAD rates have backed away from rising channel resistance, marked by the February 2025 swing low near 1.4151. The reversal in recent sessions is pushing the pair back into the area between the 20-day exponential moving average (EMA) and 50-day EMA, which proved itself as support at the end of October. A drop below the 100-day EMA would produce a break of the rising channel in motion since mid-June. At first blush, dip buyers may be in play closer to 1.3900 on a continued pullback.

Higher SOONSOONUSDT is resting on support and momentum is still bullish on multiple timeframes. BTC.D appears to be bearish which would indicate money is rotating from BTC to Altcoins.
An object in motion will stay in motion until acted on by an outside force. TP1, about $3.13, is the area where resistance could cause price to halt. If it gains acceptance above there TP2, $8.32, is where price would try to reach next.
RR: 4.6:1 @ TP1, 30:1 @ TP2

USD/JPY Consolidating Below Resistance Near 155USD/JPY is starting the week on slightly stronger footing in the wake of the news that a tentative deal had been reached in the U.S. Senate to end the longest government shutdown in history. While the U.S. Dollar has firmed versus most of its counterparts, the downdraft in U.S. Treasury yields over the morning session on Monday has allowed the Japanese Yen to recoup some losses. On the Yen side, Japanese government bond (JGB) 10-year yield reached its highest level since June 2008 as fiscal concerns mount across the Pacific.
In the above chart, USD/JPY rates have struggled to breach the February 2025 swing high near 155, having paused below said resistance since late-October. That said, momentum remains to the upside, with USD/JPY well-supported by uptrends in both the 20-day exponential moving average (EMA) and 50-day EMA. A breach of 155 would suggest continuation to the upside back to the 2025 highs would be in focus; a drop below the 20-day EMA would initially expose the late-October swing low below 152.

Disbelief Rally Time?A lot of extreme bearish exuberance, but fundamentals continue to go up on the Ethereum network: lower gas fees, record transactions, record stable coin and real-world asset volume (digital treasuries, digital gold, etc). Recipe for a disbelief rally given extreme low sentiment.
Bullish catalysts:
- Fusaka upgrade go-live
- Tariff SCOTUS reversal odds
- Government reopening
- Clarity act progress
- New record network stats
- New dovish economic reports
