When will Microsoft (MSFT) close its monthly gap?NASDAQ:MSFT
Microsoft (MSFT) saw a 7% gap up following its earnings report in May.
To fill this gap, the stock would need to drop about 28.59% from its high, or 23.33% from the current level.
Historically, gaps on the monthly chart have eventually been filled, so it’s reasonable to assume that this one might be as well in the long term.
However, given that MSFT is one of the top three companies by market capitalization, a decline of more than 20% would likely trigger a broader correction across the Nasdaq index.
Therefore, this potential gap fill should not be seen merely as an individual stock event, but rather as part of a broader market correction scenario.
Your follow and boost would mean a lot. 🚀
I am Korean and I used Google Translate.
Microsoft (MSFT)

Exness: The Convergence of Tech GiantsThe initial phase of the artificial intelligence (AI) rebound was driven by narrative and momentum; merely being associated with AI was enough to push up valuations. Now, we are entering a more mature phase where investors will demand tangible results and will penalize specific strategic missteps or unmitigated risks.
Although the AI theme remains dominant, news from specific companies is now triggering significant and differentiated reactions. For example, Apple is adjusting its entire AR/VR strategy due to product-specific difficulties, while Meta is grappling with an existential regulatory battle unrelated to its AI development. This differentiation means the market is beginning to distinguish between "AI beneficiaries" and "AI players who need to prove themselves."
Simply being among the "Magnificent Seven" is no longer enough; companies must now demonstrate their ability to navigate their unique challenges—be they competitive, regulatory, or operational.
Therefore, the next phase of the Nasdaq 100's performance will depend on how these individual giants execute their specific strategies, making company-level analysis more critical than ever.
NVIDIA's AI Empire: Solidifying the Moat or Building a House of Cards?
Nvidia recently announced a strategic cooperation intent, planning to invest up to $100 billion in OpenAI. This investment is closely linked to the deployment of at least 10 gigawatts of Nvidia systems, aimed at supporting OpenAI's next-generation AI infrastructure, with the first phase using its Vera Rubin platform by 2026. This is not just an investment; it's a self-reinforcing business cycle. Nvidia provides funding to OpenAI, and OpenAI then uses these funds to purchase Nvidia's core products (GPUs, networking systems), thereby effectively securing a large and long-term order channel, injecting strong momentum into both parties' revenue growth.
However, this arrangement has also drawn critical perspectives, arguing that it constitutes "The Infinite Money Glitch." Analysts have compared it to Cisco Systems' practices during the dot-com bubble, when Cisco provided funding to telecom companies to purchase its routers, a strategy that amplified the subsequent market collapse.
The risk is that Nvidia may be artificially inflating its own demand, which would make it very vulnerable if the AI capital expenditure boom slows down or OpenAI's business model encounters problems.
This investment can also be seen as a defensive move, aimed at preventing OpenAI from developing its own custom chips or deepening its cooperation with competitors like Broadcom, with whom OpenAI has already signed a $10 billion order.
Apple's Pragmatic Shift: From Vision to Sight
Recent reports confirm that Apple is pausing its planned overhaul of the Vision Pro headset to reallocate resources and accelerate the development of AI-powered smart glasses. The logic behind this strategic shift is that the Vision Pro, launched in February 2024, has struggled to maintain sales momentum due to its high price of $3,499, physical weight, and limited content ecosystem, leading to waning consumer interest.
This shift is a pragmatic admission by Apple that the path to the mass market lies in a different product form factor. According to the new roadmap, Apple is reportedly developing at least two models: a simpler display-less version (N50) that connects to the iPhone, and a more advanced version with an integrated display that directly competes with Meta's products. The development timeline is being accelerated, with a possible release as early as next year.
This strategic shift is less about abandoning spatial computing and more about finding a viable mass-market vehicle to counter its "AI laggard" label and establish a new, Apple-controlled AI platform.
Despite the launch of "Apple Intelligence," Apple is still widely considered to be playing catch-up in the generative AI field compared to Google and OpenAI.
Meta's Ambitious: Software to hardware while defending the core.
In this race, Meta is clearly in the lead. It has collaborated with Ray-Ban to launch multiple generations of smart glasses, and has introduced the $800 Ray-Ban Display, its first consumer model with a built-in screen. They are setting the pace, forcing Apple to react. However, at the same time, Meta's core advertising business is facing unprecedented and escalating legal attacks in the EU. This includes a €550 million lawsuit filed by over 80 Spanish media organizations, accusing it of unfair competition; similar lawsuits exist in France; and its "consent or pay" model faces fundamental challenges under GDPR and the Digital Services Act (DSA).
Meta's aggressive push in smart glasses and the metaverse is not just a pursuit of new growth, but a strategic necessity driven by the existential threat to its underlying advertising business model. Meta's primary revenue and profit engine – personalized advertising based on user data – is facing fundamental, systemic challenges in one of its largest markets (the EU). This regulatory pressure creates a powerful incentive for it to develop new platforms (such as smart glasses operating systems) where Meta can control the ecosystem, set data collection rules, and build new, diversified revenue streams (e.g., hardware sales, AR app stores).
Therefore, succeeding in this new hardware race is not only an offensive growth strategy, but also a crucial defensive move to reduce the company's reliance on a business model that is increasingly untenable from a regulatory perspective.
Microsoft's Quiet Restructuring for the Future of its AI Center
Microsoft has undergone a major internal reorganization to strengthen its focus on AI. This includes the appointment of Judson Althoff as CEO of the commercial business, a move explicitly aimed at allowing CEO Satya Nadella to focus on high-level technical work in AI, data center architecture, and product innovation. Meanwhile, the company has for the first time since 2018 unified its Windows engineering division under one leader, Pavan Davuluri. The clear goal is to accelerate the realization of Windows as an "Agentic OS" – an AI-driven operating system that can proactively perform tasks for users.
Microsoft's strategy is fundamentally different from Apple's and Meta's. Instead of chasing new consumer hardware categories, Microsoft is doubling down on its existing enterprise and operating system strongholds, deeply integrating AI into the fabric of its core products to increase user engagement and drive consumption within its ecosystem. Recent news from Microsoft is not about novel gadgets, but about organizational structure and a long-term operating system vision. The changes in commercial leadership are to optimize the sales process for AI-enhanced enterprise services (such as Azure AI and Microsoft 365 Copilot). The changes in Windows are to redefine the core PC experience in the age of AI.
This is a lower-risk, more defensive strategy. They are not trying to create a new market from scratch, but rather are using AI to fortify their existing multi-trillion-dollar enterprise and consumer software moats. The measure of Microsoft's success will not be hardware sales units, but rather Azure consumption growth, Copilot subscription numbers, and increased enterprise license value.
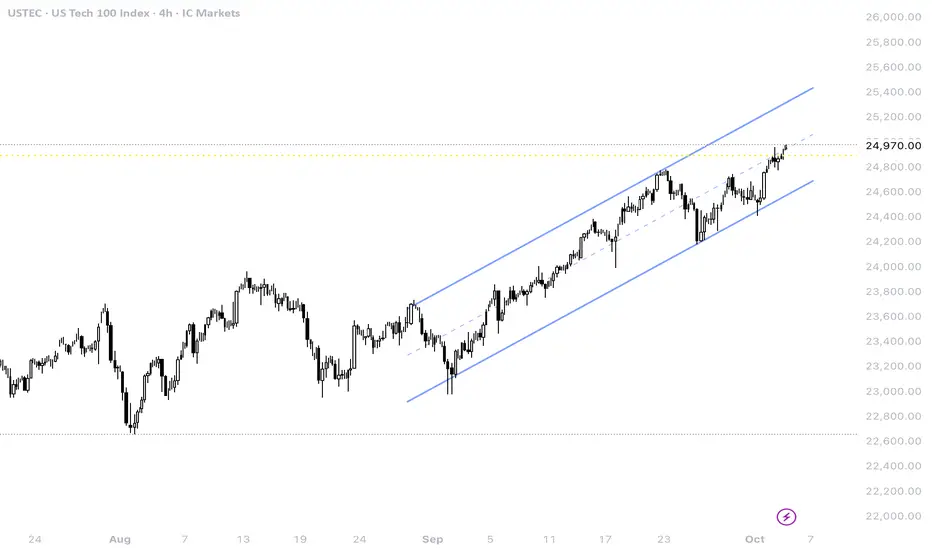
USTEC reached the 100% Fibonacci Extension at around 24955 before retracing. The index awaits a potential breakout from the range of 24800-24955.
If USTEC breaks above 24955, the index may test the 161% Fibonacci Extension at around 25265.
Conversely, returning below 24700-24800 may lead to a retest of EMA21 and the channel’s lower bound.
Combining the above analysis, the performance of the Nasdaq 100 index will be the ultimate resultant force of these competing powers. This ecosystem is interconnected: Nvidia's ability to execute its large-scale infrastructure construction is the foundation for the AI ambitions of companies like Microsoft and Meta. The success of Apple's and Meta's hardware battle will define the next major consumer computing platform and create new ecosystems. Microsoft's solid position in the enterprise sector provides a stabilizing force, while Meta's regulatory battles in Europe remain the most significant idiosyncratic risk facing a major component of the index.
This is not a prediction, but a guide to what matters most in the coming quarters:
For Nvidia: Track gross margins for its Blackwell and upcoming Vera Rubin platforms and any comments on pricing power. Watch for any official regulatory investigations initiated by the US or EU regarding its partnership with OpenAI and its ecosystem impact.
For Apple and Meta: Sales data in the first 6-12 months after the launch of any new smart glasses, and more importantly, user engagement metrics will be crucial. The quality and capability of Apple's revamped Siri (Project Linwood) upon full release will be a key leading indicator of its AI competitiveness.
For Meta (EU): Rulings in media lawsuits in Spain and France will be key (the trial in Spain is scheduled for October 2025). Any decision invalidating the "consent or pay" model would force a fundamental restructuring of its European operations and could have significant financial implications.
For the Macro Environment: Monthly non-farm payroll reports are key data points. A sustained trend below expectation would significantly increase the probability of a recession and could outweigh the positive sentiment from potential interest rate cuts, shifting market focus from valuation support to fundamental earnings risk.
By Eric Chia, Financial Market Strategist at Exness
The AI Bubble's Final Act II: The Convergence TightensRetail flushed. Institutions trapped. The Fed flying blind. Welcome to October.
The AI Bubble's Final Act II: The Convergence Tightens
Why the AI Bubble Narrative Just Got Its Lehman Moment
This post is a direct sequel to my September thesis: If you haven’t read that, start there⬇️ - this builds on the trigger map 🗺️.
The BLUEBERRY:SP500 continues hovering near cycle highs at 6,700, but structural cracks are widening beneath the surface. The AI-led rally driven by NASDAQ:NVDA $100 billion commitment to OpenAI shows classic signs of saturation: volume decay, RSI divergence, and what analysts are now calling "circular financing." Nvidia invests $100 billion in OpenAI, which then turns around and spends it back on Nvidia chips - this is the capex circularity that marks bubble peaks.
With the U.S. government shutdown now confirmed as of October 1, 2025, macro liquidity stress adds a critical new layer of fragility. This aligns perfectly with our thesis: August CME:BTC1! top + September 30 shutdown = narrative inflection zone. I remain cautious on TVC:SPX upside and alert for volatility expansion.
Cycle echoes from 2007-2008 are in play. The boom is fragile. The Fed now faces a critical blindfold - key data streams are frozen mid-cycle. Without payrolls, inflation prints, or consumer metrics during the shutdown, policy decisions risk catastrophic miscalibration at the exact moment when precision matters most.
🧭 Why This Convergence Matters
I am not claiming that IG:BITCOIN and SP:SPX are traditionally correlated - even though the chart shows an eerily close alignment over the past decade. I'm mapping trigger timing across asset classes - the simultaneous exhaustion of different market participants:
BTC top (August 2025) = Retail exhaustion. The most speculative, leveraged traders have already been flushed out. When crypto peaks first, it signals risk appetite is rolling over.
SPX stall (September 2025) = Institutional fragility. The "smart money" that rotated from crypto into AI stocks is now trapped at peak valuations with nowhere left to rotate.
Shutdown (October 1, 2025) = Macro blindfold. Just as markets need maximum visibility, the government turns off the economic data dashboard. The Fed is flying blind.
Together, they form a convergent signal - just like Lehman + SP:SPX top + credit freeze in September 2008 . These weren't correlated, they were coincidental triggers that revealed the same underlying disease: excess leverage meeting liquidity shock.
📌 The Three Inflection Markers
🔹 Nvidia's $100B Commitment to OpenAI
📆 Date: September 22, 2025
Details: NASDAQ:NVDA pledged up to $100 billion to deploy 10 gigawatts of AI infrastructure for OpenAI progressively, marking peak capex saturation in the AI infrastructure buildout.
The Circular Financing Problem: Think of it like a closed-loop economy where the same money keeps circulating without creating real external demand. NASDAQ:NVDA invests $100 billion in OpenAI, which OpenAI then gives back to NASDAQ:NVDA for chips and infrastructure. This isn't wealth creation, it's musical chairs with capital. When the music stops, the question becomes: who's actually making money selling AI services to end customers?
Echo: Mirrors NASDAQ:CSCO dot-com era infrastructure frenzy, when telecom companies borrowed billions to buy Cisco equipment, creating the illusion of sustainable demand until the debt bubble popped.
🔹 The Cisco Precedent: When Infrastructure Investment Becomes Speculation
📆 Date: March 27, 2000
Peak Valuation: ~$550 billion - briefly the most valuable company in the world
The Story: During the dot-com boom, everyone "knew" the internet would change everything. They were right. But NASDAQ:CSCO still crashed 70%+ and never regained its 2000 peak even 25 years later.
Why? Capex-driven euphoria created demand that didn't exist organically. Telecom companies and startups borrowed money to build infrastructure faster than actual usage could justify. When funding dried up, demand evaporated overnight, leaving NASDAQ:CSCO with inventory, overcapacity, and shocked investors.
2025 Parallel: Everyone "knows" AI will change everything. They're probably right. But that doesn't mean NASDAQ:NVDA at current valuations survives the transition. The infrastructure buildout is running ahead of monetizable demand - classic late-cycle behavior.
🔹 U.S. Government Shutdown - The Macro Blindfold
📆 Start Date: October 1, 2025 at 12:01 AM
Trigger: Congressional deadlock over partisan spending bill and healthcare provisions
The Economic Data Blackout: During shutdowns, critical federal data releases get delayed or suspended:
Bureau of Labor Statistics (jobs reports, unemployment, wage data)
Bureau of Economic Analysis (GDP, consumer spending, inflation components)
Census Bureau (retail sales, construction, housing data)
Federal Reserve inputs for policy decisions
Why This Is Catastrophic Timing: The Fed is trying to navigate a soft landing while cutting ECONOMICS:USINTR rates with unemployment ECONOMICS:USUR rising. That requires precise, real-time data. Instead, they're getting a multi-week (or multi-month) information blackout at the exact moment when leading indicators are rolling over. It's like turning off your GPS while driving through a construction zone at night.
Historical Parallel - 2008: Bear Stearns collapsed in March 2008, but the Fed thought they'd contained it. Lehman failed in September because policymakers were operating on lagged, incomplete data about how quickly the contagion was spreading. The shutdown creates a similar fog of war.
The Convergence Thesis: Three Dominoes, One Direction
These three events aren't causing each other - they're revealing the same underlying condition: peak leverage meeting exhaustion.
1️⃣ Stage 1 (August): Retail speculators in crypto get wiped out first. BTC tops at $109K, starts rolling over. This is the canary in the coal mine - the most risk-seeking capital runs out of buyers.
2️⃣ Stage 2 (September): Institutional money realizes the AI trade is overcrowded. Nvidia's circular financing deal with OpenAI triggers analyst warnings about an AI bubble. Smart money starts quietly rotating to cash and defensives, but the indexes stay elevated due to passive flows and concentration in mega-caps.
3️⃣ Stage 3 (October): Government dysfunction removes the Fed's ability to respond quickly or accurately. Markets lose confidence that policymakers can even see the problems, let alone fix them. Volatility expands as uncertainty compounds.
Think of it like a forest fire. INDEX:BTCUSD was the dry brush catching first. The AI stocks are the trees - bigger, but still combustible. The government shutdown is the wind that accelerates the spread. You don't need correlation between brush, trees, and wind to know the conditions are perfect for disaster.
What Happens Next: The Three Scenarios
🟠 Scenario 1: Controlled Decline (45% probability)
Shutdown resolved within 2-3 weeks
SP:SPX corrects to 6,400-6,200 range (-5 to -10%)
Fed pauses cuts, reassesses within Q4
Market stabilizes but stays defensive through year-end
This is the "best case" - pain, but manageable
🔵 Scenario 2: Accelerated Unwind (40% probability)
Shutdown extends 4+ weeks, economic data gap widens
SPX breaks 6,000, triggers algorithmic selling cascade
Target: 5,200-5,500 range (-20 to -25%)
Credit spreads widen, corporate debt refinancing concerns emerge
This is my base case - the scenario I'm positioned for
🔴 Scenario 3: Systemic Event (15% probability)
Shutdown coincides with unexpected credit event (corporate default, regional bank stress)
Multiple margin calls and forced liquidations
SPX crashes to 4,500-4,800 range (-30 to -35%)
Fed emergency intervention required (rate cuts, QE restart)
Low probability, but non-zero - the true "black swan" outcome
📊 Technical Setup: The Chart Doesn't Lie
Current Level: 6,700 (near all-time highs)
Key Support Levels:
6,200: Previous resistance turned support - first real test
5,800: 200-day moving average - psychological line in sand
5,200: Fibonacci 38.2% retracement - institutional rebalancing zone
4,500: 2024 breakout level - panic capitulation target
⚠️ Warning Signals Already Visible:
Market breadth deteriorating (fewer stocks making new highs)
Defensive sectors outperforming (utilities, healthcare, staples)
Credit spreads starting to widen (HYG/TLT ratio declining)
VIX base level rising from 12 to 16+ (fear premium expanding)
The Bottom Line: Risk/Reward Is Clear
At SP:SPX 6,700 with the Fed flying blind, AI capex circularity exposed, and retail already flushed from crypto CRYPTOCAP:TOTAL , the risk/reward for long positions is terrible. You're risking 10-15% to potentially gain what - another 3-5% before reality hits?
Smart money is raising cash, buying volatility, and preparing shopping lists for when quality names trade at distressed prices. The convergence of COINBASE:BTCUSD top, NASDAQ:NVDA circular financing peak, and government shutdown isn't causing a crisis - it's revealing that we're already in the early stages of one.
August was the warning. September was the setup. October is the trigger.
The market doesn't need to crash tomorrow, but the margin of safety has disappeared. When the next shoe drops - earnings disappointment, credit event, geopolitical shock, employment spike - there's no cushion left. Only air.
Position accordingly.
Until the next trigger - Nicholas.
Disclaimer: This post reflects my personal views and analysis. It is not financial advice. Please do your own research and manage risk accordingly.

Are We About To See A HUGE Change In The Market...Stock Market Forecast | QQQ SPY CME_MINI:NQ1! CME_MINI:ES1! SP:SPX NASDAQ:NDX
Mag 7 | TSLA NVDA AAPL AMZN META MSFT GOOGL

EUR USD AUD NVDA MSFT AVGO S&P500 BTC XRP Weekly InsightsIn this video, we dive into the key market movements and outlooks for major financial instruments over the past week. Highlights include:
Analysis of currency pairs: EUR/USD and AUD
Trends and technical setups for leading tech stocks: NVDA, MSFT, AAPL, AVGO
The S&P 500’s performance and what it suggests about broader market direction
Developments in cryptocurrency, with a focus on BTC and XRP
Whether you’re a trader, investor, or just interested in macro markets, this video gives you a consolidated, data-driven snapshot of where things stand and what to watch next.

Huge Dark Pools and Prints... Will this time be Different?Stock Market Forecast | Mag 7 TSLA NVDA AAPL AMZN
QQQ CME_MINI:NQ1! CME_MINI:ES1! SP:SPX NASDAQ:NDX stock market Forecast

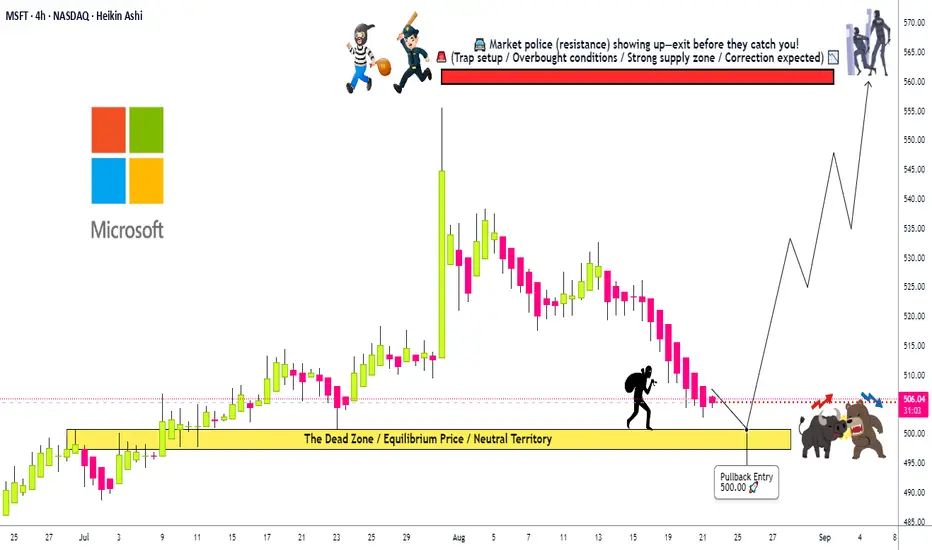
Microsoft: The Perfect Pullback Is Coming. Are You Ready?🌟 MSFT HEIST ALERT! 🌟 Steal from the Cops, Not from the Citizens! 🚔➡️🤑
Dear Ladies & Gentleman of the Thief Trading Guild, 🎩👒
Based on the 🔥Thief Trading Style Analysis🔥, here is our master plan to heist the Microsoft Corporation (MSFT) fortress. Our intel confirms a BULLISH ambush is setting up! It's time to loot! 💰💸✈️
🦹♂️ THE HEIST PLAN (SWING TRADE) 🦹♂️
Entry Point: The Perfect Pullback Loot Zone! 🎯
We're waiting for the asset to pull back to our LAYERED LIMIT ORDER TRAP! 🪤 Thief OG's use multiple entries to maximize the steal!
LAYER 1: 510.00 (First dibs!)
LAYER 2: 505.00 (Loading the bag!)
LAYER 3: 500.00 (MAIN HEIST - Perfect Pullback!)
LAYER 4: 498.00 (Bonus loot! Add more layers based on your own risk, thieves!)
Stop Loss: The Getaway Car Location! 🛑🏎️
This is Thief SL @ 485.00. This is where the trade idea is invalidated. Dear Thieves, adjust your final SL based on your own risk, strategy, and how many layers you used. Don't get caught! 👮♂️🚔
Target: The Police Barricade! 🚧🚨
Intel shows a major resistance wall (Police Barricade) at 565.00. Our mission is to escape with the stolen money BEFORE we get there! Escape Target: 560.00! Count your profits and live to trade another day! 💵🎉🤝
📢 THIEF'S BROADCAST 📢
Yo! Listen up, crew! 🗣️ If you're placing limit orders on this pullback, your stop loss should be set ONLY AFTER your order is filled! You feel me? Now, if you're smart, you'll place that stop loss where I told you 📍, but if you're a rebel, you can put it wherever you like 🤪 - just remember, you're playing with fire 🔥, and it's your risk, not mine! 👊
⚠️ TRADING ALERT : EARNINGS & NEWS ⚠️
MSFT is a big cap stock, and news/earnings can cause extreme volatility! To protect your stolen loot:
Avoid entering new layers before major news.
Consider taking some profit before earnings.
Use trailing stop-loss orders to protect running positions!
💖 Supporting our robbery plan = 💥Hitting the Boost Button💥 It fuels our getaway car and helps us find the next big heist! Let's make stealing money look easy! 🏆💪❤️🎉
I'll see you at the next heist, so stay tuned! 🤑🐱👤🤗🤩
Huge Dark Pools... Will This Time be Any Different?QQQ CME_MINI:NQ1! CME_MINI:ES1! stock market Forecast
Nvidia Stock NASDAQ:NVDA Forecast
Apple Stock AAPL Forecast
Microsoft Stock MSFT Forecast
Google Stock GOOGL Forecast
Amazon Stock AMZN Forecast
Meta Forecast Technical Analysis
Tesla Stock NASDAQ:TSLA Forecast
Magnificent 7 stocks forecast

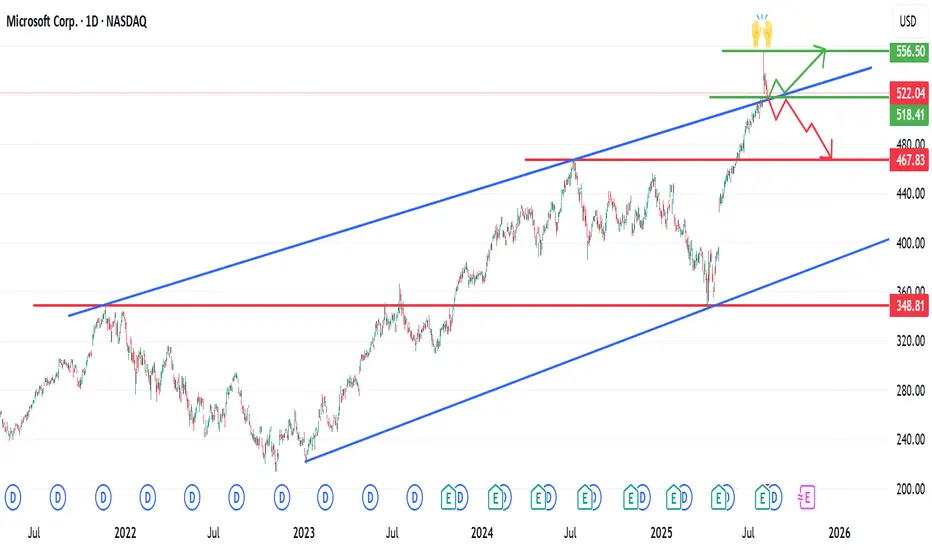
Microsoft (MSFT) Technical Update & its channelMicrosoft (MSFT) Technical Update & its channel
Microsoft began forming a long-term ascending channel as far back as November 2021, marked by three higher highs and two higher lows, as illustrated on the chart.
The price action became particularly interesting when it broke out of this channel, reaching a new all-time high (ATH) of approximately $557.
However, the underlying fundamentals (catalysts) were insufficient to sustain momentum at that level, leading to a pullback.
The stock is now consolidating around the $522 zone — a key confluence area where the ascending trendline meets a horizontal support level.
Outlook:
If price breaks below this zone and re-enters the channel, a deeper correction could follow, with potential downside targets in the $500 – $480 range.
As always, I encourage you to review the chart, share your thoughts in the comments, and connect if you’d like to discuss further.
AMD 1D Time frameMarket Snapshot
Current Price: ~$155.82
Daily Change: +2.9%
Recent Trend: Up more than 30% year-to-date, but momentum has slowed in the last few weeks.
🔎 Technical Indicators
RSI (14-day): ~54 → Neutral, neither overbought nor oversold.
MACD: Slightly negative → Mild selling pressure.
Moving Averages:
5-day MA: ~$154.6 → Supportive (bullish short-term).
50-day MA: ~$157.9 → Acting as resistance.
200-day MA: ~$168.3 → Major long-term resistance.
Summary: Short-term momentum is holding, but medium to long-term averages are pushing down on price.
📈 Support & Resistance
Immediate Support: ~$150 – $155 zone
Resistance Levels: ~$158 (50-day), then ~$168 (200-day)
📅 Outlook
Bullish Case: If AMD sustains above ~$158, upside targets near $170–175 open up.
Bearish Case: A break below ~$150 could drag it toward $140–145.
Bias: Neutral to mildly bearish in the near-term, with long-term upside still intact if it reclaims the 200-day MA.

AAPL 1D Time frameCurrent Price & Market Metrics
Current Price: $234.35 USD
Market Cap: $3.01 Trillion
P/E Ratio: 30.28
EPS: $6.59
Beta: 1.15
Volatility: 2.32%
52-Week Range: $139.34 – $200.00 USD
🔎 Technical Indicators
Relative Strength Index (RSI): 67.00 — Neutral
Moving Averages:
5-day: $237.11 — Buy
10-day: $233.72 — Buy
20-day: $231.59 — Buy
50-day: $219.01 — Buy
100-day: $210.66 — Buy
200-day: $220.99 — Buy
Moving Average Convergence Divergence (MACD): 5.61 — Sell
Stochastic Oscillator: 89.58 — Sell
Commodity Channel Index (CCI): 136.25 — Sell
Average True Range (ATR): 4.41
📈 Support & Resistance Levels
Support: $220.11
Resistance: $239.78
📅 Outlook
Bullish Scenario: A breakout above $239.78 could signal a move toward $255.59.
Bearish Scenario: A drop below $220.11 may lead to further downside.
Overall Bias: Neutral to Bullish, with mixed signals from momentum indicators and moving averages.

JIOFIN 2Hour Time frameJIOFIN 2-Hour Snapshot
Current Price: ₹311.10 INR
Change: +1.28% from the previous close
Intraday High: ₹313.35 INR
Intraday Low: ₹309.60 INR
🔎 Technical Indicators
Relative Strength Index (RSI): Neutral
Moving Averages:
5-period MA: ₹310.50 INR
10-period MA: ₹310.00 INR
20-period MA: ₹309.50 INR
50-period MA: ₹308.00 INR
📈 Market Sentiment
Pivot Points:
Resistance: ₹315.00 INR
Support: ₹305.00 INR
📅 Outlook
Bullish Scenario: A breakout above ₹315.00 INR could signal a move toward ₹320.00 INR.
Bearish Scenario: A drop below ₹305.00 INR may lead to further downside.
Overall Bias: Neutral, with mixed signals from moving averages and momentum indicators.

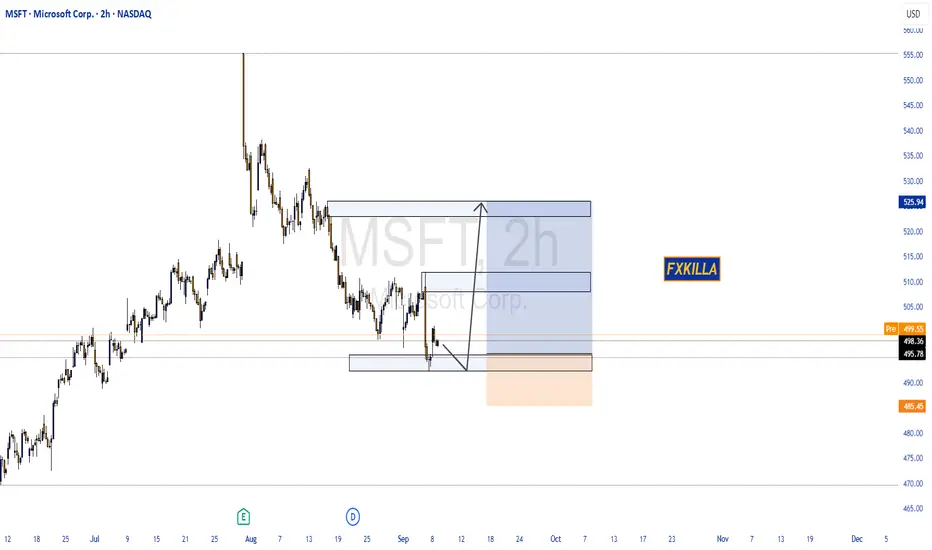
MICROSOFT CORP. HIGH PROBABILITY SETUP SOON!!🚨 MSFT HIGH PROBABILITY BUY SETUP 🚨
* Here We Can See Clearly The Next Potential Move For MSFT Coming Hours/Days.
* Keep Your Eyes Close On Your Trading Positions.
* Happy PIP Hunting Traders.
FXKILLA.
Will Bears Follow Through after Terrible Job Numbers?QQQ CME_MINI:NQ1! CME_MINI:ES1! stock market Forecast
Nvidia Stock NASDAQ:NVDA Forecast
Apple Stock AAPL Forecast
Microsoft Stock MSFT Forecast
Google Stock GOOGL Forecast
Amazon Stock AMZN Forecast
Meta Forecast Technical Analysis
Tesla Stock NASDAQ:TSLA Forecast
Magnificent 7 stocks forecast

Weekly insighta EUR/USD S&P500 NVDA METAThis video is a weekly insights report from a financial trader on TradingView. I amdiscussing my analysis and predictions for several financial instruments based on technical and fundamental indicators.
Key Points:
Market Overview: The speaker talks about the impact of recent US unemployment data on the market, which led to a "parabolic" rise in the Euro dollar.
Euro Dollar: Based on a technical analysis of an "expanding diagonal" and an old trend line, the speaker believes a false breakout is likely. They plan to avoid trading USD pairs for the next 11 days, waiting for the Fed's interest rate decision.
S&P 500: The speaker notes a five-wave Elliot wave pattern with an expanding diagonal. They are waiting for the price to break below a trend line and a red confirmation line before considering a short position. They anticipate a "choppy" market for the coming week.
Nvidia: The speaker received "hate comments" for their previous analysis of Nvidia. They stand by their short position, citing a break below the exponential moving average, a "huge" divergence on the monthly chart, and a "shooting star" candle pattern. They note that Nvidia is the heaviest stock in the S&P 500, representing 7.5% of the index.
Bitcoin: The speaker points out that Bitcoin's price has crossed and retested two moving averages, which they see as a bearish sign. They will consider a short position if the price breaks below the previous low. They also expect Bitcoin to be stagnant in the coming week while the market waits for the Fed's decision.
Call to Action : The video concludes with a plea for viewers to subscribe to the speaker's TradingView channel for more trading insights and short-trade opportunities.

Microsoft - A very profitable repetition!💰Microsoft ( NASDAQ:MSFT ) just repeats the cycle:
🔎Analysis summary:
At this exact moment, Microsoft is once again retesting the upper channel resistance trendline. Following all previous cycles, there is a 100% chance that we will see a short term retracement. Since the trend remains bullish, the all time high break and retest will follow.
📝Levels to watch:
$450, $700
SwingTraderPhil
SwingTrading.Simplified. | Investing.Simplified. | #LONGTERMVISION

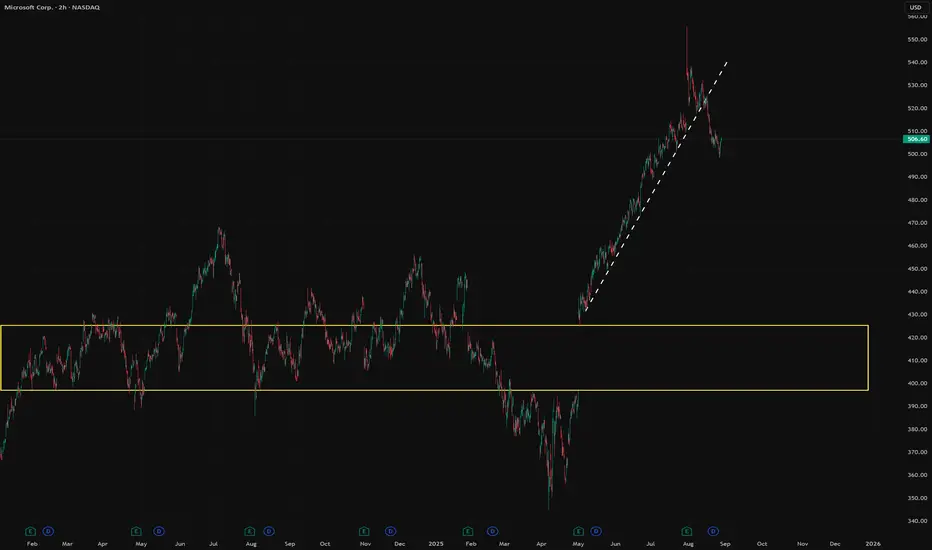
The report is good, but there is no stock dynamicsMSFT gapped up at around $555 on the report and reached a market cap of $4.1 trillion
This happened because the report significantly exceeded expectations on key metrics
The latest quarterly report showed record results.
Revenue for the quarter was $76.4 billion (up 18% y/y)
Net income was $27.2 billion (up 24% y/y).
EPS was $3.65, exceeding analysts' expectations
However, the shares are falling and are already below the level they were before the report.
Capex was increased to $24.2 billion (up 27% YoY)
For fiscal 2026, management forecasts further Capex growth (over $30 billion in Q1 alone)
Operating expenses increased 6% YoY due to investments in AI and engineering
The company recorded $1.71 billion in other expenses in the quarter, partly related to losses on equity investments (likely in OpenAI)
In the call with investors, the company's management warned market participants about further margin compression in the short term and higher-than-expected capital expenditures on AI infrastructure.
Accordingly, this raises questions about the future profitability of both the investments themselves and the future results of the company as a whole, which will be released in future reports.
Professional investors have begun to change their DCF models in accordance with the new data.
From a “tech” perspective, we are seeing weaker dynamics in the broad market.
It is clear how the company's comments have broken the up trend that has been observed in recent months.
We expect further cooling of sentiment in the stock, the closing of another gap from below and a slide in the price to the $400-420.
Is September For the Bears?QQQ CME_MINI:NQ1! CME_MINI:ES1! stock market Forecast
Nvidia Stock NASDAQ:NVDA Forecast
Apple Stock NASDAQ:AAPL Forecast
Microsoft Stock MSFT Forecast
Google Stock GOOGL Forecast
Amazon Stock AMZN Forecast
Meta Forecast Technical Analysis
Tesla Stock TSLA Forecast
Magnificent 7 stocks forecast

Is Fridays Bounce a Bull Trap?CME_MINI:NQ1! CME_MINI:ES1! stock market Forecast
Nvidia Stock NASDAQ:NVDA Forecast
Apple Stock NASDAQ:AAPL Forecast
Microsoft Stock MSFT Forecast
Google Stock GOOGL Forecast
Amazon Stock AMZN Forecast
Meta Forecast Technical Analysis
Tesla Stock TSLA Forecast
Magnificent 7 stocks forecast

Microsoft - This chart is too obvious!💡Microsoft ( NASDAQ:MSFT ) perfectly respects structure:
🔎Analysis summary:
Back in April of 2025, Microsoft created a textbook all time high bullish break and retest. After this move, Microsoft started a rally of +50%, perfectly in conformity with the rising channel pattern. The trend remains bullish for now, but a shorter term correction will follow quite soon.
📝Levels to watch:
$650
SwingTraderPhil
SwingTrading.Simplified. | Investing.Simplified. | #LONGTERMVISION

SPY | Leap of Doom?SPY just jumped...
The wrong way up!
To sustain you must conserve. To climb up a hill, you need energy, resources like food and water. The energy they give you far out-weighs their absolute mass. Therefore it makes sense for you to carry them.
And they have taken you very far...
But now you have run out of energy.
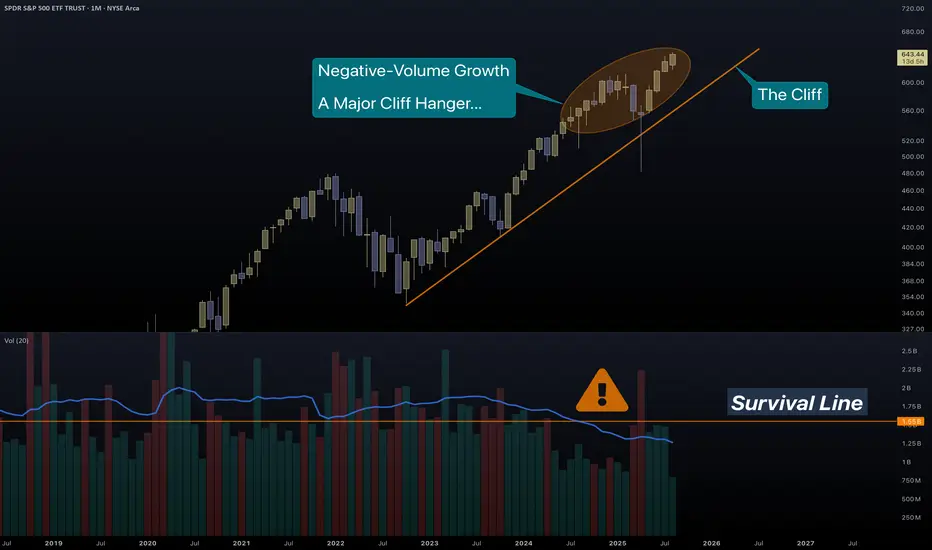
Price growth needs transaction volume to have strength and meaning.
You are too light(headed) to realize that moving further up is a dead-end.
THIS IS NOT SOMETHING SMALL.
SPY is one of the largest Funds in the world. A first-ever major violation of volume trend, in such a big index, must not be ignored. Imagine what is happening underneath...
Look at some examples:
NVDA
The most massive of companies, has a multi-year issue with volume.
MSFT
Unlike its first growth, Microsoft has a tremendous loss of strength in volume metrics.
Such long-term drop in volume means that companies offload real stocks for cheap futures .
We witness the same with Bitcoin...
And gold...
Not quite doomed yet, but troublesome still.
TSLA
Tesla with their shiny and financially pointless cars, has made a pointless growth. Just like many stocks as you will soon realize.
AAPL
The masses, even though their name suggests that they have some matter, in reality they don't. 10% of people have 90% of wealth. Investors have long left Apple, leaving the hoard inside to bubble up the dream.
There is more and more proof that the Fab5 (well the Fab500 as we can see from SPY/SPX) are replacing stocks with derivatives. Real money replaced by weapons of mass destruction, just like Warren Buffett said.
Good luck to us all...
PS. Something irrelevant to stocks, but relevant to the fundamentals of investing in AAPL.
Judging by the recent UI decisions, they trapped the users in bubbles and they are unable to see the truth. Brilliantly, they changed the name of soap bubbles to liquid glass. (bubbles are shiny, crystals are rough).
As a long-time Apple user, now not much of an Apple lover, I know quite well the changing philosophy of them. iPhone (and all products) began as a phone for the "smart" ones and ended up the No1 desire for the masses.
After a decade, I have switched to Fedora Silverblue for 90% of my leisure.
New Bear Market? Heavy Tech SelloffToday the markets were shattered by weakness in mega cap tech.
All major leading companies in the QQQ were severely down.
We saw the majority of the S&P 500 sectors green with health care leading the charge.
Despite all indices closing negative this was not a full fledge market sell.
Commodities were hit across the board. Gold, Nat gas, Oil, Uranium, Silver were all down.
It seems the market is de risking into J Powell Jackson Hole meeting on Thursday / Friday.
Today we closed out NASDAQ:MSFT NASDAQ:PLTR short & trimmed AMEX:MSOS puts for over 105%
We were very active on the option and swing trading side of the market.

Stock Market Forecast | TSLA NVDA AAPL AMZN META MSFTQQQ CME_MINI:NQ1! CME_MINI:ES1! stock market Forecast
Nvidia Stock NASDAQ:NVDA Forecast
Apple Stock AAPL Forecast
Microsoft Stock MSFT Forecast
Google Stock GOOGL Forecast
Amazon Stock AMZN Forecast
Meta Forecast Technical Analysis
Tesla Stock NASDAQ:TSLA Forecast
Magnificent 7 stocks forecast
