LONG ON GBP/CHFGBP/CHF has tapped into a major demand zone and has lots of buy side liquidity to the upside near the supply zone to collect.
I will be buying GBP/CHF to the supply zone looking to catch 400-600 pips.
Multiple Time Frame Analysis

Bullish Maple Syrup (USD/CAD)Setup
USD/CAD has broken below its long term uptrend line and is making lower lows while below the 30 week SMA, indicating a downtrend.
Signal
The daily chart shows a steep downtrend with RSI having twice been oversold at the May and June lows. However, on the most recent re-test of the lows RSI has held up. A double bottom pattern confirmed by a break back over 50 RSI could signal a more sustained bounce.

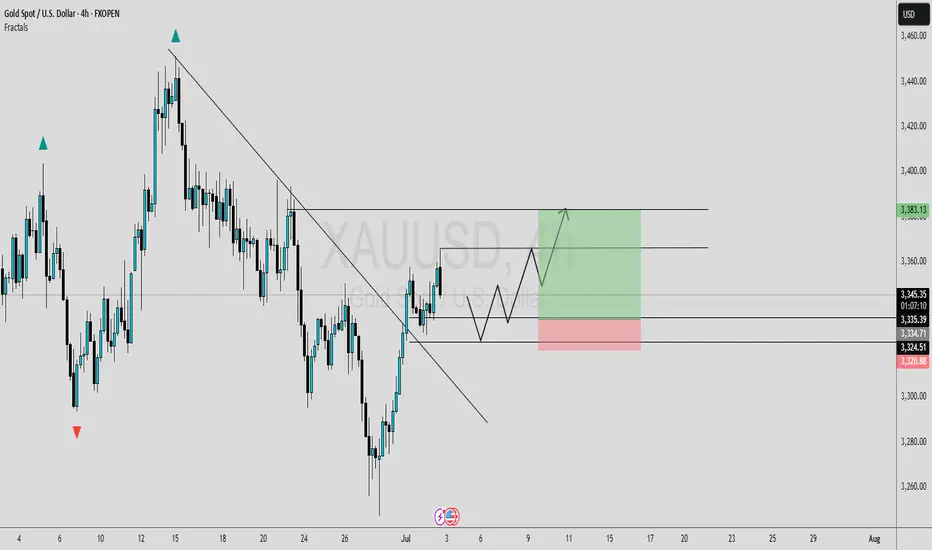
TRENDLINE BREAKOUT [LONG]In this analysis we're focusing on 4H timeframe. As we know that price move impulse toward upside and break trendline, now I'm waiting for retracement. Once price reach my zone and give any type of bullish confirmation than we'll execute our trade. This is a higher time frame analysis and key levels. Let's analyze more deeply into smaller time frame and potential outcomes.
Always use stoploss for your trade.
Always use proper money management and proper risk to reward ratio.
#XAUUSD 4H Technical Analysis Expected Move.
GBPUSD Long, 07 JulyAsia Fill Setup
This is a pure Asia Fill trade, backed by recent bullish LTF structure and a clean reaction from a 15m decisional OB. Although HTF isn’t perfectly aligned for longs, the momentum and intraday structure make this setup valid.
📍 Entry: 1m BOS from 15m OB, refined entry from 1m OB
📈 Confluence: Trend, structure, and Asia high as a clear target
🔁 Risk: SL doesn’t fully cover the OB, but BOS + clean reaction justifies the entry
🎯 Target: Asia High (1:3 RR), with BE secured quickly if price moves favorably
Not a perfect setup HTF-wise, but strong intraday alignment makes it worth the shot.

NAS100 - Stock market is waiting for tariffs!The index is above the EMA200 and EMA50 on the four-hour timeframe and is trading in its ascending channel. Maintaining the ascending channel will lead to the continuation of the Nasdaq's upward path to higher targets, but if it does not rise and corrects towards the demand limits, you can buy the Nasdaq index with appropriate reward and risk.
Three months ago, Donald Trump postponed the imposition of severe retaliatory tariffs, granting America’s major trading partners more time to reach new agreements that Washington views as “fairer.” Now, as the White House’s July 9 deadline approaches, only two official trade deals have been finalized—one with the United Kingdom and another with Vietnam. As for China, merely a fragile temporary truce has been reached, which has so far prevented any additional tariffs from being enforced.
Although reports suggest promising progress in negotiations with India, Japan, and South Korea, no final agreements have been secured with these countries yet. Interestingly, talks with the European Union—which had previously stalled—have suddenly taken a positive turn, and prospects for a deal with Canada in the coming days have also improved.
However, given the limited time left, it seems unlikely that trade agreements with all of America’s 18 key partners will be reached before the deadline. This situation has raised a critical question for the markets: Will Trump set a new deadline for the remaining countries, or will the suspended tariffs be reinstated?
The prevailing view is that the U.S. president will once again resort to threats before granting any extensions—this time not merely by reviving the “Liberation Day” tariffs, but also by promising even heavier tariffs to extract the last concessions from the remaining trade partners.
U.S. Treasury Secretary Scott Bassett stated that if no agreements are reached by August 1, tariffs will revert to the levels announced in April. He also emphasized that Washington’s core strategy in these trade talks is to apply maximum pressure. According to Bassett, letters will be sent to various countries, outlining the August 1 deadline for reaching deals. This news, which broke during the market’s closing hours, sparked a wave of risk appetite in the financial markets.
In a week when the U.S. economic calendar is notably devoid of major data releases, investors are focusing their attention on the minutes from the Federal Reserve’s June FOMC meeting—a document that could offer fresh insights into the trajectory of interest rates for the second half of the year.
June’s strong employment report, which exceeded market expectations, has effectively dashed hopes for an interest rate cut this month. Now, if the positive economic momentum persists, the likelihood of a rate cut in the September meeting may also gradually be priced out by the markets.
According to data from Challenger, Gray & Christmas, U.S. employers announced 47,999 job cuts in June, marking a sharp decline from 93,816 in the previous month. Compared to June of last year, layoffs have dropped by 2%. However, total job cuts in the second quarter of 2025 reached 247,256—a 39% increase from the same period last year (177,391) and the highest second-quarter layoff figure since 2020.
With no significant economic reports scheduled for the coming days, investors will be closely analyzing Wednesday night’s Fed minutes and the limited remarks from central bank officials—statements where every word has the potential to significantly move the markets.

CADJPY: Bullish Move From Support Confirmed?! 🇨🇦🇯🇵
CADJPY may bounce from a key daily horizontal support cluster.
As a confirmation signal, I spotted a bullish imbalance candle
on a 4H time frame after its deep test.
I expect a pullback to 106.65
❤️Please, support my work with like, thank you!❤️
I am part of Trade Nation's Influencer program and receive a monthly fee for using their TradingView charts in my analysis.

EURAUDH4 resistance broken and also have a support trendline. Waiting for a retest to take buys to the next H4 resistance zone around 1.83500. Watch the fundamentals too.

7/3/25 - NOAH: new SELL mechanical trading signal.7/3/25 - NOAH: new SELL signal chosen by a rules based, mechanical trading system.
NOAH - SELL SHORT
Stop Loss @ 12.59
Entry SELL SHORT @ 11.25
Target Profit @ 9.13
Analysis:
Higher timeframe: Prices have stayed below the upper channel line of the ATR (Average True Range) Keltner Channel and reversed.
Higher timeframe: Victor Sperandeo's (Trader Vic) classic 1-2-3/2B SELL pattern...where the current highest top breakout price is less or only slightly peaking higher than the preceding top price.

OPUSDT: Buyers try to regain control inside the rangeHi traders and investors!
On the daily timeframe, OPUSDT is trading in a sideways range. The price has repeatedly dipped below the lower boundary at 0.545, but each time, buyers managed to bring it back.
Now, we’re seeing another attempt to return into the consolidation zone — a possible sign of renewed buyer initiative.
If the price secures above 0.545, the path opens toward the next targets at 0.844 and 0.954. However, a short-term dip below 0.52 may occur within this bullish scenario.
Therefore, buying becomes a priority once the price is firmly back above 0.545.
This analysis is based on the Initiative Analysis concept (IA).
Wishing you profitable trades!

Are you ready for New Miracle ? Doge is one of them#Gold #XAUUSD #PriceAction #Fibonacci #EMA50 #TradingView #Scalping #TrendTrading #LiquidityGrab #AltcoinsSpeakLouder #TradeWithMky
What happens when price dives, grabs liquidity, and kisses the 50 EMA with a bullish shadow candle?
You get what I call a "Miracle Shot" setup.
🔹 Price retraced deeply into a golden zone (between 50–61.8% Fibonacci).
🔹 The candle with a long lower wick shows liquidity grab.
🔹 Immediate bullish rejection right from the EMA50 = clear entry signal.
🎯 Entry: Near EMA50 + confirmation candle
🛑 SL: Below the shadow
✅ TP: Fibonacci extensions at 161%, 261%, and 414%
You can already see how price exploded after this textbook setup.
In the next move (second screenshot), price creates a wick to the upside—classic sign of profit-taking or potential trap for late buyers.
✍️ If price retests EMA50 again with a valid setup, this could be your Re-entry Shot.

PNUT/USDT – Bullish Rebound from Channel Support | Long SetupPNUT/USDT is currently respecting the ascending parallel channel on the 4H timeframe. Price bounced off the lower boundary of the channel, showing signs of a potential bullish continuation. A long position is entered near support, with a target toward the upper range of the channel and a tight stop loss just below the structure.
🔹 Entry: ~0.2218
🔹 Stop Loss: ~0.2140 (below channel support)
🔹 Take Profit: ~0.2521 (upper channel resistance)
🔹 Risk-to-Reward: ~4.2R
The trade aligns with the trend structure and offers a favorable R:R setup. Break of the channel may invalidate the setup.

Long trade
Trade Details
Pair: LTCUSD (Litecoin / US Dollar)
Trade Type: Long (Buyside)
Session: NY AM, Monday, June 23rd, 2025
Time: 11:00 AM
Entry & Exit
Entry: $81.74
Take Profit (TP): $92.84 (+13.58%)
Stop Loss (SL): $79.48 (-2.76%)
Risk-Reward Ratio (RR): 4.91R
Trade Setup & Rationale
Structure: Price was consolidating above its moving averages; bullish momentum was building after the pullback. Confirmation: Entry followed the break above both the EMA (86.90) and WMA (86.02), with strong upward volume.
Target Zones: Take profit set at the top of prior consolidation and gap-fill zone.
Stop: Below the key structural low.

GOLD - POTENTIALLooking at gold. Its still in a bit of limbo after the NFP reaction on Friday. However it is looking like the draw on liquidity is higher. Therefore my bias on gold for the start of the week is bullish so will be looking to get the most optimal entry to take some buys to the upside.
If we can manage to find a decent enough move price really could rally upwards.

DXY (Dollar Index) longs to shortsThe dollar has been bearish for several weeks, but we’re now starting to see signs of a potential retracement due to price being in oversold territory. Last week, DXY reacted from a key weekly demand level, suggesting that we could see some short-term bullish movement before any continuation to the downside.
I’ll be watching closely for price to either push higher into liquidity or retrace slightly deeper into more discounted demand zones for a cleaner long setup. This would also align with my short setups across other major pairs, making DXY strength a key narrative this week.
Confluences for DXY Longs:
DXY has been bearish for an extended period — now showing signs of accumulation on higher timeframes
Price may retrace upwards to collect liquidity before continuing its macro downtrend
Recently reacted from a major weekly demand zone
Imbalances and liquidity above, including Asia highs, remain untapped
P.S. If price fails to react from any of my current POIs, I’ll patiently wait for new zones to develop and adjust accordingly — always staying aligned with what price tells us.
Let’s stay sharp and crush the week ahead!

EUR/USD breakout awaiting EUR/USD has not provided a clear structure over the past week or two. The pair appears to be in consolidation, building liquidity on both sides of the current range. At the moment, I’m waiting for a decisive breakout, ideally followed by distribution within the monthly supply zone, although that zone is still some distance away.
This week, my focus will be on whether a new supply zone forms, closer to current price. If price sweeps the nearby equal highs and then shows signs of reversal, this could give us a fresh supply area to work from. Alternatively, if price moves lower, I’ll be looking at the 8-hour demand zone around 1.16000 for a possible long setup.
Confluences for EUR/USD:
- Although price has been slightly bullish, the current consolidation phase suggests a potential reversal could be on the horizon.
- Liquidity is building on both sides of the range, making a reaction from the monthly supply zone increasingly probable.
- There’s significant downside liquidity still untapped, such as Asia session lows, which could serve as short-term targets.
- For clearer confirmation, we still need a decisive break in market structure to the downside.
P.S. If price sweeps the lower liquidity and moves into the 8-hour demand zone near 1.16000, I will be watching for accumulation to form and signs of bullish intent from there.

USDZAR: Sell Trigger on 4HGood morning and happy weekend everyone,
today I bring the chart of the UsdZar pair which shows a sell trigger via my LuBot Ultimate indicator which goes in favor of the short-term trend and the bearish market structure, both on the 4H and on the Daily, highlighted by the color of the candles in red.
The signal is also confirmed by the reversal signals shown above and a close below the previous 2 candles.
The indicator automatically shows exit levels that I will follow for my trade as the stop loss is far enough away to give the market room to breathe if it needs it and to avoid unnecessary stops. Stop which will subsequently be approached if the market moves in the direction of the trade.
The take profit is at the right distance given that we are close to a support zone indicated by the green area of the indicator.
Finally, the EVE indicator below has not shown any major excesses of volatility so we could still expect a strong movement before a possible reversal.
FX:USDZAR FOREXCOM:USDZAR SAXO:USDZAR FX_IDC:USDZAR OANDA:ZARJPY OANDA:EURZAR OANDA:GBPZAR OANDA:CHFZAR SAXO:AUDZAR SAXO:NZDZAR

GOLD LIQUIDITY MASTERCLASS: The Smart Money Playbook Revealed🧠 INSTITUTIONAL MINDSET
At $3,365: "Perfect! Time to sell into retail buying"
At $3,337: "Let's see how this plays out"
At $3,318: "Preparing for the hunt"
At $3,270: "Starting to accumulate"
At $3,245: "Loading the truck! This is what we've been waiting for"
🔍 LIQUIDITY ZONES DECODED: The Hidden Treasure Map
🎯 BELLOW SELL IF CLOSE CONFIRMED: $3,318
Significance: Close below = bears take control
Time Frame: 4H close confirmation needed
________________
🛡️ BUY ZONE & 1H OB: $3,270
The Fortress: Major institutional buy zone
Order Block Significance: 1H order block provides additional support
Risk/Reward Sweet Spot: Excellent entry for swing positions
_______________
⚡ BUY ZONE + ADD CONFIRMATION LIQUIDITY SWEEP: $3,245
The Ultimate Accumulation Zone: Where smart money loads up
_________ 🎯 STRATEGY _________
Entry: $3,238-$3,2440 (after liquidity sweep confirmation)
Stop Loss: $3,230 (below the sweep low)
Target 1: $3,290 (Risk:Reward 1:3)
Target 2: $3,320 (Risk:Reward 1:5)
Target 3: $3,365 (Risk:Reward 1:8)
🚨 RISK WARNING 🛡️ DYOR 🚨 DISCLAIMER - JUST FOR EDUCATION PROPOSAL ⚠️

XAU/USD possible shorts from 3,350 towards 3,290 longsThis week, my focus is on a potential sell setup that could form within the 4-hour supply zone, which is currently near price. I’ll be patiently watching for signs of Wyckoff distribution within this point of interest (POI), which could confirm a short opportunity.
Given that price action has been bearish, this would be a pro-trend setup, especially with the visible liquidity resting below that we can look to target. Additionally, there is an 8-hour demand zone further below, which may provide a potential long opportunity once price reaches that level.
Confluences for GOLD Sells:
- Bearish market structure: Gold has been trending downward and has recently left behind a clean, unmitigated 4-hour supply zone, which could prompt a bearish reaction.
- Liquidity targets below: There's significant liquidity under recent lows, including Asia session lows and the 8-hour demand zone, which can be targeted.
- DXY correlation: The dollar has reacted strongly from a notable demand zone, suggesting potential upside for DXY, which may add bearish pressure on gold.
- Higher timeframe Wyckoff: A Wyckoff distribution pattern has also formed on the higher timeframe, which may indicate temporary bearish order flow.
P.S. If price disrespects the current 4-hour supply zone, I will shift focus to an extreme 3-hour supply zone above. Until price reaches that level, I may look for short-term buy setups to trade the move up.
Wishing everyone a great and profitable trading week! Stay disciplined and manage risk accordingly.

40 Year Rough EstimateThis chart looks silly, I know. Turn on log to see it a bit better. It sounds absurd, but so does just about any market.
The only thing I can see stopping this is a return to the gold standard. As long as money can be printed for free, it will. Bitcoin can't.
I suspect we'll start seeing the qSAT (quadrillionSAT) shorthand or something, because you can always add more zeroes.

EURUSD - Where next?Looking at EURUSD
I still feel like we are due some sort of deeper retracement to the downside considering how bullish the 4H and Daily time frame have been in recent times.
Although the market does not care how I feel in all honesty haha. I will play the short term short until the 15min orderflow switches bullish once again.
The expansion that is currently happing right now is very interesting and makes a good watch to see what we will do come market open as we are engineering liquidity for both a buy and sell with both POI's looking primed for entries.
Will be keeping a close and keen eye on EURUSD when the market opens
Any questions feel free to give me a message

Aptos Long Term ViewAptos taken out almost all liquidation from below side, it can fall more towards 3.5$ to take out all new buyers and then push towards 15$, remember 15-16$ is an unmitigated zone, sooner or later this imbalance zone will be filled. So if your an investor and want easy 3x gain then buy apt from 5$ 2nd entry 4$ and last buying from 3.5$, ignore lower timeframe volatility and BTC movement, these entries are easily achievable if market crashes by any chance so you can close your position at breakeven. While 7.19-7.50$ area is crucial to break, once this zone is broken there is nothing upside that can stop Aptos from hitting 15$. Any daily candle closing above the marked zone will confirm trend shift, before this trade setup is like high risk n reward. While I'm very confident on Aptos that it will hit 15% mark.

GOLD (XAUUSD) | 4H OB Respected | waiting for 30m LH BreakPair: XAUUSD
Bias: Bullish
Timeframes: 4H, 30M, LTFs
• 4H showing strong bullish structure — OB respected cleanly, confirming higher timeframe demand.
• On 30M, now patiently waiting for the break of LH to confirm continued bullish intent. After that, looking for a sweep off a fresh internal OB for LTF entry confirmation.
🔹 Entry: After LH break + sweep + CHoCH on LTFs
🔹 Entry Zone: Within fresh internal OB post-LH break
🔹 Target: Near structure highs
Mindset: Let the structure speak. No guesswork — wait for your levels, your break, and your confirmation. Precision over prediction.
Bless Trading!

USDJPY| - Bullish Structure Holding | Waiting For Mitigation Pair: USDJPY
Bias: Bullish
Timeframes: 4H, 30M, LTFs
• 4H is showing clean bullish structure — internal high was breached, confirming bullish pressure.
• 30M broke the LH, showing further signs of demand holding.
• Now waiting on price to return and mitigate the OB zone for possible LTF confirmation.
🔹 Entry: Once price hits OB and gives CHoCH/sweep confirmation on LTFs
🔹 Entry Zone: Marked OB on 30M
🔹 Target: Near structure highs (continuation path if demand holds)
Mindset: Ride the wave, not the noise. Let the structure print, and don’t blink when price gives your cue.
Bless Trading!
