USD/JPY - Multi Timeframe Analysis🚀 USD/JPY Forecast: Breaking Out of the Wedge! 🚀
Hey traders! 👀 The USD/JPY is looking like it’s gearing up for a big move, so let’s dive into the charts and break it down.
🔍 4-Hour Chart (Top Left):
We’ve got an Ascending Wedge Formation on our hands! Price has been creeping up towards key resistance, but it’s been bouncing off this trendline like a pinball. Look at the Entry Zone right here — we could see a breakout soon, either to the upside or downside. Are we going to push higher, or is this the calm before the storm? ⚡
🎯 Target Levels:
Target 1: First stop if the breakout happens is just above 155.00.
Target 2 : After that, we’re eyeing 156.00, which could be a major resistance zone.
📅 Daily Chart (Middle):
On the daily, we’re still seeing that wedge formation play out. The pressure is building, and it's almost time for the price to make its move. Will the bulls keep charging, or will we see a shift in momentum? That strong support below might just give us a push if we drop back down.
📊 Weekly Chart (Bottom Right):
Looking at the long-term picture, USD/JPY is in an upward trend, breaking through key resistance levels over the last few months. We’ve already seen a Break of Structure (BOS) at 151.00, and now we’re breaking above 154.00! This could signal the continuation of the uptrend as we eye 156.00 next.
💥 Key Levels to Watch:
Resistance: 156.00 (Eyes on this level — it could be the next big hurdle!)
Support : 152.00 (Look for a possible retracement here if we see a pullback)
Next Target: If we break 156.00, we could see USD/JPY heading even higher towards 160.00 in the coming months!
🔥 What’s Next?
The squeeze is real! Will USD/JPY break higher, or are we about to see a sharp reversal? Either way, there’s plenty of action to look forward to in the coming days. Make sure you’re ready!
💬 How are you planning to trade USD/JPY right now? Drop your thoughts below and let’s discuss the setup!
Multiple Time Frame Analysis

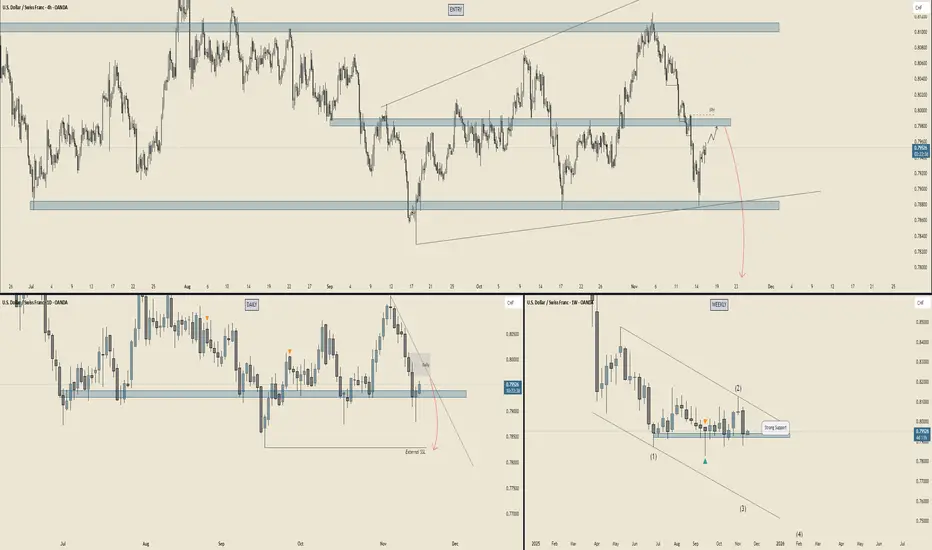
USD/CHF - Multi Timeframe Analysis🚨 USD/CHF Forecast: The Next Move is Almost Here! 🚨
Hey traders, check out this detailed analysis of USD/CHF on the 4-hour, Daily, and Weekly charts. A lot's going on, so let's break it down!
🔍 4-Hour Chart (Top Left):
We’re seeing price testing major support and resistance levels (highlighted in blue). The market looks ready to make a move! We’re keeping a close eye on the Entry Zone at the top, where we might see a continuation of the trend. If we see price action confirming this, it’s game time! ⚡
📅 Daily Chart (Middle Left):
Price has been in a downward trend, but notice that crucial support zone forming below. The trend seems like it could be ready for a bounce back. Will the support hold, or are we headed for a deeper pullback? The next few days will be key! 💡
📊 Weekly Chart (Bottom Right):
Big picture time! This looks like the beginning of something exciting. The longer-term trend is in a clear downward channel (marked by those diagonal lines). That strong support at 0.7800 could be our lifeline. If it holds, we might see the pair shoot up in the coming weeks. 📈✨
💥 Key Levels to Watch:
Resistance : 0.8100 (Keep your eyes on this! It’s a major barrier to break).
Support : 0.7800 (This is where things could get interesting).
Next Target : If the support holds, we could see a move higher toward 0.8000, and potentially test the resistance zone again.
🌟 What’s Next?
The battle between the bulls and bears is heating up! Will USD/CHF rebound off this support level, or will it break lower? Stay tuned for confirmation of the move and prepare for action. 📉📈
BTC Outlook: Premium Rejections, Clean Drawdown Targets, and KeyBTC continues to respect the higher-timeframe bearish order flow. Price tapped into the Daily Bearish Block + IFVG around the $104K–$108K premium zone, delivered displacement, and broke structure to the downside.
From there, the market formed a clean 3H Supply (BB + FVG) where sellers aggressively re-entered. Price rejected that imbalance and continued the markdown phase.
Structure remains bearish with lower-highs and lower-lows being printed. Current PA is consolidating below key structure, signaling that liquidity is being engineered for the next leg.
We still have an unmitigated Weekly OB at $83K–$86K, which aligns with the macro drawdown target. This zone remains the highest-probability area for a deeper corrective bounce.
K ey Levels
Premium Rejection Zone: $104K – $108K
3H Supply + FVG: $98K – $101K
Immediate Support: $92K – $95K
Major HTF Demand (Weekly OB): $83K – $86K
What I Expect Next
Retracement into the 3H FVG / inefficiency before another sell-off.
Liquidity below $92K likely to be swept.
High-probability macro reaction once price taps the weekly OB.
---------------------------------------------------------------------------------------------------------------------
CONFIRMATION ENTRY (Safer Approach)
Use this for precise execution:
Mark the 3H/1H supply zone.
Wait for price to tap the zone → no instant entries.
Drop to M15/M5 and wait for a clear CHOCH (shift) or BOS confirming sellers.
Enter on the pullback into the refined OB or FVG.
SL above the M5 POI that caused the break.
First TP at relative equal lows or clean inefficiencies.
This keeps you out of premature entries and filters manipulation.
XAU/USD 17 November 2025 Intraday AnalysisH4 Analysis:
-> Swing: Bullish.
-> Internal: Bullish.
Analysis and bias remains the same as analysis dated 20 October 2025.
Price has printed as per previous intraday expectation by printing a bearish CHoCH which indicates, but not confirms, bullish pullback phase initiation.
Price is currently trading within an established internal range, however, I will continue to monitor price with regards to depth of pullback.
Intraday expectation:
Price to continue bearish, react at either discount of 50% internal EQ, or H4 supply zone before targeting weak internal high priced at 4,380.990.
Note:
The Federal Reserve’s sustained dovish stance, coupled with ongoing geopolitical uncertainties, is likely to prolong heightened volatility in the gold market. Given this elevated risk environment, traders should exercise caution and recalibrate risk management strategies to navigate potential price fluctuations effectively.
Additionally, gold pricing remains sensitive to broader macroeconomic developments, including policy decisions under President Trump. Shifts in geopolitical strategy and economic directives could further amplify uncertainty, contributing to market repricing dynamics.
H4 Chart:
M15 Analysis:
-> Swing: Bullish.
-> Internal: Bullish.
As per analysis dated 14 November 2025, price has printed a bearish CHoCH to indicate, but not confirm bearish pullback phase initiation.
Price is currently trading within an established internal range.
Intraday expectation:
Price to trade down to either discount of 50% internal EQ, or M15 demand zone before targeting weak internal high, priced at 4,245.195
Note:
Gold remains highly volatile amid the Federal Reserve's continued dovish stance, persistent and escalating geopolitical uncertainties. Traders should implement robust risk management strategies and remain vigilant, as price swings may become more pronounced in this elevated volatility environment.
Additionally, President Trump’s tariff announcements, particularly against China, are expected to further amplify market turbulence, potentially triggering sharp price fluctuations and whipsaws.
M15 Chart:

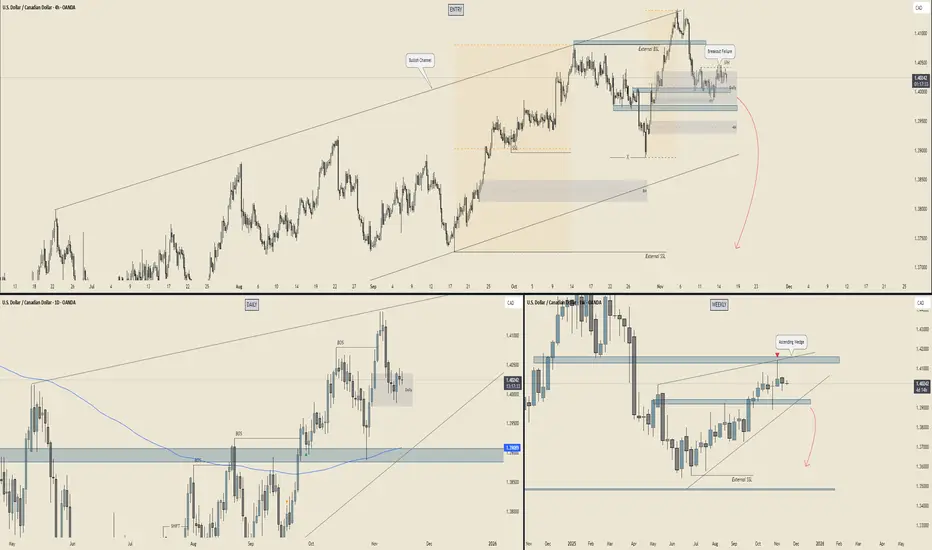
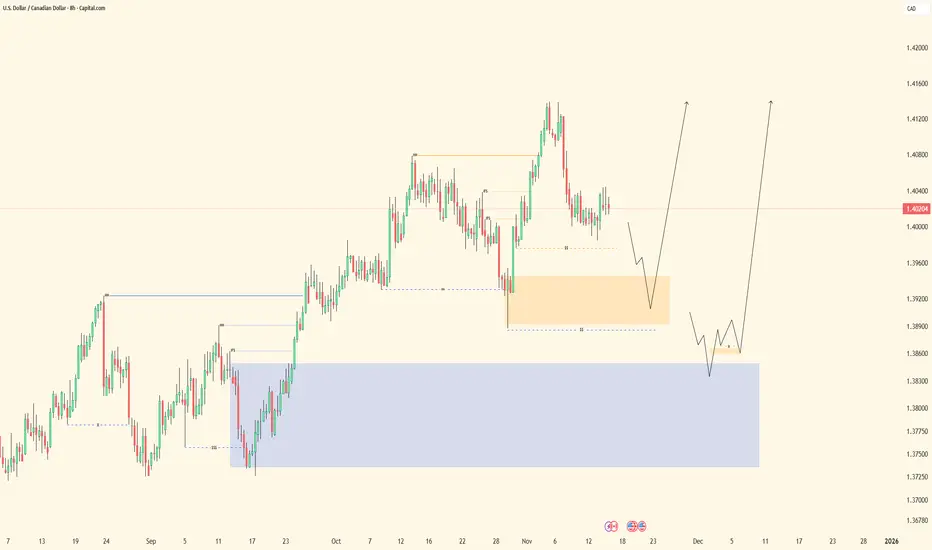
USD/CAD - Multi Timeframe Analysis🧱 WEEKLY – The Big Dog View
Bias: 🐻 Bearish pressure building
Why:
Price is pushing into that massive weekly supply while sitting inside an ascending wedge — textbook distribution energy.
The wedge resistance + supply block is basically a double whammy ceiling.
Reaction wicks show buyers getting tired… sellers warming up.
Beneath current price? A HUGE vacuum of clean, unmitigated price action → easy liquidity to the downside.
🎯 Weekly Target Zones:
1.3900–1.3850 = first stop (mid-range demand)
1.3650–1.3550 = main deep target
External SSL much lower = long-term magnet
👉 Weekly says: “Yo… down only unless we get a breakout above supply.”
📆 DAILY – Internal Structure Rolling Over
Bias : 🐻 Turning bearish
Why : Daily BOS formed on the drop → clear bearish intent.
Price pulled back into a fresh daily supply, reacted cleanly, and is now stalling.
Daily is coiling under resistance = distribution micro-pattern.
As long as the daily mitigation block holds, rallies are just liquidity grabs.
🔥 Daily Key Levels:
Hold below 1.4070 = bearish continuation
Break below 1.3950 = flush into 1.3900
Lose 1.3900 = full send toward 1.38 → 1.37
👉 Daily is setting up the breakdown leg.
⏳ 4H – The Execution Chart (The Juice)
Bias : 🐻 Bearish retest + roll
Why : The 4H bullish channel got broken → structure shift.
We even have a breakout failure at the top = classic “trap the buyers then nuke it.”
4H supply stacking beautifully (Daily + 4H combo).
Price trapped sideways waiting for a trigger → likely a fake-out pop then drop, or a straight collapse.
📌 4H Key Areas:
4H supply: 1.4030–1.4060 = Sell zone
4H support: 1.3950 = Break this → waterfall
Next demand: 1.3880 then the huge imbalance to 1.3800
🎯 4H Targets:
Short-term: 1.3950
Medium: 1.3880
Main: 1.3800
🚀 SUMMARY – USD/CAD Forecast
🔥 Overall Bias: BEARISH (Weekly + Daily + 4H aligned)
🔽 Direction: Expect downside continuation
🎯 Main Target: 1.3800
🧯 Invalidation: Clean daily close above 1.4070 (rare unless oil nukes or USD goes parabolic)
✨ The Likely Path:
Small 4H pullback into supply
Break of 1.3950 internal floor
Fast slide into 1.3880
Larger drop toward 1.3800–1.3750
AUDCHF: Bearish Move From Resistance Confirmed?! 🇦🇺🇨🇭
AUDCHF may drop from the underlined resistance cluster.
A formation of an inverted cup & handle pattern on that
on an hourly time frame and a bearish breakout of its neckline
during the Asian session suggest a highly probable drop lower.
Goal - 0.5174
❤️Please, support my work with like, thank you!❤️
I am part of Trade Nation's Influencer program and receive a monthly fee for using their TradingView charts in my analysis.

EURJPY OutlookSupply and Demand Levels. Which ever one gets mitigated first, then I'll look for confirmations to take a buy or Sell. Though am inclined for a sell than buys.

Trade idea on xauusd Sell trade idea on xauusd
Sell limit order
4076.45
SL:4088.96
Tp1:4052.56
T2:4028.46
Else wait for instant execution if you’re gonna be active
Apply proper risk management

Bitcoin Sell OfferAfter breaking 100.000 $ last week there is a possibility of continued decline.
First supply area would be 97.500 - 100.500 $ which can drive the price toward 87.000$.

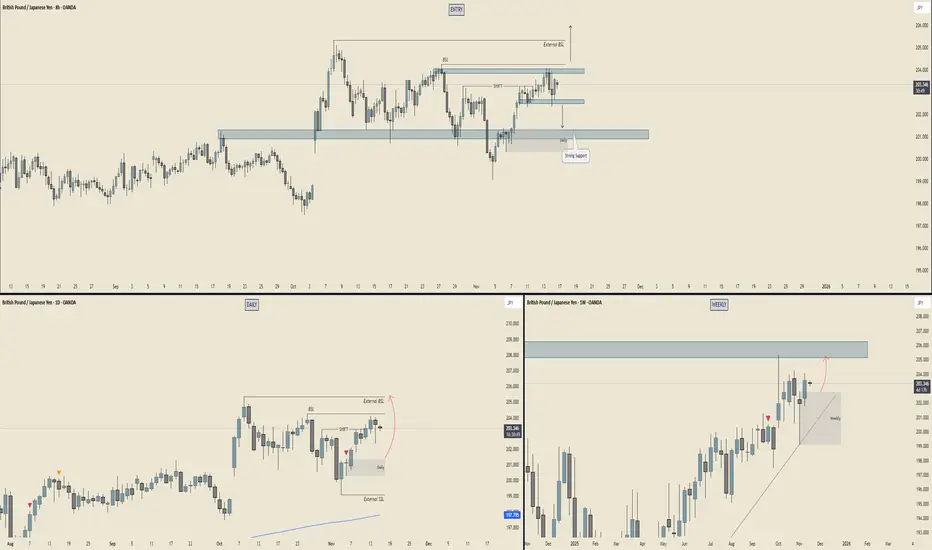
GBP/JPY - Multi Timeframe Analysis⭐ 8H CHART – Mid-Range Chop But Setting Up a Sneaky Play
📍 Current Situation
Price is chilling just under that internal BSL, repeatedly tapping a mini supply shelf. You’ve got a SHIFT marked and a clear reaction zone sitting underneath (your grey + blue combo).
💡 Key Levels
Internal BSL → Gets run, we go hunting for External BSL above.
Strong support block below → Price keeps respecting this like a trampoline.
Market is compressing between:
🔼 8H supply above
🔽 Bullish support block below
📌 Interpretation:
This looks like accumulation under liquidity → classic build-up for a sweep + pop.
If price dips first, your grey demand is the reload zone before any upper raid.
⭐ DAILY CHART – Clean Buyside Above, Built For a Run
📍 Structure
Daily is holding bullish order flow. You’ve got:
Daily BSL close overhead
External BSL even further up
A beautiful Daily demand block (highlighted) that caused the last impulsive leg.
📌 Interpretation:
The arrow you drew says it all — Daily wants that buy-side.
Sweep the daily demand → send price into external liquidity.
Momentum = bullish unless that daily block breaks.
⭐ WEEKLY CHART – HTF Premium Zone Waiting Above
📍 The Big Picture
Weekly demand held weeks ago and price has been climbing ever since.
Key details:
That massive weekly supply / inefficiency block above 205-207 is the magnet.
Price is stair-stepping higher with clean bullish candles.
Arrow toward weekly imbalance = HTF target.
📌 Interpretation:
Weekly is bullish and wants that macro supply fill.
Shorts inside here = countertrend until we hit the big zone.
🎯 SUMMARY – What’s the Play?
🔥 Bias : Bullish on all timeframes
📌 What the market wants:
A tiny correction to demand (8H or Daily)
Run internal liquidity
Push toward 205-207 weekly supply
🧨 What invalidates this?
A clean break and close below daily demand — then the bullish engine loses fuel.
GBPUSD 16/11/2025Weekly:
-FVG.
-Previous week high liquidity sweep.
Daily:
-Bearish W pattern.
-H&S.
4H:
-H&S pattern.

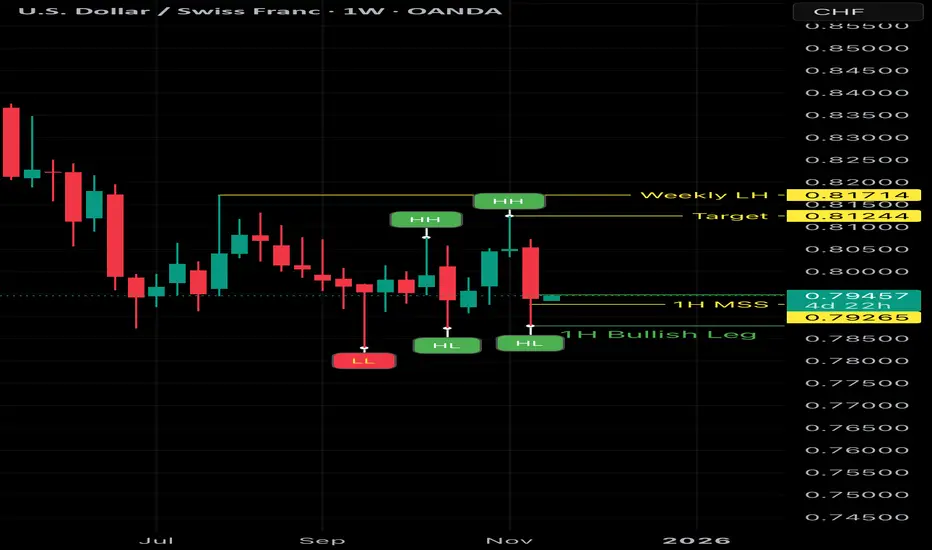
Is This an Early Reversal Signal on USD/CHF This Week?
(The full story: buyer strength forming above the Weekly Low)
NFA – Educational purpose only
USD/CHF has been trading inside a weekly range, and price has just reacted sharply from the Weekly Low at 0.78290 — an area where buyers often step in.
This reaction has created the first meaningful signs of a potential shift inside the broader range.
Let’s walk through the full structure.
1️⃣ Weekly Context — Range + Strong Reaction at 0.78290
The Weekly timeframe is still inside a large consolidation zone, with key boundaries:
• Weekly Low: 0.78290
• Weekly Range Resistance / LH: 0.81714
Price tapped the Weekly Low and bounced immediately — a typical behavior when buyers defend the bottom of a range.
2️⃣ Daily: First Structural Sign of Strength
Following the bounce from 0.78290, the Daily chart printed:
• A Higher Low (HL)
• A Higher High (HH)
This doesn’t confirm a full trend reversal yet,
but it does show that bearish momentum has weakened and buyers are gaining control inside the weekly range.
This is often how early shifts begin.
3️⃣ 1H: Potential Origin of the Next Daily HL
The 1H chart shows the clearest short-term shift:
• A clean bullish leg
• A MSS to the upside
• A fresh FVG created during expansion
• Buyers defending demand on every dip
This type of 1H structure is exactly what often forms the next Daily HL during the early stages of a larger shift.
If buyers continue holding this zone through the week,
the Daily may confirm another wave upward.
4️⃣ Key Zones to Watch This Week
If the bullish structure continues:
• 0.81244 → next Daily target
• 0.81714 → Weekly Range Resistance
These are the natural magnet zones if buyers maintain control.
⸻
5️⃣ The Bigger Story
We are not looking at a confirmed macro reversal yet.
But we are seeing:
• Weekly = range
• Daily = HL → HH above the Weekly Low
• 1H = potential foundation of the next Daily HL
This is how early reversals typically begin inside higher-timeframe ranges.
A full reversal requires a Weekly close above 0.81714 —
but for now, internal structure is clearly shifting upward.
⸻
⭐ Educational Purpose Only
This idea is shared to provide clarity and to show my personal vision of the current structure.
If this analysis helped you or aligned with your view, I’d appreciate your support:
👍 Like
💬 Comment
⭐ Follow
🔄 Share
Your engagement motivates me to keep providing more structured and educational analysis to the community.
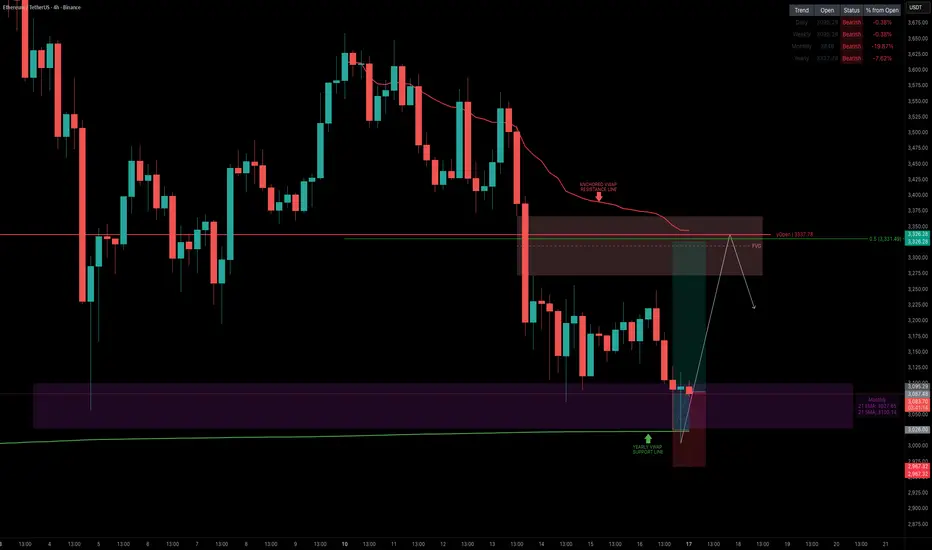
ETH — The $3,000 Rebound Zone: Multi-Confluence SupportETH has reached a key level around $3,000, a major psychological zone that also aligns with multiple high-timeframe supports. The yearly VWAP sits at $3,023.5, providing the first layer of confluence. Additionally, both the 21-month EMA ($3,028) and the 21-month SMA ($3,100) cluster tightly in this region, reinforcing it as a strong structural support zone.
This creates a long setup with a clear invalidation below the $3,000 level. The primary target is the 0.5 Fibonacci retracement at $3,331, which lines up closely with the yearly open at $3,337.78. This area also contains a fair value gap and the anchored VWAP, forming a solid resistance cluster and a logical take-profit zone.
Support and resistance levels are well-defined, and the trade structure is clean.
R:R ~1:5 if entering directly at the yearly VWAP support
R:R ~1:2 if entering at current price levels
Overall, ETH is positioned at a high-probability long zone with strong multi-confluence support and a clear upside target.
🔍 Indicators used
DriftLine — Pivot Open Zones → For identifying key yearly/monthly/weekly/daily opens that act as major S/R reference points
Multi Timeframe 8x MA Support Resistance Zones → to identify support and resistance zones such as the monthly 21 EMA/SMA.
VWAP
➡️ Available for free. You can find it on my profile under “Scripts” and apply it directly to your charts for extra confluence when planning your trades.
_________________________________
💬 If you found this helpful, drop a like and comment!
GBPJPY | Institutional Sell Setup – D1 & W1 Sweeps AlignGBPJPY has completed a multi-timeframe liquidity sweep, with both W1 and D1 sweeps aligning inside a premium price zone.
The structure has shifted bearish following a clear CHOCH and a rejection from the FVG imbalance area, confirming potential downside continuation.
🔹 Execution Bias: Instant Sell
🔹 Entry Zone: 202.60–202.80
🔹 Stop-Loss: Above 203.40 (protected high)
🔹 Target: 199.00 (liquidity zone)
🔹 Bias: Bearish
Technical Breakdown:
• Weekly sweep confirms distribution.
• Daily sweep adds confluence of liquidity grab.
• CHOCH at discount confirms bearish intent.
• FVG + refined OB = smart-money entry zone.
• Targeting inefficiency and old liquidity lows.

Is a Bitcoin crash to $40–45k next? – October 2025In just over a week from now (currently October 23rd, 2025), Bitcoin’s 3 week chart may confirm a bearish engulfing candle (blue circles), unless price recovers $115k.
If you’re a fan of statistics (as I am), you’ll know what comes next: look left. Every single time a 3 week bearish engulfing candle printed with RSI at 57 or below, the result was the same, collapse. Don’t shoot the messenger; all I’m doing is looking left while influencers are looking up.
A confirmed close here would mark the fifth such candle in Bitcoin’s history.
Each prior event retraced to the Fibonacci 0.382, placing a downside target near $40,000. Right back into the historical mean reversion zone.
Such a drop would almost certainly trigger forced liquidations, particularly for leveraged institutional positions (yes, that means MicroStrategy). Debt and drawdowns make for a dangerous combination when gravity reappears.
On the 15 day chart, the situation is already deteriorating, price has exited the rising support channel, exactly as shown in the main 3 week chart above. A strong, high volume reversal from the bulls is required to invalidate this setup.
15 day chart
What about the $160k idea?
For those following closely, you’ll recall “ The End of Bitcoin Begins in 40 Days @ ~$160k (October 2025) ”, the analysis remains technically valid as long as structure holds.
Has market structure failed?
That's exactly what this idea aims to determine. If a 3 week candle body closes below the rising support channel, then it's over. There'll be no new all time high in this cycle, $126,000 was the top as forecast back in 2023 . Until then, the market hangs on a knife edge.
Any clues which way the market takes next?
Indeed there is and it's not from crypto Twitter.
The Bond market never lies. Specifically, the 3 month US Treasury yield, which is in free fall. A classic leading indicator of liquidity stress and risk-off sentiment.
Every time the bond market collapses while equities remain elevated, technology stocks follow soon after. And Bitcoin, like it or not, trades more like a high beta tech asset than an inflation hedge.
Tech versus the 90-day Bond market
For those still clinging to the “Bitcoin is an inflation hedge!” narrative, the chart disagrees.
If you thought the $19B liquidation event was bad, wait until "Hold my beer" Micheal Saylor reaches the point of forced liquidated on unmanageable levels of debt interest. “ Everything Money Plus ” describes the situation perfectly, have a lookie.
Conclusions
Well, here we are again. Bitcoin’s about to do what it always does. Everyone’s screaming “supercycle,” influencers are drawing triangles on charts like they’ve cracked the code to the universe, and meanwhile, the candle’s about to slap them all in the face.
If this 3 week setup confirms, price is going to $40–45k.
Not because of some secret cabal or “market manipulation,” but because… that’s what happens when you buy something that went up 700% and convince yourself it’ll never go down again.
Every cycle it’s the same story.
They say, “This time it’s different.”
But no. It’s exactly the same. Only this time, you’ve got a Discord group cheering you on while you lose your house.
So, will Bitcoin crash? Maybe. Will people still tweet laser eyes while it happens? Absolutely.
Then they’ll blame the FED, the ETFs, the moon’s gravitational pull anything but themselves.
So yeah, maybe it bounces. Maybe it doesn’t.
But when the market dumps and the influencers vanish faster than your portfolio, just remember: the chart did warn you. You just didn’t listen.
Ww
==============================================
Disclaimer
Alright, (puts dram down to one side) let’s get this straight, this isn’t financial advice. Obviously.
If you’re taking trading tips from strangers on the internet with adorable profile pictures, that’s on you.
I don’t work for a hedge fund, I don’t have insider info, and I’m definitely not sitting in a room with ten monitors shouting “buy the dip.”
I’m just looking at the same chart as everyone else and going, “Yeah, that looks a bit grim.”
So, if you sell your house, remortgage your cat, and go all-in on a candle pattern, don’t come crying when it goes the other way. That’s not a “rug pull.” That’s just bad life choices.
Crypto’s volatile. It goes up, it goes down, sometimes both in the same hour.
So, do your own research. Manage your own risk. And if you lose money, at least learn something, because that’s the only guaranteed return in this market.

EURCHF - HTF/Mid-Term OutlookHTF (4H): Bullish
Strong liquidity sits at 0.92676.
We’ve shifted out of the pullback phase and are now aligned with continuation. Mid-term (30M) internal structure has fully formed, mapped, and refined, giving us the framework for a clean bullish leg.
Price took the identified sell-side liquidity (SSL) and dove deeper into the mid-term order block. Normally, I’d expect confirmation from the first orange MTF OB, but price slashed through and tapped into the deeper HTF order block instead — showing that Smart Money wanted a cleaner mitigation.
MTF:
That deeper tap triggered a mid-term trend change, aligning us perfectly with the HTF continuation leg.
The SSL has been swept and price is reacting off a fresh mid-term OB.
HTF candles are also showing strong intent — clean displacement to the right, strong-bodied bullish candle taking control.
If you take it back to candle-reading fundamentals, this is exactly the kind of transition candle that suggests bullish opening momentum once the market opens.
LTF (5M):
Trend change is almost complete inside the overlapping mid-term OBs.
Now all we need is:
• LH break
• Pullback into the 5M OB
• Execution toward external liquidity above
Until then, we let Smart Money direct the delivery cycle and stay patient.
Let’s go.
XAUUSD | Rejection From Premium Zone — Targeting Sell-Side LiqGold has pulled into a premium retracement zone (0.5–0.618 Fib) aligning perfectly with the Daily Wick 50% + previous structure flip level (4,122 zone).
This zone acted as a strong supply block, causing an immediate reaction, confirming bearish order flow.
Price is currently forming distribution under the premium zone, signaling potential continuation downward.
🔍 Detailed Breakdown:
HTF Bias: Bearish below 4,122
Retracement: Into 0.5–0.618 Fib + Daily Wick 50%
Zone of Interest: 4,122 – 4,110 (strong rejection zone)
Current Structure: Lower highs forming → distribution
Liquidity Targets:
4,027 (first liquidity pocket)
4,005 (major sell-side liquidity)
4,000 – 3,995 (extended target if momentum accelerates)
📉 Bearish Confirmation:
A clean rejection from the premium zone + multiple liquidity sweeps at the top indicates smart money shifting direction.
📌 What I’m Watching:
If XAU retests the 4,110–4,122 zone and fails to break above structure →
Expecting a clean sell-off into sell-side liquidity levels.
📚 Concepts Used: Liquidity | Imbalance | SMC | Premium vs Discount | Fib Retracement | Market Structure Shift

"USDCAD - Waiting for the Mid-Term Sweep Before Re-Alignment"USDCAD — HTF/Mid-Term Outlook
HTF (4H): Bullish
Strong liquidity sits at 1.38864.
We’re currently in a pullback phase, not a continuation. Traders operating only on LTFs will likely feel confusion here if they aren’t interpreting structure correctly — because the higher-timeframe leg is still retracing.
MTF (30M/15M): Developing
I’m waiting for sell-side liquidity (SSL) to be swept so price can drop into the mid-term order block sitting below.
This phase is still developing — no reason to rush ahead before the sweep and proper mitigation confirm alignment.
LTF (5M): Pending
Once the sweep + mitigation hits, I’ll shift to the 5M to look for:
• Trend change
• Lower-high break
• Pullback into the nearest structure OB
• Execution with alignment to the 4H bias
Until then, we stay disciplined.
Smart Money directs the delivery — we wait for price to complete its cycle, then act.
Let’s go.
NZDUSD - Pullback Phase Completing Soon? Liquidity TimingNZDUSD — HTF/Mid-Term Outlook
HTF (4H): Bullish
Major liquidity sits at 0.58447.
Price is currently in a pullback phase and already cleared a lot of courtyard liquidity built from the mid-term structure. We’ve seen a clean drop into the 4H order block, which is the higher-timeframe reaction zone I wanted to see.
MTF (30M): Developing
We’ve already received the mid-term lower-high break, confirming bullish intent.
Now I’m waiting for mid-term sell-side liquidity (SSL) to be taken so price can dip back into the next 30M/4H order block beneath.
That sweep + mitigation = alignment.
LTF (5M): Pending
Once market delivers the mid-term sweep, I’ll drop to the 5M for:
• Trend shift
• Pullback into the nearest structure OB
• Clean execution
Until then, structure is still developing — no chasing.
Smart Money directs the delivery.
We stay patient, disciplined, and let price come to us.
Let’s go.

Short trade
1Hr TF overview
PENGUUSDT.P — 1H Sell-Side Setup Breakdown
Date: Sun 16th Nov
Time: 2.00 am
Session: London Session AM
Direction: Sell-Side Trade
🔹Market Context & Narrative
The price is currently rotating within a multi-session distribution range, with repeated failures to sustain a buyside structure above 0.01330–0.01345.
The broader flow is bearish, supported by:
A continuous lower-high structure formed during the London to NY sessions. Multiple FVG inefficiencies filled and rejected (clear displacement candles prior)
Mid-range liquidity above Friday's 0.01335 area is acting as a consistent inducement.
🔹Smart Money Model Sequence
Inducement → FVG → Break of Structure (BOS) → Entry
🔹Sentiment & Narrative Summary
The chart shows a clear distribution, with each session presenting lower highs and reinforcing sell-side intent.

Coinbase token DEGEN: Bull Flag signals potential 340% rallyAfter a significant 70% correction from its highs in May, DEGEN appears to be setting the stage for a strong bullish reversal. The above chart, prepared from observations on weekly and daily timeframes, indicates the correction has now concluded.
Support and Resistance
The former resistance level from March and April (2) has now been established as a support zone since early September. This "flip" from resistance to support is a classic technical signal.
Trend Reversal
A clear trend reversal is visible in both price action and the Relative Strength Index (RSI). Price action has broken out of its short-term downtrend channel, and the RSI has similarly broken above its own downtrend resistance, confirming renewed momentum.
Bull Flag pattern
A well defined bull flag pattern has formed on the daily chart. This is a continuation pattern that typically follows a strong, impulsive move (the flagpole). The current consolidation is the "flag," and it is expected to lead to another impulsive move equal in size to the first.
Price Target and Forecast
Flagpole Measurement: The first impulsive wave from its low to the recent high was approximately 340%. A repeat of this impulsive move from the base of the bull flag projects a price target of 1.5 cents. Assuming the next impulsive wave follows a similar duration to the first, we can anticipate this forecast is reached in approximately 35 days.
Conclusion
The technical setup for DEGEN is highly bullish. The combination of a confirmed support level, a trend reversal in both price and RSI, and the formation of a textbook bull flag pattern provides a high conviction long signal.
Is is possible price action continues to correct? Sure.
Is it probable? No
Ww
Disclaimer: This is for educational purposes and should not be considered financial advice. Always do your own research and manage your risk accordingly.

Bitcoin Death Cross! Save Yourselves! – November 2025A Death Cross. Sounds terrifying, doesn’t it? Like something out of a low-budget horror film. Here in deepest darkest Bavaria you can’t drive ten minutes without seeing Christ nailed to a cross at every T-junction, it’s practically the local logo. Cross the Austrian border and the numbers multiply like leverage traders in a bull run. Lovely.
But this? This is the real death cross. Or at least, that’s what the market thinks.
Déjà vu… for the third time
This is the third time I’ve written this post. And yes, it’s always at max fear. Every cycle the same: people panic, memes fly, and somewhere someone says, “It’s different this time.” Spoiler: it’s not.
If you’re feeling nostalgic, click the little triangles where the purple arrows point on the chart. you’ll see the previous posts. The critics lined up back then too, bless ’em. Loud voices, small wallets, and Mum's voice in the background "Dinner's ready!".
April 7th, 2025 Death cross
August 18th, 2024 Death cross
The November 17th Death Cross
On the 1-day chart above, the signal is forecast to print by November 17th. That’s when the
50-day SMA (blue) crosses below the 200-day SMA (red) and price action sits under the 200-day line. It’s the technical version of your mother saying, “I’m not angry, just disappointed.”
This forecast uses the Trigg & Leach method, the same one applied to prior crosses and it’s nailed every one since the bull market began.
Closer
Zooming out..
Time to market top: circa 59 days
Here’s the clever bit, or as I call it, the boring maths no one reads. Historically after each Death Cross Bitcoin rallied before topping out. The time between the cross and the pivot has been shrinking:
1st Cycle → 179 days
2nd Cycle → 131 days
3rd Cycle → 99 days
Apply some arithmetic progression, that’s a fancy way of saying “find the difference and pretend it means something.”
Difference 1 131 − 179 = −48
Difference 2: 99 − 131 = −32
Average difference = −40
Therefore 99 − 40 = 59 days.
That puts the potential cycle top mid-January 2026, and wouldn’t you know it, mid-January sell-offs are a Bitcoin tradition older than bad YouTube thumbnails.
Conclusions
So yes, a Death Cross is coming. Cue the headlines, the drama, and the bloke on X explaining Fibonacci levels like they’re sacred scripture.
Look left. Every time this happened, it played out the same way: panic, bounce, despair, recovery. Rinse, repeat.
The maths points to mid-January 2026 for the next swing high, and then gravity takes over.
If it all goes to plan, brilliant. If not, add this one to your growing folder titled “Why I don’t listen to anyone on TradingView.”
Ww
Disclaimer
==============================================================
This isn’t financial advice. I’m not your fund manager, your priest, or your mum.
If you go all-in on Bitcoin because two squiggly lines made a cross, that’s your fault, not mine.
If it pumps, you’ll say you “always knew.”
If it dumps, you’ll tweet “market manipulation.”
Either way, I’ll still be here, drinking tea and laughing at the comment section.
So yes it’s a Death Cross. But relax. It’s just a chart, not the Book of Revelation.
Ahmen

