XAUUSD | Bullish - Deep Liquidity Grab + OB MitigationPair: XAUUSD
Bias: Bullish
HTF Overview (4H):
Structure remains bullish, with continuation expected toward prior 4H highs. Last week’s strong bullish intent signaled Smart Money’s directional commitment. Price reached deeper to seek liquidity beneath major sell-side lows, setting the stage.
LTF Confirmation (30M):
Price cleanly mitigated a 30M order block resting just under the swept liquidity. This reinforces the bias, and I’ll now be watching for LTF confirmations once the market opens.
Entry Zone: Within or just above the 30M OB
Targets: 5M and 30M internal highs. Trailing targets will depend on how price delivers.
Mindset Note: Patience is key here. I’m waiting for clean confirmation before executing — no rush. The story is written. I just need the trigger.
Multiple Time Frame Analysis

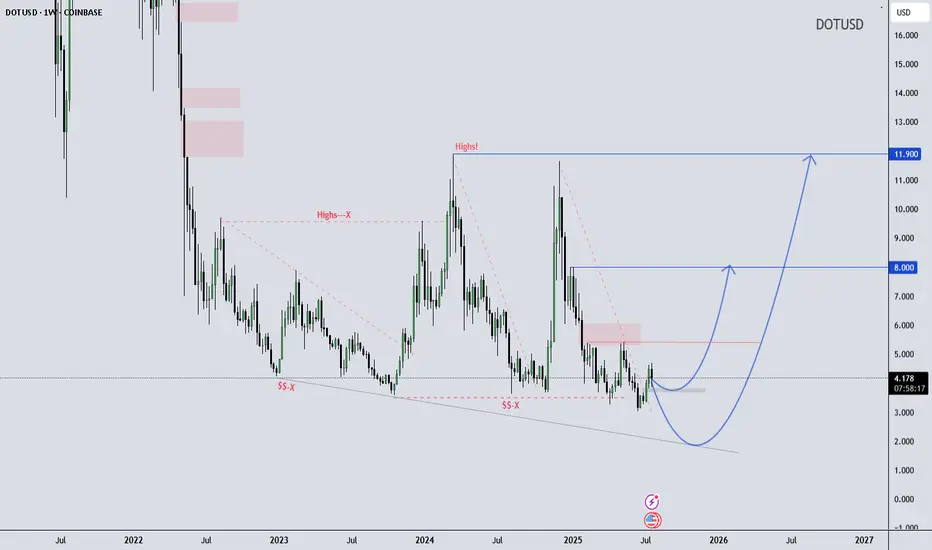
DOT/USD Weekly Structure - - Reversal Possibility Developing DOT/USD Weekly Outlook – Educational Perspective
Polkadot (DOT) is trading near the lower boundary of a long-term falling wedge structure, showing early signs of stabilization around the $4.20 support zone. Price has respected this level multiple times, potentially forming a rounded bottom, which often suggests shifting momentum.
If the structure holds, it may continue developing a macro reversal pattern. This kind of formation is typically monitored by swing traders looking for high risk-reward setups in longer timeframes.
Key Technical Levels to Watch:
$8.00 – Mid-range structural resistance
$11.90 – Historical supply / macro pivot zone
This chart is shared for educational purposes only to support market structure learning. Always follow your own analysis and risk management plan.
Wave Trader Pro
Learn & Earn
GBPCHF SHORT Market structure bearish on HTFs 3
Entry at Daily AOi
Weekly Rejection at AOi
Daily Rejection at AOi
Previous Structure point Daily
Around Psychological Level 1.07500
H4 EMA retest
H4 Candlestick rejection
Rejection from Previous structure
Levels 2.98
Entry 100%
REMEMBER : Trading is a Game Of Probability
: Manage Your Risk
: Be Patient
: Every Moment Is Unique
: Rinse, Wash, Repeat!
: Christ is King.

EURUSD BUYSEU is bullish. It has been consistently making HHs & HLs. I’d look for price to push towards the daily resistance @ 1.83000 then I’d look for price to push towards 1.19000.

Euro Futures Idea.From HTF direction to LTF direction, this is my Trade Idea for the week of 28 July - 1 Aug.
Key Things in this trade idea, HTF PDAs, Liquidity of news high and daily swing and MMSM going on.

Copper Eyeing Key Reversal Point – Will It Break Above 4.68152 ?Copper is currently hovering near the 4.68152 🔼 resistance after rebounding from the 4.50280 🔽 support. Price is reacting to the 50-period SMA, which is slightly above current levels and may act as a dynamic resistance. The overall structure remains mixed with recent lower highs, but bulls have stepped in at key support.
Support at: 4.50280 🔽, 4.27241 🔽, 4.04129 🔽
Resistance at: 4.68152 🔼, 4.83230 🔼, 4.95323 🔼
Bias:
🔼 Bullish: A breakout and retest above 4.68152, and ideally a clean move above the 50 SMA, could signal bullish continuation toward 4.83230 and 4.95323.
🔽 Bearish: A strong rejection at 4.68152 or a drop below 4.50280 could send price back toward 4.27241.
📛 Disclaimer: This is not financial advice. Trade at your own risk.

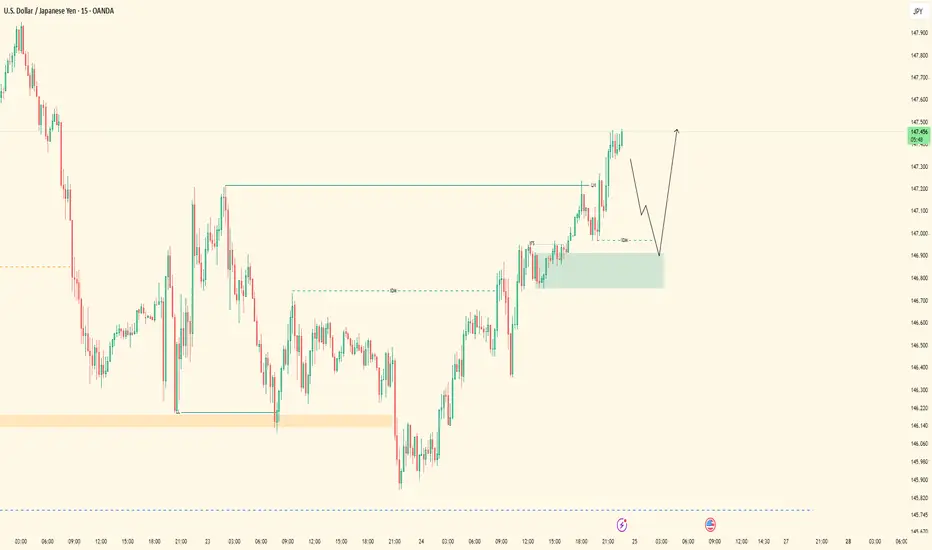
UJ| Bullish Structure Ride | 5M Demand ExecutionPair: USDJPY
Bias: Bullish
HTF Overview: 4H structure stayed bullish with clean intent. Internal liquidity resting above prior highs, and price is still pushing through the 30M range toward those 4H targets.
LTF Confirmation: 30M showed a clean continuation range with a lower high (LH) inside structure — price never broke character. I tracked it into 5M where the OB was sitting patiently.
Entry Zone: Tapped into the 5M OB with a short-term sweep right before — no need for extra confirmation. The move had structure, inducement, and momentum on its side.
Target: TP hit at the 5M highs, but overall I’m watching for the 30M LH to go first, then ultimately expecting price to run the 4H internal highs this upcoming week.
Mindset Note: When the story is clear on the HTF, all you need is one clean LTF entry to ride with conviction. I’m letting the higher timeframe breathe and staying ready.
EURUSD - Next Buy Zone? This one has some nice potential
We will see how it plays out if we get tagged in

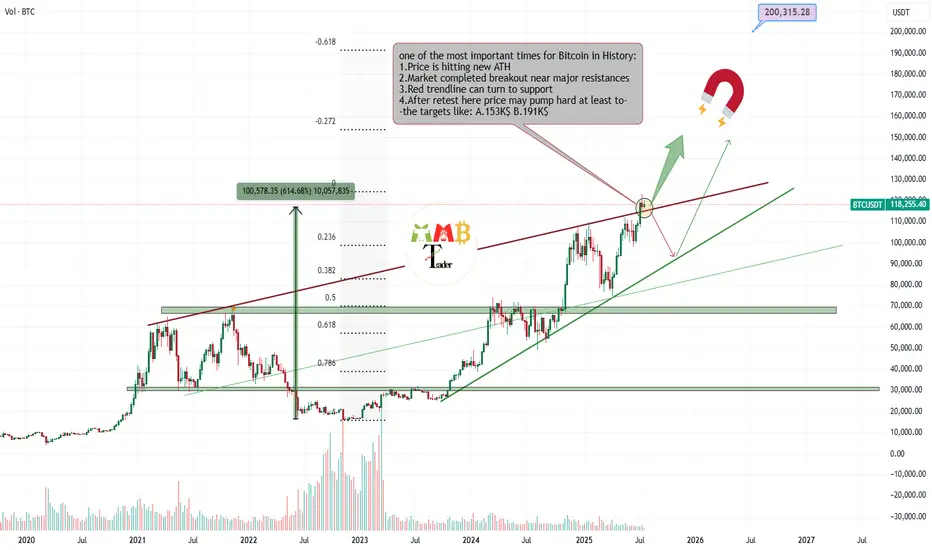
Bitcoin is retesting Critical zone for targeting almost 200K$Most traders around world now don't know what to do with their own trades or spot holdings, because some are in profit and how doubt of more pump and are still holding and some others miss this massive pump and think it can rest and fall now and it is not a good time to enter long.
And many other questions and thoughts At this time is simply check the chart and do these simple steps which are some mentioned and some not due to huge content.
Delete all of my previous drawings and start new Charting the price and see new trendlines or supports and resistances formed.
Then technically check the volume and breakouts and ... once again and here for Bitcoin i still find out chart looks extremely bullish to me and at this orange zone which is price is getting a little slow some important things may happen.
30% is expecting price fall below red trendline again and see short-term fall.
70% is expecting price complete retest of breakout here or pump more ASAP and then hitting targes like 150K$ and more for $BTCUSDT.
DISCLAIMER: ((trade based on your own decision))
<<press like👍 if you enjoy💚
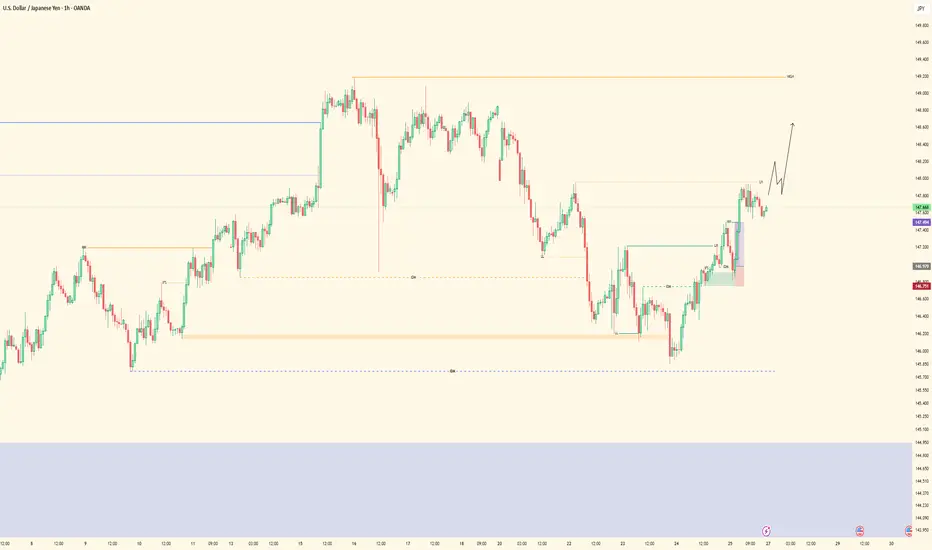
BITCOIN (BTCUSD): Recovery Starts
Bitcoin is going to rise from a key daily support.
After a liquidity grab, the market shows a clear strength,
forming a double bottom on an hourly time frame.
I expect a bullish movement at least to 117100
❤️Please, support my work with like, thank you!❤️
I am part of Trade Nation's Influencer program and receive a monthly fee for using their TradingView charts in my analysis.

SHORT ON EUR/NZDEZ Has given a nice CHOC to the downside with plenty of sell side liquidity to be collected.
I will be selling EZ to the next level of demand looking to catch 300-500 pips

XAU/USD 25 July 2025 Intraday AnalysisH4 Analysis:
-> Swing: Bullish.
-> Internal: Bullish.
You will note that price has targeted weak internal high on three separate occasions which has now formed a triple top, this is a bearish reversal pattern and proving this zone is a strong supply level. This is in-line with HTF bearish pullback phase.
Remainder of analysis and bias remains the same as analysis dated 23 April 2025.
Price has now printed a bearish CHoCH according to my analysis yesterday.
Price is now trading within an established internal range.
Intraday Expectation:
Price to trade down to either discount of internal 50% EQ, or H4 demand zone before targeting weak internal high priced at 3,500.200.
Note:
The Federal Reserve’s sustained dovish stance, coupled with ongoing geopolitical uncertainties, is likely to prolong heightened volatility in the gold market. Given this elevated risk environment, traders should exercise caution and recalibrate risk management strategies to navigate potential price fluctuations effectively.
Additionally, gold pricing remains sensitive to broader macroeconomic developments, including policy decisions under President Trump. Shifts in geopolitical strategy and economic directives could further amplify uncertainty, contributing to market repricing dynamics.
H4 Chart:
M15 Analysis:
-> Swing: Bullish.
-> Internal: Bullish.
H4 Timeframe - Price has failed to target weak internal high, therefore, it would not be unrealistic if price printed a bearish iBOS.
The remainder of my analysis shall remain the same as analysis dated 13 June 2025, apart from target price.
As per my analysis dated 22 May 2025 whereby I mentioned price can be seen to be reacting at discount of 50% EQ on H4 timeframe, therefore, it is a viable alternative that price could potentially print a bullish iBOS on M15 timeframe despite internal structure being bearish.
Price has printed a bullish iBOS followed by a bearish CHoCH, which indicates, but does not confirm, bearish pullback phase initiation. I will however continue to monitor, with respect to depth of pullback.
Intraday Expectation:
Price to continue bearish, react at either M15 supply zone, or discount of 50% internal EQ before targeting weak internal high priced at 3,451.375.
Note:
Gold remains highly volatile amid the Federal Reserve's continued dovish stance, persistent and escalating geopolitical uncertainties. Traders should implement robust risk management strategies and remain vigilant, as price swings may become more pronounced in this elevated volatility environment.
Additionally, President Trump’s recent tariff announcements are expected to further amplify market turbulence, potentially triggering sharp price fluctuations and whipsaws.
M15 Chart:

GBPUSD Long, 25 JulyHigh Risk HL Play from 5m OB + D EMA Support
We’re reacting off a Daily Bearish OB, but price got rejected precisely into the D 50EMA, creating a potential HL. Confluence comes from DXY aligning for a bounce and a 5m OB entry on GU, even though LTF structure isn’t ideal.
📈 HTF Confluence:
✅ Rejection from Daily OB → back to D 50EMA
🔄 Trend unclear, but EMA tap suggests short-term buy opportunity
📍 EMA sits right in the same zone as our LTF POI → stacked confluence
📉 LTF Context:
✅ Asia range formed
✅ DXY also in its Asia + 15m POI zone → supports GU long bias
❌ No LTF BOS or strong structure shift on GU yet
🎯 D Imbalance on GU still unfilled = TP area
🎯 Entry Plan:
✅ 50% position already in from 5m OB tap, which aligns with HTF EMA + DXY 15m POI
⏳ Waiting for 1m BOS to confirm the rest of the entry
❗ This is the last unmitigated OB before invalidation – strong RR if it holds
🛡 SL: Placed below 5m OB to protect structure
📌 TP: D Imbalance above, aligns well with a clean 1:5 RR, but will take partials at asia high or 1:3

GBPUSD ENTRY CHARTOn this Pair, We are bullish, as the Dollar is still weak and the POUNDS DOLLAR is still in an UPTREND, on the HTF and the MID-TERM-TF, also on the Hourly, we got a Zone with additional confluences that are in align with the Trend, then on our Entry TF, We got a Sweep of LIQ, BOS and IND close to our POI, so we are IN, and if this matches with your TRADE IDEA, i advise you add a good risk management to manage your Trade, THANK YOU.

posting full SSThis post serves only to share the complete SS, which was not inadvertently included in the earlier post shared today.
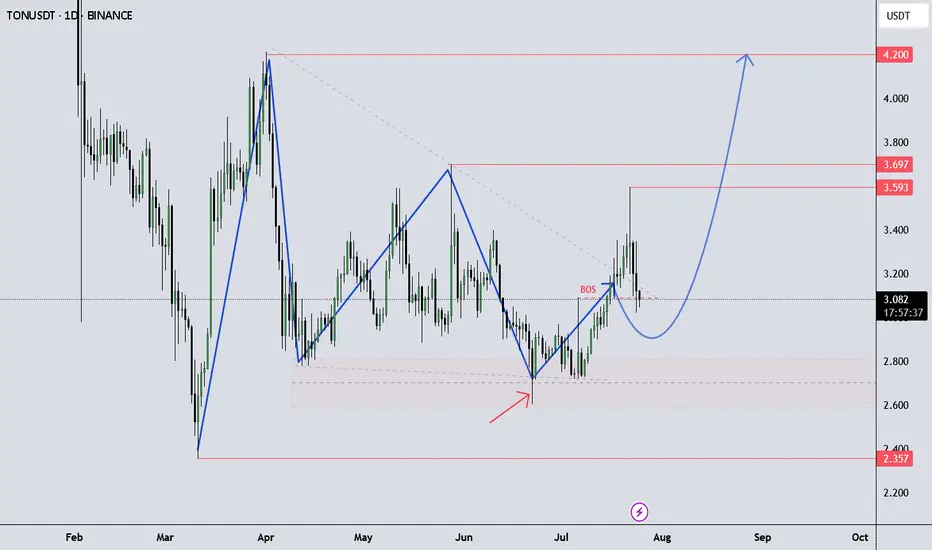
TONUSDT continue up!Looking for an Impulse Up – TONUSDT Outlook
TONUSDT is showing momentum to the upside as it continues its current structure, possibly developing another impulsive leg.
It’s important to follow your own trading plan and maintain proper risk-reward (RR) discipline.
This idea is shared for educational purposes only to support your learning.
Got questions? Feel free to drop them in the comments!
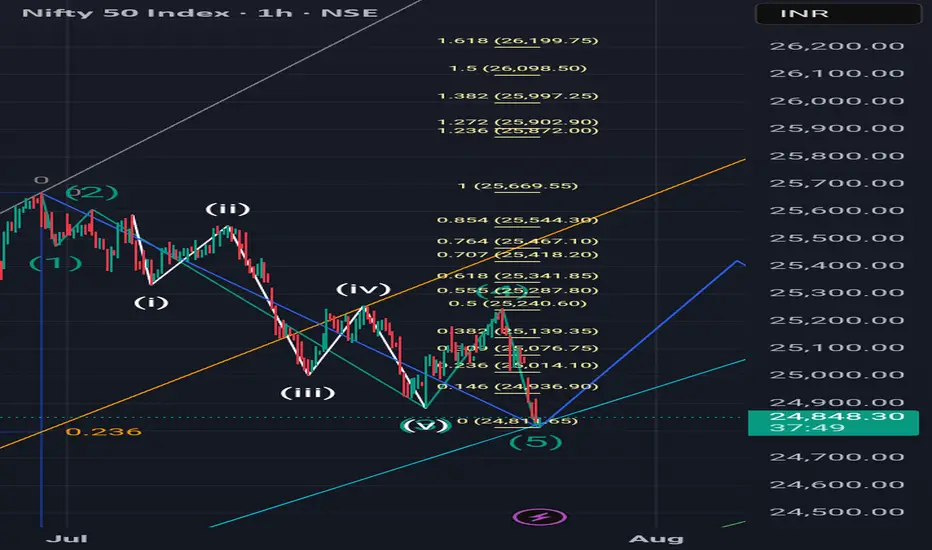
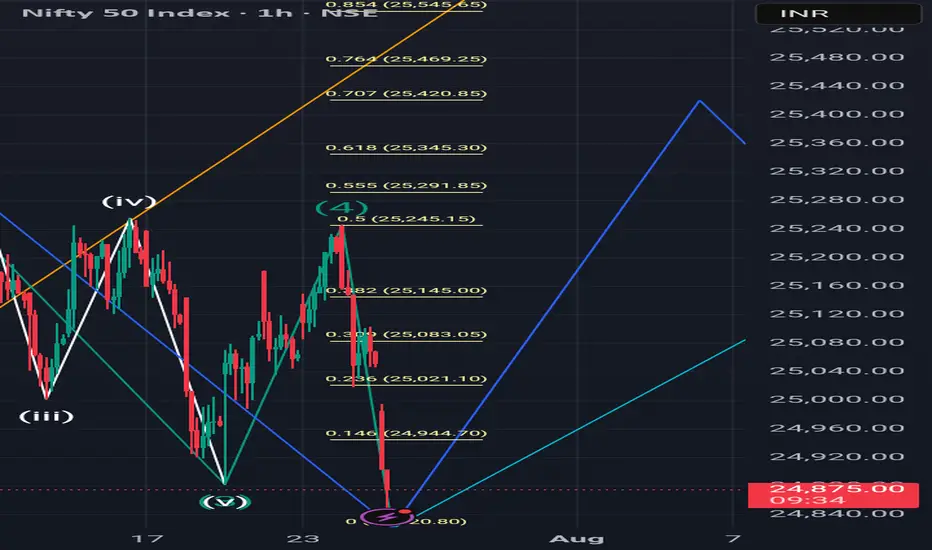
A correction ahead.If you know Elliott Wave, then you will understand this analysis. Now as you saw my last post a wave 'Y' on monthly T.F has started from 30 June. This was on a larger T.F but this analysis is on smaller T.F. Wave '1' has completed now on this T.F. and a correction ahead upto 0.618(25345) or 0.707(25420) of this enfire run as showed in screenshot.
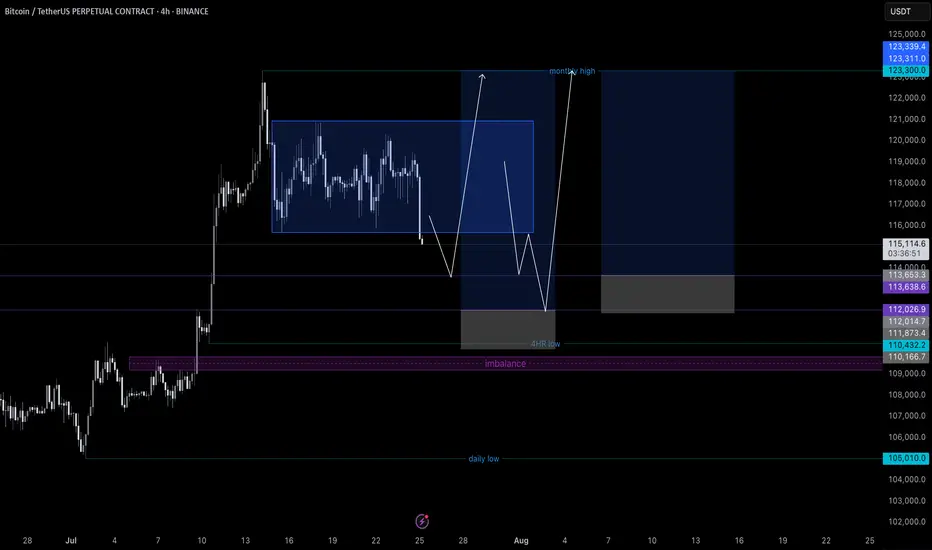
Bitcoin possible bounce setupsThis is the only ideal long setups for bitcoin right now to keep bullish momentums
XAUUSD Locked In| Waiting for 5M OB SparkPair: XAUUSD (Gold)
Bias: Bullish
Timeframes: 30M / 5M
Gold has followed structure beautifully — top-down alignment from 30M into 5M is clear. Price respected the 30M OB and showed intent, but now we’re approaching the moment of truth.
I’m watching the 5M OB for entry — this is where execution mode activates. No rush. I’m in analysis mode right now, but the shift is coming.
Entry zone is mapped, structure’s in place, order flow is aligned — all I need now is price to do what it always does: respect the blueprint.
Entry Zone: 5M OB
Target: 5M highs
Mindset Note: Patience before the spark. I don’t force entries — I wait for the market to hand me the move it already hinted at. ⚡️

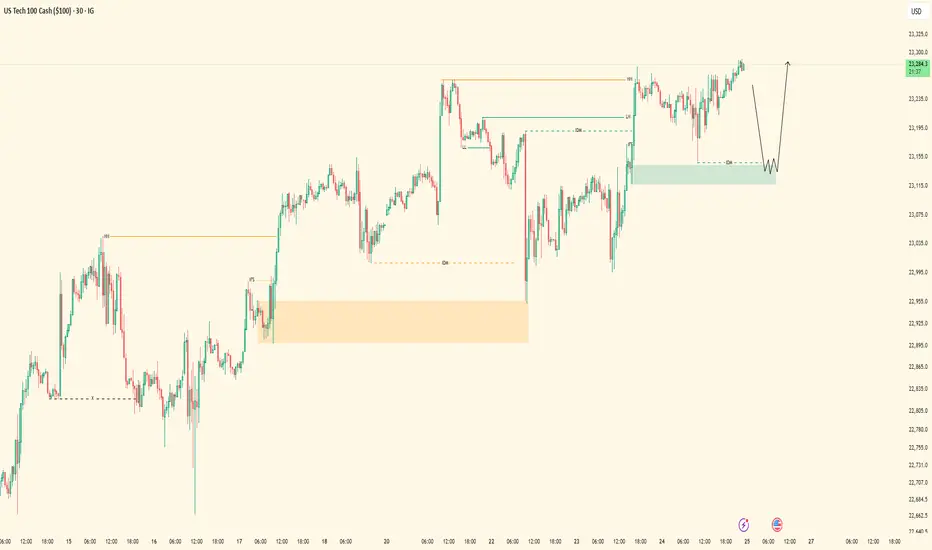
Nasdaq Bullish Flow | 5M OB Execution PendingPair: NAS100
Bias: Bullish
Timeframes: 30M / 5M
Price remains heavy bullish — structure aligning perfectly across the board. Ever since the 30M OB was mitigated, I’ve been following Nasdaq’s order flow step-by-step.
I was watching for full-bodied confirmations inside the 30M zone, but instead, price gave clarity through the lower timeframes. That 5M flip gave away smart money’s intent — showing me exactly where accumulation is happening.
Now waiting for price to tap into the 5M OB to shift into execution mode. This setup has been mapped with precision — no guessing. Once entry presents itself, I’ll follow through.
Entry Zone: 5M OB
Target: 5M highs
Mindset Note: Still in analysis mode — patience until price hits my zone. Smart money doesn’t rush, it accumulates. So do I. 💼
UJ Exexcution Flow| 5M OB Setup in MotionPair: USDJPY
Bias: Bullish
Timeframes: 30M / 5M
Top-down structure respected cleanly across the board — from HTF to LTF, price has been flowing exactly as forecasted. After confirming the bearish LH break and structure flip, we’re now in a bullish leg with intent clearly shown on the lower timeframes.
Currently waiting for price to mitigate the marked 5M order block for precise execution. Entry is valid and backed by structural logic — no guessing, just following what price has already confirmed.
Entry Zone: 5M OB (confirmed after LH break + LTF intent) Target: Clean 5M highs
Mindset Note: Analysis mode done. Execution mode engaged. I let price lead — I just follow structure.
Welcome Back! Gold Trading Strategy & Key Zones to WatchIn this week’s welcome back video, I’m breaking down my updated approach to XAU/USD and how I plan to tackle the Gold markets in the coming days. After taking a short break, I’m back with fresh eyes and refined focus.
We’ll review current market structure, identify key liquidity zones, and outline the scenarios I’m watching for potential entries. Whether you’re day trading or swing trading gold, this breakdown will help you frame your week with clarity and confidence.
📌 Covered in this video:
My refreshed trading mindset after a break
Key support/resistance and liquidity zones
Market structure insights and setup conditions
What I’ll personally avoid this week
The “trap zones” that might catch retail traders off guard
🧠 Let’s focus on process over profits — welcome back, and let’s get to work.

NovoCure Limited (NVCR) to rally 100% ??** short term forecast, days and weeks ahead **
On the above 10 day chart price action has crashed 95% since support failed. Today sellers are trying to push that correction to 100%, are they right?
Unlikely.
1) Price action (not visible on LOG) and RSI resistance breakouts.
2) Support on past resistance confirms.
3) Trend reversal. Higher lows print.
4) Bull flag confirmation forecasting a 100% move to mid 30’s.
Is it possible price action corrects further? Sure.
Is it probable? No.
Ww
Type: trade
Risk: you decide
Timeframe for long: Yesterday
Return: 100%
Stop loss: Will say elsewhere
