IBST - UK LongPrice holding historic level
Daily piercing line reversal candle on the level
Weekly long lower shadow/hammer candle on the level
Ensure stop loss is set, this is a heavily shorted stock at the moment.
Hoping a reversal here may cause shorts to fold and cause a reflexive rally
Multiple Time Frame Analysis

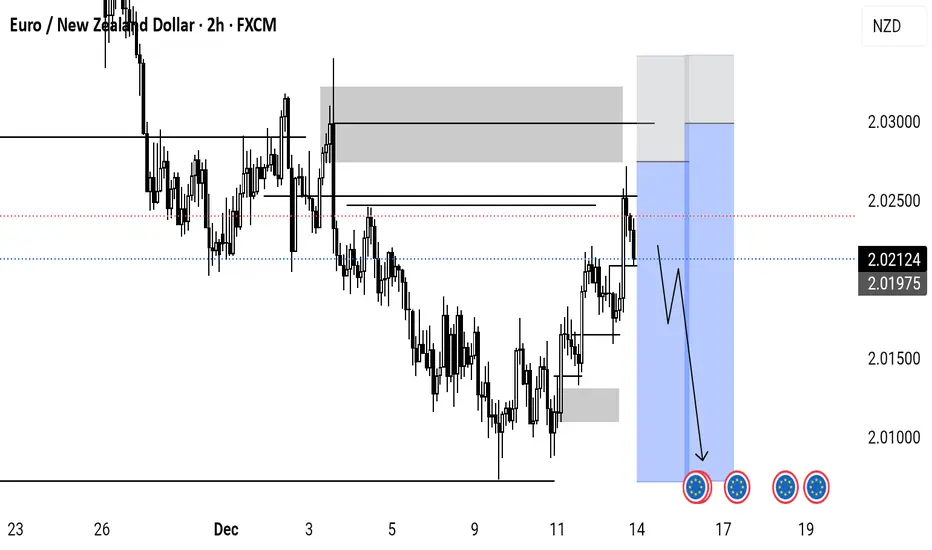
Eurnzd outlookBearish on this pair this week due to the overall bearish trend. Price can just keep falling from that point this week cause liq has been swept and D supply has been mitigated.
In order to increase the reward to the risk I've set my 2 orders above that high.
Manage risk if interested
GC weekly trading plan for Dec 15-19On weekly chart gold closed bullish and above previous week high. Looking for continuation of this bullish move towards all time highs.

XAU/USD 15 December 2025 Intraday AnalysisH4 Analysis:
-> Swing: Bullish.
-> Internal: Bullish.
Analysis and bias remains the same as analysis dated 20 October 2025.
Price has printed as per previous intraday expectation by printing a bearish CHoCH which indicates, but not confirms, bullish pullback phase initiation.
Price is currently trading within an established internal range, however, I will continue to monitor price with regards to depth of pullback.
Intraday expectation:
Price to continue bearish, react at either discount of 50% internal EQ, or H4 supply zone before targeting weak internal high priced at 4,380.990.
Note:
The Federal Reserve’s sustained dovish stance, coupled with ongoing geopolitical uncertainties, is likely to prolong heightened volatility in the gold market. Given this elevated risk environment, traders should exercise caution and recalibrate risk management strategies to navigate potential price fluctuations effectively.
Additionally, gold pricing remains sensitive to broader macroeconomic developments, including policy decisions under President Trump. Shifts in geopolitical strategy and economic directives could further amplify uncertainty, contributing to market repricing dynamics.
H4 Chart:
M15 Analysis:
-> Swing: Bullish.
-> Internal: Bullish.
As mentioned in my analysis and intraday expectation dated 11 December that I will allow price to print pause and to confirm an internal high.
Price has printed a bearish CHoCH and reacted at almost precisely 50% internal EQ.
Intraday expectation:
Price to target weak internal high priced at 4,353.555.
Note:
Gold continues to exhibit elevated volatility as markets digest the Federal Reserve’s ongoing dovish tilt and persistent global geopolitical tensions.
With uncertainty remaining a dominant theme across global risk assets, traders should prioritise disciplined risk management, as abrupt price swings and liquidity pockets may become increasingly common.
Furthermore, recent tariff announcements from President Trump, particularly those directed at China, have added another layer of instability to the macro landscape. These policy developments have the potential to intensify market turbulence, heighten risk‑off flows, and trigger sharp intraday reversals or whipsaw‑like behaviour in gold.
M15 Chart:

GBPUSD BULLISH CONTINUATION Retesting previous H4 resistance zone. Price is near trendline support and 50EMA. Current H4 candle looking good for an engulfing, will be waiting for its close before looking for entry.

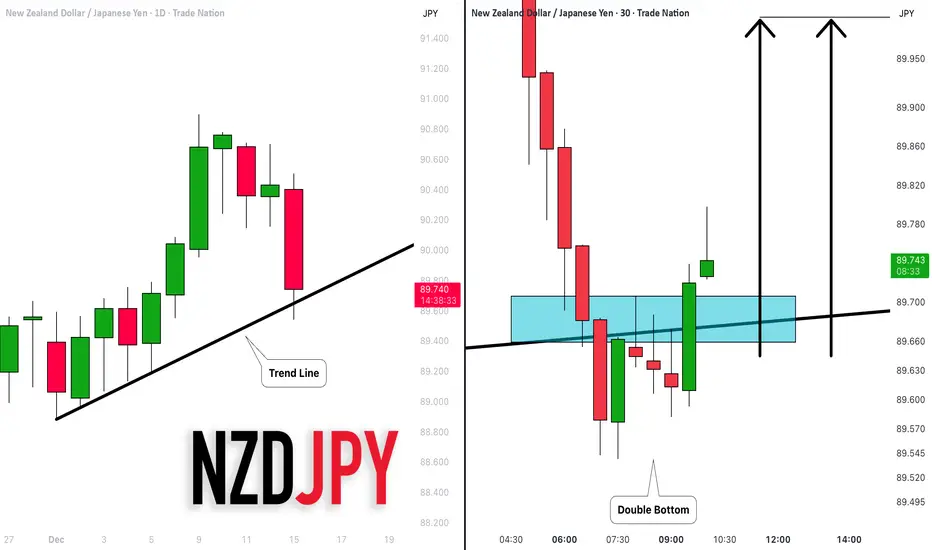
NZDJPY: Bullish Move From Trend Line 🇳🇿🇯🇵
NZDJPY may bounce from a strong rising trend line on a daily.
My confirmation signal is a double bottom pattern
on 30 minutes time frame.
Target - 0.8998
❤️Please, support my work with like, thank you!❤️
I am part of Trade Nation's Influencer program and receive a monthly fee for using their TradingView charts in my analysis.
EURNZD: Overbought Market & Pullback 🇪🇺🇳🇿
EURNZD went overbought after a strong bullish wave.
The market started to lose momentum, approaching
a key daily resistance cluster.
A bearish engulfing candle formation on 30 minutes time frame
indicates a local strength of the sellers.
There is a high chance to see a pullback at least to 2.0275
❤️Please, support my work with like, thank you!❤️
I am part of Trade Nation's Influencer program and receive a monthly fee for using their TradingView charts in my analysis.

DOW JONES INDEX (US30): Bullish Move From Support
US30 broke and closed above a horizontal resistance cluster
based on a previous All-Time High.
The broken structure turned into a strong support.
We see its retest this morning.
Probabilities will be high, that the market will rise
and reach at least 46726 resistance soon.
❤️Please, support my work with like, thank you!❤️
I am part of Trade Nation's Influencer program and receive a monthly fee for using their TradingView charts in my analysis.

You're Early, Not Wrong*Trading Isn’t Hard Because of Entries.
It’s Hard Because Most Traders Don’t Wait for Alignment.
Most traders think trading is hard because:
• They can’t find the right entry
• They struggle to focus
• They’re distracted
• They don’t have enough time
• They think their strategy doesn’t work
Those are symptoms.
The real reason trading feels hard is because most traders don’t understand alignment.
⸻
📍 What Alignment Actually Means
Trading is not about being early.
It’s about being in sync.
Price moves cleanly only when:
• Higher-timeframe objectives are active
• Liquidity has been engineered and taken
• Price is delivered to fair value (premium/discount)
• Lower timeframes execute the higher timeframe plan
If even one piece is missing, the market feels random.
It’s not random — it’s misaligned.
⸻
📉 Why “Good Setups” Fail
Most losses don’t come from bad strategies.
They come from forcing execution before alignment.
Example:
• Liquidity gets swept
• Traders enter immediately
• Nearest order block fails
• Price goes deeper
Nothing broke.
Price was simply seeking better alignment on a higher controlling timeframe.
⸻
⏳ Patience Is Not Waiting for Price
Patience Is Waiting for Timeframes to Agree
This is the part no one wants to hear:
The market doesn’t pay you for being active.
It pays you for being in position at the right moment.
Alignment is rare.
That’s why consistency is rare.
⸻
🧩 Once You See Alignment, Trading Gets Quiet
When timeframes are aligned:
• You stop chasing
• You stop panicking when OBs fail
• You stop needing constant entries
• You stop overtrading
You start waiting with intent.
⸻
Final Thought
If trading feels hard right now, ask yourself:
Am I actually wrong… or am I just early?
There’s a difference.
🧠 The market is never confusing — it’s just ahead of you.
Let alignment catch up before you act.

AUDCAD - Bullish Continuation WatchBias:
Bullish.
⸻
4H:
HTF structure remains clean and intact. Monitoring price to see if continuation can be attended.
⸻
30M:
Mid-term structure is being tracked. Waiting for SSL to be taken, leading price into a test area. From there, I’ll hold for proper confirmation.
⸻
5M:
On LTF, once a LH break is confirmed, I’ll assess buy execution on the bullish leg. Until everything aligns — patience remains the edge.

USDCAD - Bullish Continuation (Correction Phase)Bias:
Bullish.
⸻
4H:
HTF bullish structure remains intact after breaking significant highs. Market is trending but currently in a corrective phase.
⸻
30M:
Mid-term structure is being monitored. Waiting for a major LH break to confirm continuation intent. Once applied, I’ll look for SSL to be taken and for price to fall into a mid-term OB test area. Execution only after mitigation.
⸻
5M:
On LTF, I’ll wait for a minor LH break to confirm direction. Until structure aligns, patience remains key and the process continues.

EURUSD- Bullish ContinuationBias:
Bullish.
⸻
4H:
HTF structure remains intact from previous weeks. No rush here — just tracking price and letting delivery develop.
⸻
30M:
Mid-term LH break printed this week, shifting focus to bullish continuation. I’m now looking for buy interest into the SSL OB resting underneath. Once mitigation applies, that’s the check.
⸻
5M:
After mitigation, I’ll wait for a LTF CHOCH. From there, I’ll look for a liquidity sweep, OB mitigation, and entry. Execution only happens once everything aligns.
Then I’m on go.
⸻
Patience first. Let’s get it.

EURGBP - Bullish ContinuationBias:
Bullish.
⸻
4H:
HTF structure remains mapped and refined. Price mitigated the HTF OB and took out a major liquidity pool, leading to a controlled pullback. Mid-term price action is now working around key HTF levels.
⸻
30M:
Mid-term price action engineered a liquidity sweep, intentionally violating mid-term levels to gather stronger fuel for continuation. Once the mid-term LH break is confirmed, I’ll begin seeking bullish interest.
⸻
5M:
After the mid-term LH break, I’ll refine LTF structure and track price until it becomes readable. Following the LH breach, liquidity should be taken and delivered into an OB. I’ll then wait for a 5M CHOCH flip into a new testing area for buy execution.
Until then — patience is key.

CADJPY- Bullish ContinuationDaily:
Bullish.
⸻
4H:
Clear higher highs and higher lows. Strong bullish momentum remains intact and continuation remains in sync.
⸻
30M:
Price broke major highs and left upside liquidity. Currently waiting for SSL to be taken and for price to deliver into an OB beneath. Execution comes only after mitigation and confirmation.
⸻
5M:
Once the 30M mid-term zone is tapped, I’ll wait for LTF structure to confirm the hold. If applied, buy execution will follow the bullish leg.
Until then — patience is key.

AUDCAD – When Price Refuses to Come BackThis chart isn’t interesting because of what price did.
It’s interesting because of what price refused to do .
After a clear structural shift, AUDCAD printed a bullish breaker and then launched vertically. No hesitation. No overlap. No courtesy pullback. Just expansion.
That tells a very specific story.
This was not a market inviting participation.
This was a market escaping a price range .
The bullish breaker exists, but it was never mitigated . Price didn’t return to rebalance, didn’t test commitment, didn’t allow confirmation. That’s not accumulation — that’s urgency.
So even though the bias flipped bullish , the location never became tradable.
What followed was consolidation above the move — not inside it. That’s acceptance at higher prices, not demand being built below.
In other words:
Direction is clear
Intent is visible
Participation is missing
This is why I don’t confuse market intent with market opportunity .
Sometimes the market tells you:
“ I’m bullish — but you’re late. ”
And the correct response is not FOMO, not prediction, not forcing an entry —
it’s patience.
This chart stays on watch until price comes back to unfinished business , or until a new narrative forms.
This post is about location, behavior, and restraint — not a trade call.
— SmellyTaz
Decoding chaos
⚠️ This is not financial advice.

EURGBP – HTF Context Before EntriesBefore thinking about entries, I focus on what phase the market is in .
Step 1 – Finish the bearish campaign
Price completed a bearish HTF ABC sequence at C .
Until that C was reached, I had no reason to look for longs. Campaigns don’t flip mid-delivery.
Step 2 – Bias is allowed to change (not forced)
Only after the bearish sequence completed did price:
Sweep sell-side
Displace bullish
Shift structure
This is where a bullish breaker block was formed.
Step 3 – Define the only valid trade location
Inside that breaker sits a HTF (18H) FVG .
That PD array defines where long trades are allowed.
Not above it.
Not below it.
Only inside the breaker .
Step 4 – Expansion is not an entry
Price expanded impulsively from the breaker, printing a new bullish sequence and reaching short-term objectives.
This move confirms direction , but it does not complete delivery .
The HTF FVG remains unrebalanced.
Step 5 – Do nothing until delivery is complete
As long as price stays above the breaker without rebalancing the HTF PD array, there is no trade .
When (and only when) price returns into the breaker and rebalances the HTF FVG, I will drop to lower timeframes to look for:
Inducement
Structure shift
Clean delivery for execution
This post is about market phases and location , not prediction or signals.
Patience > precision.
Not financial advice. Educational purposes only.

A continued crash to $45k for Bitcoin? - December 2025Bitcoin has 5 days to stop the current candle body print under the 11 day 50SMA. Throughout the entire history of Bitcoin, a candle body close under this level has meant a test of the 11 day 200SMA. It is that simple. Never a false signal.
Here are all the historical data points:
50SMA on the 11 day chart throughout all Bitcoin history
At the moment the candle prints as a Gravestone DOJI.
Zoom in a little further to the 3 day chart and you can see price action follows the 200SMA. Does not matter what the asset is, anytime you see this, it is a sign of weakness. Look left. Regardless of asset, a complete collapse typically follows. Even if price action staggers like a drunken sailor finding his way back to port.
The idea " Is a Bitcoin crash to $40–45k next? – October 2025 " published around $120k made the break of market structure very clear. This idea is a continuation of the same break of structure. The spite continues to pour in for this idea. The market does not care.
Micheal Saylor's lenders will likely become very nervous should this continuation confirm. A forced liquidation of Strategy would be the best thing that could happen to the Bitcoin space in my opinion as the cash to pay out Dividends must come from somewhere, and that means selling Bitcoins. In an already depleted marketplace. Have noticed influencers gaslighting audiences with "Black rock" is buying your panic selling at this time posts.
Conclusions
Let’s not dress this up like a TED Talk. Bitcoin has five days to avoid doing the thing it has never once avoided in its entire history. That’s not drama, that’s statistics, the boring kind that ruins hopium.
A confirmed candle body close under the 11-day 50 SMA has always resulted in a test of the 11-day 200 SMA. No exceptions. No “yeah but this time BlackRock…”. No spiritual awakening mid-candle. Just gravity doing what gravity does.
At present, price is printing a gravestone DOJI. Which, despite the name is not a bullish candle, unless you’re a fan of irony or funerals.
The break of market structure was identified months ago near $120k, when optimism was peaking and common sense was being shouted down by people with laser eyes and affiliate links. Since then, price action has done exactly what broken structure does: grind, fail, and roll over.
A move toward $45k is not a prediction pulled from thin air, it’s a mechanical outcome if the current signal confirms. If that level is reached, it will be framed as a “black swan”, despite being broadcast loudly, publicly, and repeatedly in advance by yours truly.
As for the Saylor situation, leverage works both ways. Lenders get nervous. A forced seller in a thin market is never bullish, no matter how many times “BlackRock” is whispered like a protective spell. If this cascade happens, it won’t kill Bitcoin. It will do something far worse to the influencers: it will expose them. And frankly, that might be the healthiest thing this market has seen in years.
Ww
Disclaimer
==============================================================
This is not financial advice.
It is not a call to panic, sell the bottom, or tweet angrily at strangers. Markets can invalidate any thesis at any time. If price action reclaims structure and closes decisively back above key moving averages, this outlook changes. Loyalty to a chart after it’s wrong isn’t conviction, it’s just stubbornness with a Wi-Fi connection.
If you’re trading with leverage, emotion, or borrowed confidence from YouTube thumbnails, none of this will save you. If you’re trading probabilities, history, and structure, then this is simply the chart doing what it has always done, while people insist it won’t.

CADCHF LONG Market structure long on HTFs DW
Entry at Both Weekly and Daily AOi
Weekly Rejection at AOi
Previous Weekly Structure Point
Daily Rejection At AOi
Daily EMA retest
Previous Daily Structure Point
Around Psychological Level 0.57500
H4 Candlestick rejection
TP: WHO KNOWS!
Entry 100%
REMEMBER : Trading is a Game Of Probability
: Manage Your Risk
: Be Patient
: Every Moment Is Unique
: Rinse, Wash, Repeat!
: Christ is King.

NZDCAD SHORTMarket structure bearish on HTFs
Entry at Both Weekly and Daily AOi
Weekly Rejection at AOi
Previous Weekly Structure Point
Daily Rejection at AOi
Previous Daily Structure Retest
Daily EMA retest
Around Psychological Level 0.80000
Touching EMA H4
H4 Candlestick rejection
TP: WHO KNOWS!
Entry 105%
REMEMBER : Trading is a Game Of Probability
: Manage Your Risk
: Be Patient
: Every Moment Is Unique
: Rinse, Wash, Repeat!
: Christ is King.

GBPJPY - Bullish Continuation | Alignment in ProgressDaily Bias:
Bullish.
⸻
🔹 Higher-Timeframe Context (4H)
Strong bullish momentum remains intact.
Continuation to the upside is the primary expectation.
⸻
🔹 Mid-Term Setup (30M)
• Waiting for SSL to be taken
• Looking for delivery into a mid-term OB
• After mitigation, I’ll wait for confirmation, not assumption
Discount first. Execution later.
⸻
🔹 Lower-Timeframe Execution (5M)
Once the mid-term OB is mitigated:
• I’ll wait for a lower-high (LH) break
• Structure must confirm bullish intent
• Buy execution will follow the bullish leg, not the drawdown
⸻
🎯 Objectives
• 5M highs
• Higher-timeframe objectives
Until alignment completes — patience remains the edge.
⸻
🧠 Mindset Note
Continuation rewards discipline, not anticipation.
⸻
Let’s go.

Gold Context: Initiative Breakout & The ATH Magnet
COMEX:GC1! COMEX_MINI:MGCG2026 FOREXCOM:XAUUSD
Analysis
1. Market Context (The Transition)
The auction has successfully transitioned. What began as mechanical Short Covering has evolved into apparent Initiative Buying .
• Structure: The market is facilitating trade at higher prices, signaling that "New Money" (Innovators/Early Adopters) sees value here.
• Momentum: This is not just emotional momentum; it is structural. The migration of value suggests confidence in the breakout.
2. The ATH Approach (Nuance Required)
With the fundamental backdrop updated (Policy Divergence/Fed Pause) and year-end flows active, the auction is magnetically drawn to the All-Time High .
• The Probability: The path of least resistance is higher. We are likely to test the ATH limits soon.
• The Caution (Laggards): As we press into record highs, be aware of the "Diffusion of Information." We want to ensure the buying remains dominated by smart money, not Laggards chasing the move late. If the buying quality deteriorates (low volume breakouts), expect a sharp inventory adjustment.
Plan & Execution
• Bias: Long/Constructive.
• Invalidation: We need to hold acceptance above the recent breakout shelf (4300 area). A failure to hold would suggest the current participants were just "renting" the position, not owning it.
Talk to you for the next update.

AUDJPY - Bullish Continuation | Alignment WatchDaily Bias:
Bullish.
⸻
🔹 Higher-Timeframe Context (4H)
Strong bullish momentum remains intact.
Trend is clearly to the upside, so continuation is the primary focus.
⸻
🔹 Mid-Term Setup (30M)
• Waiting for SSL to be taken
• Once applied, I’ll look for full mitigation into the mid-term OB
• Area will be tested for acceptance, not assumed
Confirmation comes after delivery.
⸻
🔹 Lower-Timeframe Execution (5M)
Once the mid-term zone is mitigated:
• I’ll wait for a structural flip on LTF
• Direction must be confirmed by structure, not candles
• Only when all timeframes align will execution occur
⸻
🎯 Objectives
• 5M highs
• Mid-term highs
• HTF objectives
Until then — patience remains the edge.
⸻
🧠 Mindset Note
Alignment creates opportunity.
Execution is the reward for waiting.
⸻
🔔 Status
Monitoring and waiting.
Let the market invite the trade.
Let’s go.

USDJPY - Bullish Continuation | Alignment - Based ExecutionDaily Bias:
Bullish.
⸻
🔹 Higher-Timeframe Context (4H)
Strong highs were established, immediately shifting focus to continuation, not reversal.
HTF structure remains intact and supportive of higher prices.
⸻
🔹 Mid-Term Delivery (30M)
• Price took SSL, initiating drawdown
• Delivery fell into a refined mid-term OB
• Zone was respected cleanly over time
This confirmed price was seeking proper discount, not breaking bias.
⸻
🔹 Lower-Timeframe Execution (5M)
After mitigation of the mid-term OB:
• I waited for CHOCH / structural flip
• Lower high (LH) was broken, confirming bullish intent
• Engineered liquidity was then taken
• Price delivered into bullish OBs, supporting continuation
Execution followed structure, not impulse.
⸻
🎯 Trade Plan
I’m attending bullish continuations only.
Targets remain active until 5M highs are breached.
Until then — patience is the edge.
⸻
🧠 Mindset Note
Continuation trades aren’t rushed —
they’re allowed to mature.
⸻
📌 Update
I’ll be posting micro moves in my Minds later this week.
We stay active — let’s go.
