EURUSD - Bullish Bias with Tactical Short Setup• Pair: EURUSD
• Bias: Bullish overall | Tactical short into demand
• HTF Overview (4H):
• Bullish structure confirmed.
• Price took out SSL liquidity — likely draw is internal structure OB below.
• Expecting deeper pullback before continuation.
• MTF Refinement (30M):
• Looking for price to sell off into 4H OB.
• Price already mitigated 30M OB and rejected — watching for follow-through.
• LTF Confirmation (5M):
• Still in analysis mode — waiting on a CHoCH from 5M OB.
• Green lines on chart reflect 5M internal structure.
• Entry Zone:
• Enter short only after 5M shift confirms.
• Ride short into 4H OB demand zone.
• Targets:
• Short-term: 30M lows.
• Major: 4H OB for bullish reaction.
• Mindset Note:
• No rush to enter — analysis leads, execution follows.
• Let price deliver confirmation before switching to trader mode.
Bless Trading!
Multiple Time Frame Analysis

GBPUSD - Bullish Bias with Tactical Short Setup• Pair: GBPUSD (GU)
• Bias: Bullish overall | Tactical short for OB mitigation
• HTF Overview (4H):
• Price broke major highs — clear bullish intent.
• Pullback last week suggests price is targeting 4H SSL for liquidity + OB mitigation before further upside.
• MTF Refinement (30M):
• Price structure currently presents a temporary sell bias.
• BSL has been taken — confirming liquidity sweep.
• Eyeing price to run lower into 4H OB zone.
• LTF Confirmation (5M/1M):
• Waiting on LTF confirmation to ride the move down into the 4H OB.
•Only entering after analysis is complete and CHoCH shows cleanly.
• Entry Zone:
• Tactical short after LTF confirms.
• Final long setup expected from 4H OB after mitigation.
• Targets:
• 30M lows as short-term target.
• 4H OB as the major zone for potential bullish reversal.
• Mindset Note:
• It’s analysis before execution.
• Staying in sync with HTF logic while sniping intraday plays for precision entries.
Bless Trading!

USDJPY - Bullish Structure in Play• Pair: USDJPY (UJ) • Bias: Bullish • HTF Overview (4H): • Clean external break to the upside confirms bull control heading into the new week. • Structure shift is undeniable — market bias is now favoring continued strength.
• MTF Refinement (30M): • Zoomed in to the 30M and identified internal liquidity (SSL) taken out. • Strong mitigation of internal OB followed. • Still in analysis mode — no trades taken yet.
• LTF Confirmation (5M): • Waiting on a refined CHoCH (marked by green lines at highs). • Once that prints and rules align, I’ll shift into trader mode for the execution.
• Entry Zone: • 30M OB mitigation + LTF (5M) CHoCH confirmation.
• Mindset Note: • Patience is the play. No guessing, no hesitation — just clean reads and precision strikes. • Analysis first, execution second. That’s the system.
Bless Trading!

XAUUSD - Bullish OutlookPair: XAUUSD (Gold) Bias: Bullish HTF Overview (4H): Price has taken major liquidity and mitigated a strong order block. We’re now seeing internal breaks of structure forming to the upside, indicating momentum toward the next high around 3440.000.
MTF Refinement (30M – 45M): Refined bullish structure is forming on the 30M chart, with clear signs of continuation. I’m watching for a deeper mitigation into the 30M OB where LTF confirmations (5M and below) will validate entry. The 45M helps provide a broader structure perspective and context.
Entry Zone: Pending — awaiting mitigation into the 30M OB + lower timeframe confirmation (i.e., 5M LH break or refined CHoCH).
Mindset Note: Currently in analyst mode — preparing for execution only after structure respects the top-down narrative. No rushing. Let price come to me.
Bless Trading!

Bearish or bullish? Analysis:
Daily outlook:
- if market moves to to the daily key level, and make a short term bounce or sweep
will take longs setups
- if market moves sharply through the Daily key level, will look for short setups

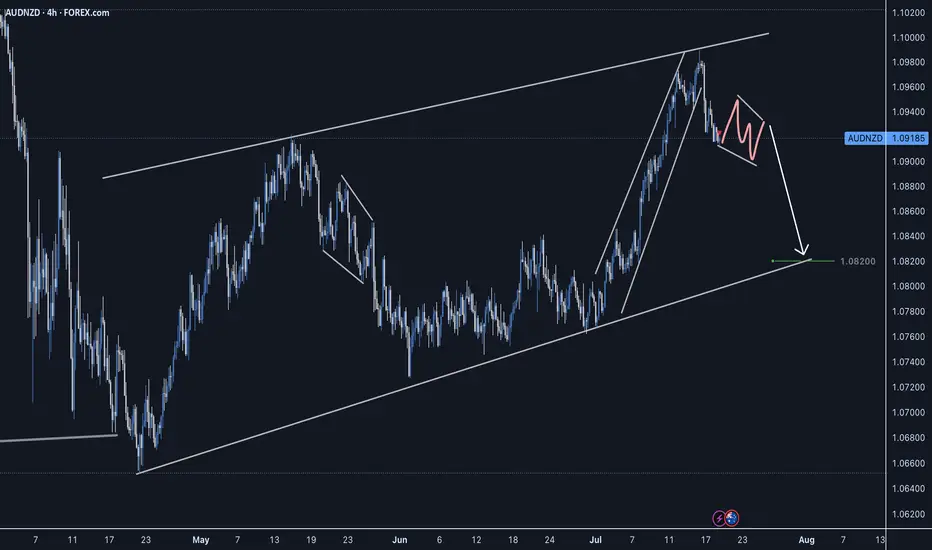
AUDNZD Short Setup - CAB EntrySellers stepping in, strong reversal impulse. Waiting for a slight correction before taking a short entry on the LTF.
Good Luck
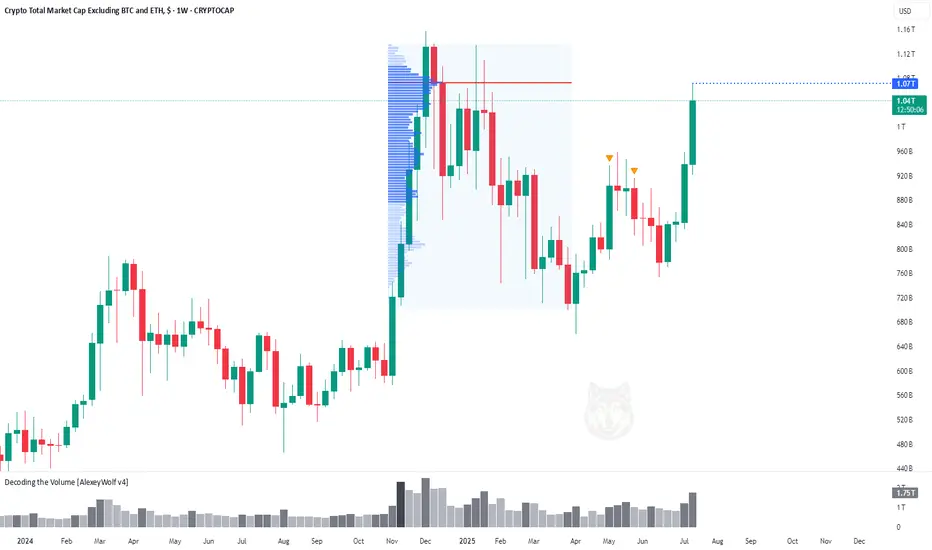
Altcoin Market Hits First Target at $1.07THi traders and investors!
The market capitalization of Total3 has reached $1.07 trillion, marking the first major target for the altcoin market.
This level corresponds to the Point of Control (POC) from the previous bullish rally and the subsequent correction — a key area of traded volume and market interest.
Several factors now suggest the potential for a continued move higher. On the fundamental side, the recent signing of a pro-crypto bill by Donald Trump has boosted overall sentiment in the digital asset space, especially among altcoins. From a technical perspective, many leading altcoins are showing bullish continuation patterns.
Wishing you profitable trades!
XRP Weekly ChartPrice made new ATHs on Friday went as high as $3.66, taking out the previous high at $3.39.
See if this week closes above, the monthly candle would give a stronger confirmation.
Anything could take price to $5+ or back down to $1.

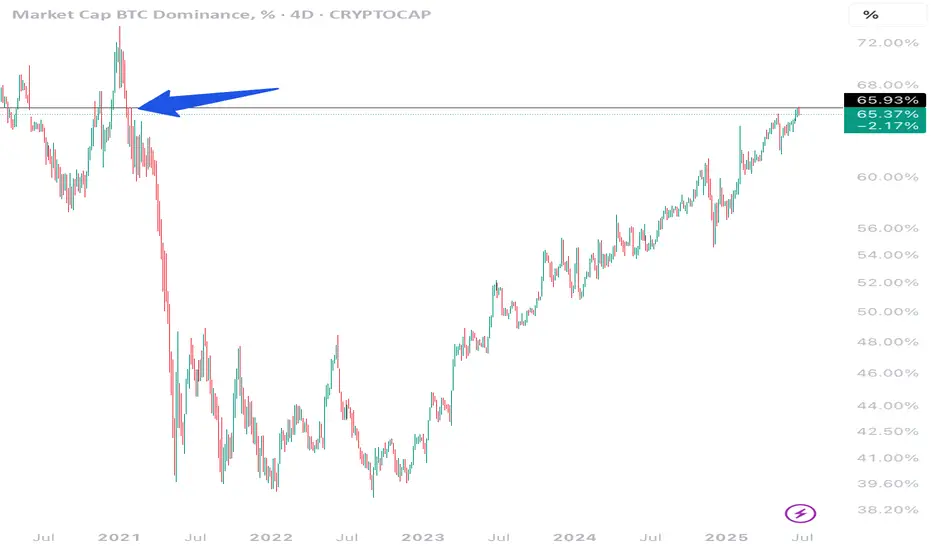
It's over for BTC Dominance, benjamin cowen is wrong hereAlt rally time :) . it will be incredibly hard to overcome this resistance on the chart. Don't listen to benjamin cowen at this point, he is too bullish on btc still. Cya in a few weeks when he changes his mind.
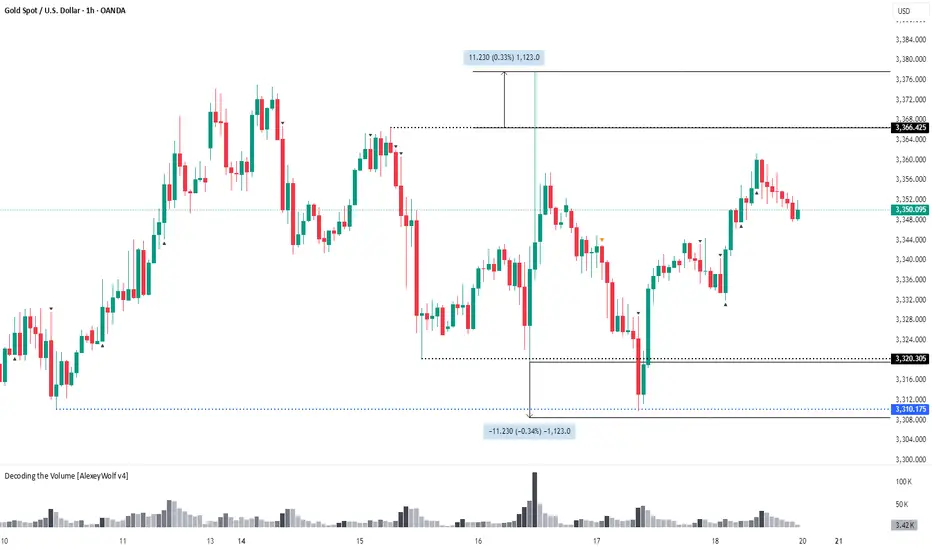
Gold. 3310 reaction & will Buyers reach their remaining targets?Hi traders and investors!
The 3310 level worked out perfectly. We can see a familiar buy pattern forming.
If the buyer fails to push the price higher and the seller returns to the 3310 level, it's likely that the price will continue to decline on the daily timeframe toward the next nearest targets — 3244, or more likely, 3154.
For now, however, we still expect the buyer to pursue the remaining unmet targets at 3393 and 3403.
This analysis is based on the Initiative Analysis concept (IA).
Wishing you profitable trades!
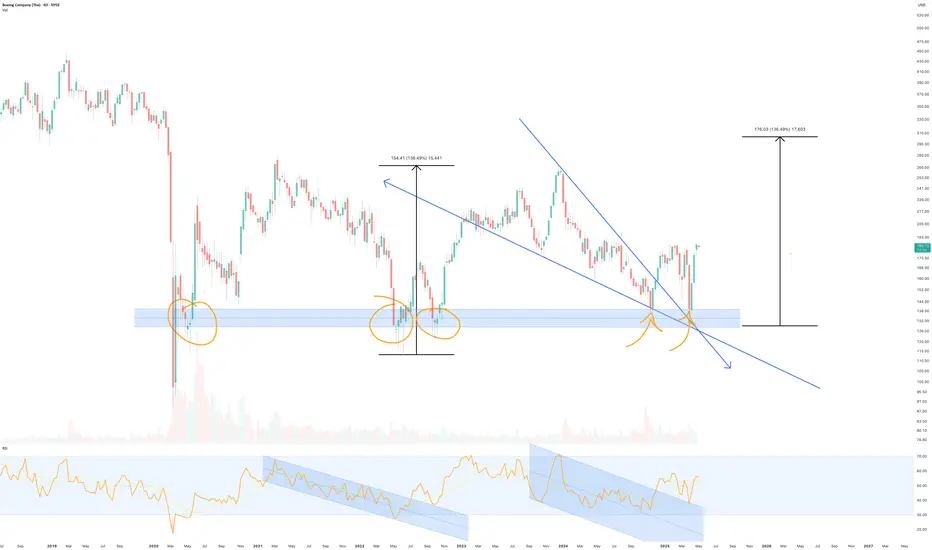
Boeing to $300 - Falling wedge** The year ahead **
On the above 6 day chart price action has corrected over 50% since December 2023. A number of reasons now favour a long position, they include:
1. Price action and RSI resistance breakouts.
2. Support on past resistance.
3. Double bottom on price action (yellow arrows)
4. Falling wedge breakout confirmation with forecast to $300 area
5. The Majority of other traders are bearish. Remember, trading has a high fail rate.
www.tradingview.com
Is it possible price continues to correct as others suggest? For sure.
Is it probable? No.
Ww
Type: Trade
Risk: <= 6% of Aerospace & Defence
Return: 60% from current levels
Stop loss: Will say elsewhere
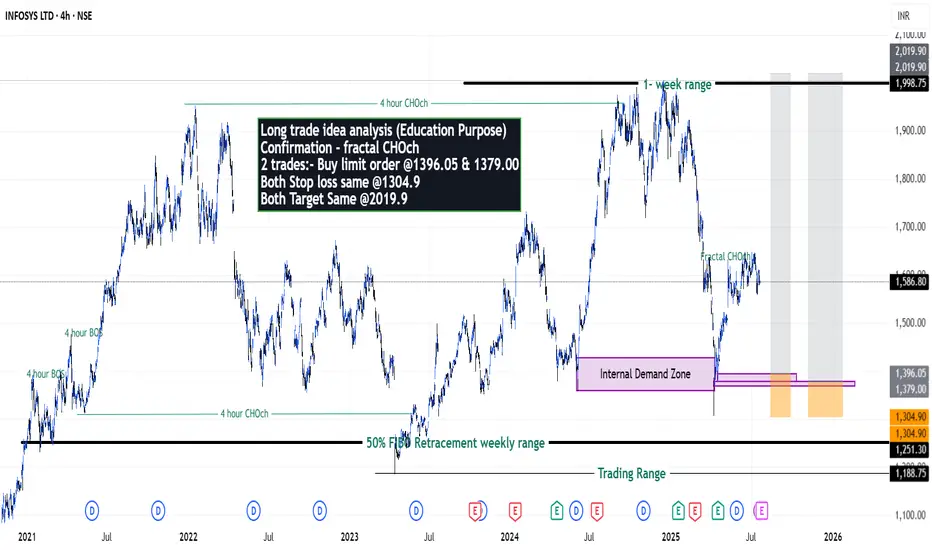
Infosys on getting ready for new high? - {20/07/2025}Educational Analysis says that Infosys (Indian Stock) may give trend Trading opportunities from this range, according to my technical analysis.
Broker - NA
So, my analysis is based on a top-down approach from weekly to trend range to internal trend range.
So my analysis comprises of two structures: 1) Break of structure on weekly range and 2) Trading Range to fill the remaining fair value gap
Let's see what this Stock brings to the table for us in the future.
DISCLAIMER:-
This is not an entry signal. THIS IS FOR EDUCATIONAL PURPOSES ONLY.
I HAVE NO CONCERNS WITH YOUR PROFITS OR LOSS on trades you take from my setup educated analysis.
My Analysis is:-
Short term trend may be go to the Internal demand zone.
Long term trend breaks the creates all time new high.
Long trade idea analysis (Education Purpose)
Confirmation - fractal CHOch
2 trades:- Buy limit order @1396.05 & 1379.00
Both Stop loss same @1304.9
Both Target Same @2019.9
Happy Trading,
Stocks & Commodities TradeAnalysis.
GBPJPYStrong daily resistance breakout, consolidated for almost 2 weeks and formed a bullish flag on the H4. Lets see what price does this week.

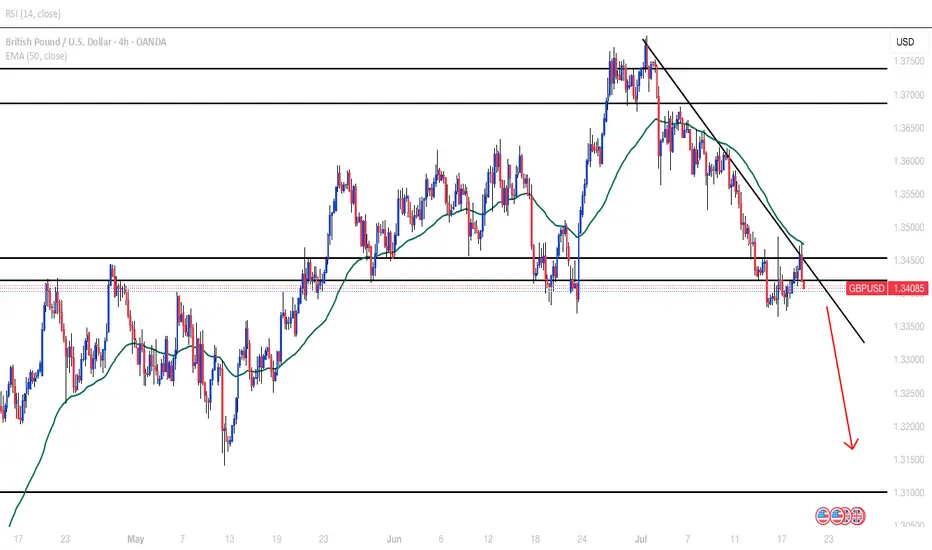
GBPUSD POSSIBLE TREND CHANGE?Reached a strong weekly resistance and pushed down. Broke daily/H4 support. Retesting zone with 50EMA rejection. Looking at 1.32500 as 1st target
USDJPY BUY CONTINUATIONBroke out of daily resistance zone, made retest of both zone and 50EMA. H1 has a minor resistance that needs a clear breakout before looking for buying signals.

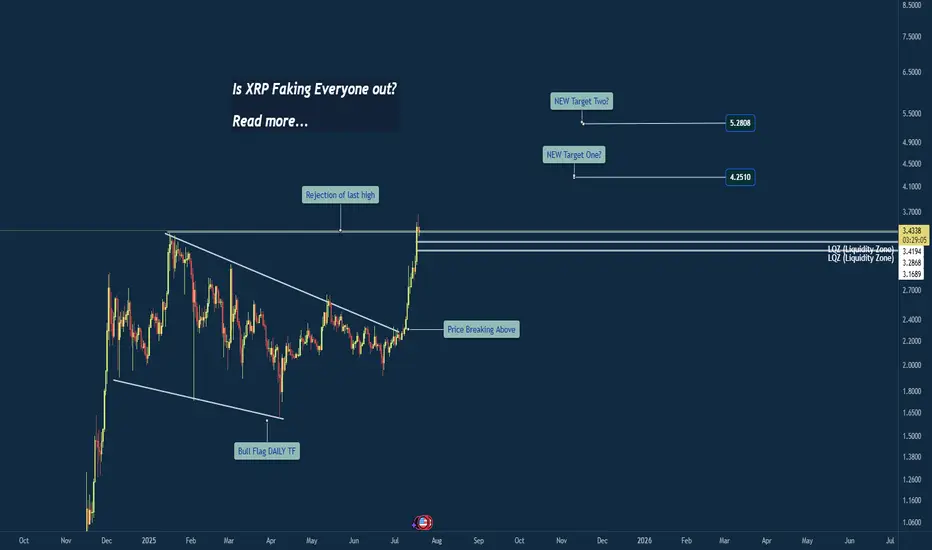
Breakout or Bull Trap? XRP at Critical Weekly LevelWeekly Chart Insight: XRP Closing Above Previous High
XRP has just closed above its previous weekly high—a significant development that could signal a shift in market sentiment. Historically, when price closes above such a critical level on the weekly timeframe, it often leads to continuation, unless a sharp rejection quickly follows.
At this stage, the focus shifts to the 4-hour timeframe for confirmation. An impulsive move above the current consolidation zone could indicate that this breakout is legitimate, potentially leading to another bullish weekly candle.
However, caution is warranted. If the next two daily candles close weakly or fail to maintain structure above the breakout level, it could hint at a fakeout or liquidity grab before a deeper correction.
My Current Bias:
I remain neutral-to-bullish, contingent on:
An impulsive continuation on the 4HR
Strong daily closes above the key range
Price not falling back and closing below the weekly breakout level
If price begins to consolidate and hold this level, that would reinforce the bullish case. But if we see immediate selling pressure and a re-entrance below the breakout, I’ll reconsider the bias based on developing structure.
Stock Index Weekly Analysis: ES, NQ, YMWeekly Targets (Gun to my head!)
- ES: Neutral
- NQ: Neutral
- YM: $44,186

FX Matrix: DXY, EUR/USD, GBP/USD Weekly AnalysisWeekly Targets: (Gun to my head)
DXY: 99.957, 100.424, 100.689
GBPUSD: 1.31643, 1.31453,

US10Y & T-BONDS Weekly AnalysisWeekly Targets:
- US10Y: 4.412%, 4.395%, 4.375%
- T-BONDS: 113.10, 113.16, 113.23


Gold LongsFollowing last weeks bias. Looking for REQH target.
Want to pair longs with a weekly profile. Ideally Monday or Tuesday creates the low of week. Will look to get onside with longs once theres a clear intraweek reversal. Trade the continuation higher. A close below 3320 is invalidation. Expecting previous week low to be protected and expansion to the upside

DXY LONG SETUP | Skyrocketinggggg
This is a bullish setup on the U.S. Dollar Index (DXY), taken from the 1H timeframe using Smart Money Concepts.
Price retraced into a clearly defined 1H demand zone where it also tapped a trendline support, creating a strong confluence +an LQC. The zone had internal liquidity swept and price mitigated a bullish order block, indicating potential institutional re-accumulation.
Entry was taken after bullish confirmation within the zone (engulfing candle), aligned with my SMC strategy which targets liquidity grabs and mitigation zones.
🔹 Entry: 98.06
🔹 SL: 97.83 (below the zone and structure)
🔹 TP: 99.11 (previous H1 high & clean supply zone)
🔹 RR: Approx. 4.5R
🔍 Technical Confluences:
Demand zone + OB mitigation + LQC
Trendline reaction (support respected)
Liquidity sweep + BOS (Break of Structure)
Clean imbalance above = fuel for price
Bullish engulfing as confirmation
📰 Fundamental Bias:
Today’s U.S. Jobless Claims came in better than expected, signaling labor market strength. Additionally, Retail Sales data was positive, reinforcing USD strength. These support a hawkish Fed narrative, aligning with our bullish technical setup.
Bias remains bullish unless price closes below 97.83 (invalidation level).

Pre-Market Prep 7.18.2025What it do, everyone! Here’s my pre-market prep for Friday, July 18th. Just to give you a quick overview, I'm using my prior value areas, the prior day's high and low, and the CVA levels from my market profile. I use all this history to help me plan my trades for the day.
So, starting with the S&P, as of now we’re green across the board. We’re in balance up from the prior day’s range, value area, and the CVA. My main plan is to look for acceptance and a pullback to a confluence area for longs. If we get rotational and break out of that area, I’m ready to go short.
For the NASDAQ, it's a similar story. We’re rotational in the prior value area and range, but we’re balanced up from the recent CVA. Right now, I’m waiting to see if we can confirm acceptance and then I’ll look for a short from that rotational area down to the prior value area low.
In the Russell, I’m seeing clear acceptance above all levels, so a pullback to the confluence area for a long would be ideal.
For Gold, I’m also seeing it in balance up on all fronts. My first move would be a long from the prior day’s high. If we drop a bit lower, I’ll be looking at that CVA and PVA area for another long.
The Euro is a bit more mixed. We’re rotational in the prior day’s range but balanced up in the value area and CVA. I want to clear the prior day’s high before taking any big moves.
The Yen is also rotational, so I’m looking to trade the extremes, maybe some scalps while we’re balanced in the prior value area.
For the Aussie Dollar, we’re in balance up from the PVA, but rotational in the prior day’s range and CVA. I’m looking for shorts near the top area and longs at the bottom, staying out of the middle for now.
And finally, Crude Oil is rotational on all fronts. My first plan is to look for shorts from the confluence area down to the prior day’s range.
That’s my pre-market prep for today. Let’s trade smart. Happy Friday, peace!
