USDJPYIntra-day sells to Demand zone where I'll be interested in buying till break of highs.
Manage risk
Multiple Time Frame Analysis

CADJPY D1From the higher TF pric3 looks bearish. The market is in a retracement phase. Expecting price to drop to 100.000 for a possible long entry.

AUDUSD is bearish in for a while!AUDUSD is bearish in 1-5min timeframe having met necessary conditions as explained in the image above.
Conditions:
1. Create a liquidity sweep on the highs and only then;
2. Break of structure on the swing low.

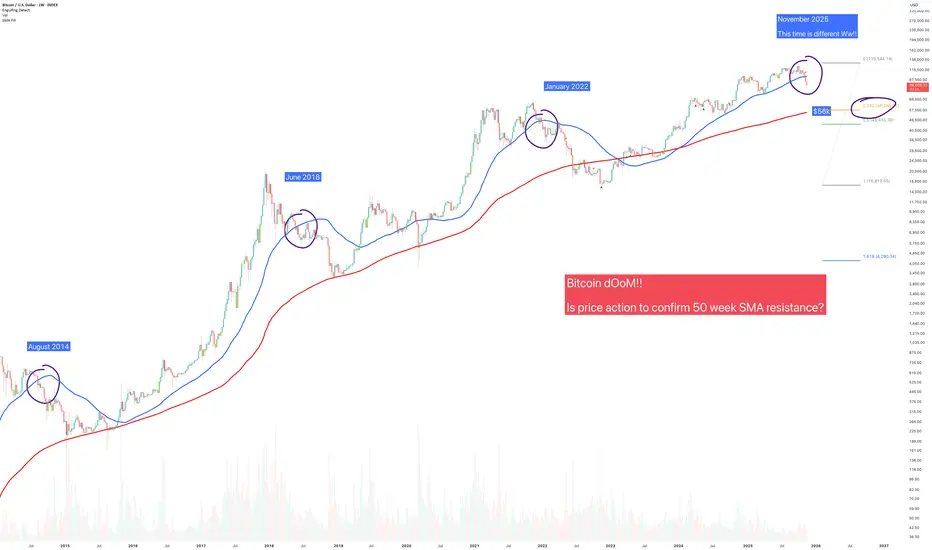
Is a crash to $56k about to occur for Bitcoin? - November 2025The above chart been brought to my attention by a number of folks asking for an opinion. So here it is.. remember, am just a messenger not target practice.
Price action shown on the above weekly chart has closed under the 50 week SMA, or so I’m told.
“Is that it? The top now in Ww?”
Look left, if you’re using two moving averages:
50 week SMA (blue)
200 week SMA
Then for you, the top is in. It’s over, go home. Congratulate yourself once again for providing exit liquidity for those that entered long positions at $15k. They have your everlasting thanks.
What's the hullabaloo?
Throughout the history of Bitcoin a test of the 200 weekly SMA occurred every time price action closed under the 50 week SMA. That’s not up for debate, it is a chart fact. Today that would be a highly predictable test of $56k, which is also the Fibonacci 0.38.
This forecast is going to upset a lot of people. The influencers promised them tales for fortune and glory. Instead.. they got a lesson in basic economics, but they had to pay $50,000 for it. You don't get refunds for stupidity, do ya?
Is this time different?
It is not possible to tell right now. Many might look at the chart and quit, they’ve had enough. That would be a mistake. Why? Confirmation.
Look left. Always look left. Until Monday 24th, November it is not known if the break of the 50 week is confirmed. Indeed if you take a closer look, price action has not actually closed a weekly candle body under the 50 week SMA, it has closed through it. That’s important.
Today
January 2022 Confirmation
June 2018 Confirmation
August 2014 Confirmation
Conclusions
So here we are again, Bitcoin teetering on the edge, influencers chanting “bull market!” like it’s a religion, and yet… there’s that nasty little blue line.
Price action under the 50-week SMA has never ended well. Not once. Every single time, without exception, it’s been followed by a cozy trip down to the 200-week SMA. Historically, that’s what Bitcoin does, it falls until it hits something red and expensive looking, then everyone acts surprised.
And where’s that level today? About $56k. Right on the Fibonacci 0.38. It’s like gravity with maths. But before you light the torches and start the “Ww’s turned bearish” posts, calm down. The candle hasn’t confirmed yet. That’s right, you’ve got until Monday, November 24th to find out if this is the real deal or just another fake-out designed to make you question every life decision since buying at $110k.
Look left. Every time price closed through the 50-week, the same story played out:
August 2014: crash.
June 2018: crash.
January 2022: crash.
It’s basically Bitcoin’s version of Groundhog Day, but without Bill Murray or the happy ending.
If it confirms below that line, that’s it. The 200-week SMA becomes the magnet.
If not, we’ll bounce, the influencers will return, and everyone will convince themselves they knew all along.
Either way, I’m not saying “doom.” I’m just saying, maths, it works.
Ww
Disclaimer
===============================================================
This isn’t financial advice. Obviously. If you’re taking investment cues from a bloke with a sense of humour about market collapses, you might want to re-evaluate your decision making process.
If you sell here and it pumps that’s on you.
If you hold and it dumps, that's also on you.
If you blame “market manipulation,” congratulations, you’ve just described every loser in crypto since 2017.
I don’t have a crystal ball, just charts and they don’t lie, even if people do. So whether Bitcoin crashes to $56k, or rallies to $160k, or starts taking payments in “Hopium,” I’ll still be here, tea in hand, smirking, watching the comments fill up with “You were wrong!” from people who were never right. Without Worries (Ww)
“Look left, not up.”
Long trade Buyside Trade
🟦 Trade Details
Pair: EURGBP
Date: Fri 28th Nov 2025
Session: LND to NY Session Overlap PM
Model Type: Buyside Trade
Timeframe: 15-minute (HTF narrative with LTF execution)
🟩 Entry & Levels
Entry: 0.87658
Profit Level (TP): 0.87950 (0.39%)
Stop Level (SL): 0.87487 (0.18%)
Risk-to-Reward (RR): 3.21
🟨 Trade Context
Price traded into a multi-day discount zone, forming accumulation behaviour at the low of the range. A mitigation of the prior bullish FVG aligned with the session low, creating the narrative for a LTF bullish rotation. Liquidity was swept below 0.87556, clearing sell-side pressure before displacement. Market structure on 15m showed MSS → BOS → bullish re-pricing before the entry zone was reached.
Timeframe: 2-minute
🟥 Execution Narrative
After the liquidity sweep, price created a clean bullish displacement candle breaking structure.
Entry taken on the FVG mitigation inside the premium of the internal LTF structure.
EMAs (fast & slow) crossed into bullish alignment, confirming trend shift.
Volume spike on the sweep validated institutional accumulation at the low of the cycle.
🟪 Sentiment & Narrative
Market was driven by algorithmic draw toward unmitigated inefficiencies above 0.8790 – 0.8810. Broader sentiment showed weakening GBP strength ahead of the NY session.
Price behaviour supported a transition from discount accumulation → expansion phase.
Session timing with the NY PM reversal profile.
🟫 Outcome
Trade Logic : Liquidity sweep → MSS → Displacement → FVG entry → Expansion.
The TP at 0.87950 - liquidity resting above the short-term high.

XAU/USD 01 December 2025 Intraday AnalysisH4 Analysis:
-> Swing: Bullish.
-> Internal: Bullish.
Analysis and bias remains the same as analysis dated 20 October 2025.
Price has printed as per previous intraday expectation by printing a bearish CHoCH which indicates, but not confirms, bullish pullback phase initiation.
Price is currently trading within an established internal range, however, I will continue to monitor price with regards to depth of pullback.
Intraday expectation:
Price to continue bearish, react at either discount of 50% internal EQ, or H4 supply zone before targeting weak internal high priced at 4,380.990.
Note:
The Federal Reserve’s sustained dovish stance, coupled with ongoing geopolitical uncertainties, is likely to prolong heightened volatility in the gold market. Given this elevated risk environment, traders should exercise caution and recalibrate risk management strategies to navigate potential price fluctuations effectively.
Additionally, gold pricing remains sensitive to broader macroeconomic developments, including policy decisions under President Trump. Shifts in geopolitical strategy and economic directives could further amplify uncertainty, contributing to market repricing dynamics.
H4 Chart:
M15 Analysis:
-> Swing: Bullish.
-> Internal: Bullish.
Price has printed as per analysis dated 14 November 2025 where I mentioned price to trade down to either discount of 50% internal EQ, or M15 demand zone before targeting weak internal high, priced at 4,245.195.
Price has subsequently printed a bearish CHoCH.
We are currently trading within an established internal range, however, I will continue to monitor price with respect to depth of pullback.
Intraday expectation:
Price to trade down to either discount of 50% internal EQ, or M15 demand zone before targeting weak internal high, priced at 4,256.250.
Note:
Gold remains highly volatile amid the Federal Reserve's continued dovish stance, persistent and escalating geopolitical uncertainties. Traders should implement robust risk management strategies and remain vigilant, as price swings may become more pronounced in this elevated volatility environment.
Additionally, President Trump’s tariff announcements, particularly against China, are expected to further amplify market turbulence, potentially triggering sharp price fluctuations and whipsaws.
M15 Chart:

USD/CAD - USD on it's way to recover against CADFrom a fundamental perspective, the Canadian Dollar remains under pressure from its stronger counterpart, the USD. With ongoing geopolitical tensions between the two neighbouring countries, I expect the USD to continue gaining ground against the CAD.
From a technical perspective, the higher-timeframe (daily) chart shows a consistent respect of demand zones — each time liquidity was taken, price reacted cleanly inside demand. We’re seeing the same scenario now: price is retracing toward a 4H demand zone, sweeping the liquidity resting above it. At this stage, we want to see buyers stepping in to defend their positions.
On the lower timeframes, price is being squeezed after the drop from the last lower high, which failed to break previous structure. In my view, this offers a solid opportunity for long positions, especially since the current higher low remains protected. However, if this zone gets invalidated, the entire idea becomes invalid.
There is no clear bearish order flow, even on the LTFs — only a simple price drop followed by early signs of consolidation. Once the fractal structure turns bullish on the 4H chart, I’ll have even more confidence to extend risk and scale into the position.
From a fundamental standpoint, we’re all aware of the expected December rate cuts. A 0.25% cut from the Fed would not be a surprise — the real surprise would be if they didn’t cut, and how future policy would shift. In my opinion, the market is already pricing this in.
Make sure to follow for more analysis in the future.

NZD/USD - A market that is too bearish to consider buysFor me personally, i will just skip the fact that the most recent price action was bullish just because if i zoom out the chart, the price was everytime reacting from the most highest supply.
Right now, price just entered inside the supply zone from the bearish orderflow (daily chart), took liquidity and just waiting for any kind of reaction to sell this market to a new LL.

Short trade
📕 Sell-Side Trade
🟦 Trade Details
Pair: AUDJPY
Date: Sun 30th Nov 2025
Session: Tokyo Session PM
Model Type: Sell-Side Trade
Timeframe: 1-Hour (HTF execution context)
🟥 Entry & Levels
Entry: 102.021
Profit Level (TP): 101.487 (0.53%)
Stop Level (SL): 102.187 (0.16%)
Risk-to-Reward (RR): 3.52
🟨 Trade Context
Price reached a premium zone after a multi-session rally and tapped into previous HTF liquidity, aligning with the 0.382–0.618 Fib retracement cluster. The rally into 102.27 – 102.36 swept equal highs and interacted with a bearish FVG, building strong reversal structure. Price rejected the Daily Open and failed to maintain structure above the premium inefficiency.
Liquidity was engineered above 102.25 before displacement.
🟩 Execution Narrative
A clear Market Structure Shift (MSS) occurred after price swept the high. Strong downside displacement delivered a full break of the 1H structure, novating to bearish order flow.
Entry was taken inside a bearish FVG on the 1H mitigation point, aligned with falling EMA/WMA confluence. The bearish rejection wick confirmed institutional activity at the premium.
🟪 Sentiment & Narrative
Macro sentiment supports a short-term retracement after an extended bullish leg.
AUDJPY reached an exhaustion zone and we assume a corrective move back into discount. The inefficiency pocket below 101.65 acts as a draw on liquidity.
🟫 Outcome
Trade in session
Sell-side logic:
Liquidity sweep → MSS → FVG mitigation → Displacement continuation.

Long trade 📘 Buyside Trade
🟦 Trade Details
Pair: EURUSD
Date: Fri 28th Nov 2025
Session: LND to NY Overlap AM
Model Type: Buyside Trade
Timeframe: 2-min (Entry execution zone)
🟩 Entry & Levels
Entry: 1.15641
Profit Level (TP): 1.16139 (0.38%)
Stop Level (SL): 1.15427 (0.46%)
Risk-to-Reward (RR): 5.89
🟨 Trade Context
Price dipped into the discount demand zone created on the previous session.
The 0.382 – 0.618 Fibonacci retracement aligned with the demand array and prior displacement.
Price swept the intraday low into a 2-min bullish FVG, reclaiming the Daily Open afterwards. Clear shift in structure (CHoCH → BOS) confirmed bullish order flow before the entry.
EMA & WMA alignment turned bullish just before execution.
🟥 Execution Narrative
Liquidity was taken below the low at 1.1547.
Price delivered an impulsive rally into a bullish FVG.
Entry placed on the mitigation of the FVG / rejection of demand.
Volume spike confirmed institutional activity.
Target selection was the 1.16139 liquidity pocket, sitting above the intraday swing.
🟪 Sentiment & Narrative
NY session fuel assisted expansion.
Macro intraday sentiment was bullish, supported by:
Premium inefficiencies above
Bullish displacement leading into the London retracement
Algorithmic draw toward the mid-session liquidity cluster
🟫 Outcome: Trade in session

December BTC overviewBTC closed November sweeping and reclaiming the weekly 100 EMA, and although the daily chart printed a strong reversal candle, it is still too early to call a bottom.
The broader bearish structure on both the weekly and daily remains intact, and volume aligns with the downtrend. On the daily, we also have the 100 and 200 EMA bearish crossover, which confirms a strong HTF bearish trend.
In bearish markets, it is uncommon to leave an FVG unfilled unless the trend is very strong. Even though November closed above the 100 EMA, it was still a heavy bearish close that broke the monthly bullish trendline.
If we hit 100K, it would imply a 20K rally after a 40K drop with no real consolidation or accumulation. That would be wild. It is possible but very unlikely. This currently looks like the unwind of a multi-day distribution that likely started in July. The market needs a proper multi-day accumulation.
We also need to consider that we are fading the high return season, which adds more weight to the distribution thesis.
My expectation for December is range-bound price action and a close near the yearly open.
On low timeframes, there is a clean short opportunity at the bearish order block around 95K to 97K, sitting above yearly-open liquidity.
If price returns to the lows, we also have a potential monthly double-bottom setup targeting the yearly open.
There is a daily bullish MSB waiting at 97K. If price reaches it, we may start holding above the yearly open and squeeze toward the daily 200 EMA. From there, the monthly and weekly trendline could act as resistance and push price back to the lows, which is a common retest pattern after a strong trendline break.

Week 48 Market Update — $SPXStrong week for the SP:SPX index. After two weeks of hesitation candles, price finally shifted back into strength and pushed decisively higher. This week’s candle not only reclaimed momentum but fully erased last week’s cooling-off behavior.
Price also moved well above the key mid-range levels that traders usually watch to define trend health. It’s now sitting firmly above the major risk zone and continues building distance away from it — a clear sign of strength. From the moment this week’s upside break triggered, the index has gained roughly 1.9%, and that kind of move typically translates into solid returns for options traders playing directional setups.
Major support zones sit lower around 5900, 5100, and the deeper structural support near 4000. As long as price holds above the upper layers of support, momentum remains intact.
On the higher-timeframe monthly chart, the trend has been active for eight straight months with no signs of exhaustion. Price is still far above the level where the monthly trend began, and even further above the long-term midline — showing how dominant the larger trend still is.
The 2-day chart continues to support the overall bullish structure, breaking above short-term levels and maintaining strength after multiple confirmations earlier in the week.
This week was a clean continuation of the broader uptrend — strong candle, strong momentum, and strong positioning above every major structural region.
Elite clarity. Elite precision. More coming soon.

EUR/JPY - A countertrend a day keeps the losing streak awayEUR/JPY currentlly is resting inside the internal move that started from the most recent HH formed.
As a swing view, EUR/JPY is in a clear uptrend, making LH and HH with a beautifull bullish orderflow conection.
At least for now, we accumulated a lot of liquidity inside this move to the upside, leaving behind us a trendline liquidity ready to get caught as a trap. From the most apropiate supply zone, I am expecting that the price will react to downside.

EUR/NZD - Ready to catch a fallinng knife?Hello traders,
Righht now, we see on EUR/NZD a really nice drop of the price, but if we zoom out the picture, we just entered the demand zone on HTF and we are squizing inside a wedge.
For me, it would be interesting to see a HL forming inside this demand zone and wait for some confirmation that we can boost the price higher, and profit ourselfs going long in this market.
Also, considering the fact that on LTF the drop itself is overextended, even if it would want to continue more to the downside, than it will have to retrace to the most current supply zone.
For more analyses, follow me.

S&P 500: two false breakouts and signs of slowing momentumThe bullish scenario is still valid, but the market shows signs of exhaustion and a potential correction.
This analysis is based on the Initiative Analysis (IA) method.
Hello traders and investors!
On the weekly timeframe, the S&P 500 remains in a sideways range that has been forming since October.
The initiative is held by the buyers.
Upside targets:
First target: 6,883
Second target: a new ATH
Key observations inside the range
Two buyer-driven false breakouts (level manipulations).
Within this sideways structure, two clear false-breakout patterns have formed — both caused by buyers:
October 6 — manipulation around 6,580: A volume-backed attack by sellers → followed by buyer absorption → followed by a new ATH.
Manipulation around 6,637: A similar structure: strong seller attack → buyer absorption.
This pattern suggests that another ATH update is likely.
Signs of a potential pause or correction
The highest weekly volume in six months.
During the week of November 17, the index printed its largest weekly volume since April.
For a weekly timeframe, this is a meaningful signal — clear seller interest around current prices.
It is also possible that traders and funds are adding hedges in anticipation of a deeper correction.
A change in buyer behavior.
Looking at the entire move since May:
during the uptrend, no manipulations occurred — buyers simply pushed the price higher;
now, two manipulations inside a single range have already appeared, suggesting that buyers are finding it harder to push the market upward.
This is the second sign of potential momentum exhaustion.
Trading conclusions
Short-term (intraday):
Trades can be taken in both directions — the market is in a range, and both boundaries can be worked.
The daily timeframe also remains in a sideways structure.
Long-term (swing/position):
If positions are not for hedging, entries should be taken with caution.
Inside the range:
longs make sense when buyers defend the lower boundary,
shorts — when sellers defend the upper boundary.
Wishing you profitable trades!

EURUSD and GBUSD market recapAt this moment are so many contradictions that ma fight might start :))
I am avoiding to trade those parities right now. In side the vide you can see easily the lvls i am looking at but

Internal vs External Liquidity: The Skill Nobody Actually MasterMost traders think they understand liquidity…
They mark equal highs, equal lows, and call it a day.
But let me tell you something real:
Knowing liquidity exists is NOT the skill.
Knowing WHICH liquidity matters right now is the real edge.
That’s the difference between:
✔ catching continuations
✔ catching reversals
✔ avoiding trap entries
✔ timing precision entries
✔ and actually staying in profitable moves
Most traders lose because they don’t understand the hierarchy of liquidity.
Let me break this down the way nobody online does:
⸻
🔥 1. Internal Liquidity = Fuel for Continuation
This is the liquidity inside the active range.
It sits between swing points, inside consolidation, above minor highs, below short-term lows.
Internal liquidity gets taken when:
• Market is in trend
• Price is compressing
• Price is building inducement
• Algorithms are collecting “fuel” before delivery
When internal gets swept, DO NOT expect a reversal.
Expect a continuation into the next external pool.
This is why most traders get faked out:
They see a sweep and scream “reversal!”
But they’re reacting to internal liquidity — not the real turning point.
⸻
🔥🔥 2. External Liquidity = The Real Reversal Zones
External liquidity sits at the RANGE BOUNDARIES:
• The major swing high
• The major swing low
• The extreme points of the structure
These are the levels that actually SHIFT trend, cause deep pullbacks, or start major legs.
This is where smart money:
✔ Clears the crowd
✔ Triggers stops
✔ Closes positions
✔ Repositions
✔ Begins delivery in the opposite direction
External liquidity is the turning point.
Internal liquidity is just the build-up.
If you can’t distinguish the two, every reversal will feel random to you.
⸻
🔥🔥🔥 3. Here’s the Rule Nobody Teaches:
If price sweeps internal → expect continuation.
If price sweeps external → expect correction or reversal.
But here’s where MOST traders fail:
They don’t know which one they’re looking at.
If you think a reversal is starting but you’re still inside the range…
You’re not trading a reversal.
You’re trading hopium.
⸻
🔥🔥🔥🔥 4. How Smart Money Chooses Which Liquidity to Target First
This is where your real edge comes in.
Smart money asks ONE question:
“Which pool unlocks the next delivery path?”
If the next objective is above → they’ll sweep internal lows to build power.
If the next objective is below → they’ll sweep internal highs to induce buyers.
Smart money is always targeting what unlocks:
✨ the cleanest path
✨ the imbalanced leg
✨ the untouched zone
✨ the unmitigated order block
✨ the next HTF objective
You think the sweep is the entry.
They see the sweep as the setup.
⸻
🔥🔥🔥🔥🔥 5. Here’s the TRUTH:
Internal liquidity fuels the move.
External liquidity flips the move.
If you master this one skill, your whole trading shifts.
Your confidence shifts.
Your timing shifts.
Your strike rate shifts.
You stop chasing noise.
You stop guessing bottoms.
You stop guessing tops.
You start reading intention — not reacting to candles.
Most of the trading world knows liquidity.
Almost nobody knows when liquidity actually matters.
That’s the part the textbooks don’t teach.
That’s the part the YouTubers don’t show.
That’s why most traders stay confused for years.
Internal liquidity gets you in —
External liquidity gets you paid.
Master the difference and you’ll trade with precision most people only dream of.

GBPJPY - Bullish Outlook | Tracking the Next DeliveryHigh Timeframe (HTF):
GBPJPY remains bullish, breaking major external highs with strong upside intent.
No HTF sweep, no HTF OB mitigation — just straight continuation, currently sitting in premium territory and pausing.
⸻
Mid-Term View (MTF):
Structure remains bullish as we apply continuation logic.
At this stage, price is seeking liquidity — I want to see SSL taken and a mitigation into the mid-term OB.
Once that happens, I’ll watch for confirmation to engage.
⸻
Lower Timeframe (LTF):
If the LTF gives a clean CHoCH / flip, that’s my cue.
From there, I’ll be taking buy points inside the bullish leg, following the flow of smart money and targeting the next set of highs.

NZDUSD- Bearish Framework with Bullish Reversal PotentialHigh Timeframe (HTF):
HTF is bearish, breaking significant lows and showing clear downside intent.
⸻
Mid-Term Perspective (MTF):
Price took the IDM and failed to hold the internal OB continuation zone.
Instead, it pushed deeper, taking HTF liquidity and tapping the internal imbalance / reaction area beneath it.
At this stage, I’m waiting for a full mid-term CHoCH.
Once that confirms, alignment shifts.
⸻
The Setup I Want:
After the mid-term CHoCH:
• I want a sweep of fresh BSL
• Price must tap into my mid-term OB
• Mitigation must be clean and displacement must be present
Only then do I drop down into the LTF.
⸻
Lower Timeframe (LTF):
Once the LTF prints the bullish flip / micro CHoCH,
I’ll place sell points inside the new bearish leg and target the next liquidity pockets above.
⸻
Mindset / Execution:
• HTF bearish → waiting for mid-term shift
• Liquidity → CHoCH → OB → LTF confirmation
• No rushing the transition
• Tracking > predicting

AUDJPY| Bullish Outlook | Tracking Smart MoneyHigh Timeframe (HTF):
AUDJPY remains bullish, showing strong upward structure and continuation potential.
Price has been carefully tracked to follow the dominant trend and liquidity flow.
⸻
Mid-Term View (MTF):
Price swept sell-side liquidity and fell into the mid-term order block, creating a clean inducement.
We monitored for continuation setups within the mid-term perspective, confirming that bullish momentum is intact.
⸻
Lower Timeframe (LTF):
Dropping down to lower frames:
• We spotted a CHoCH / trend change, flipping bearish into bullish
• Bullish formations aligned perfectly
• Two continuation setups were caught toward the mid-term highs
Once those highs are taken out and objectives completed, the map will be ready for the next leg.
⸻
Mindset / Strategy:
• Tracking price is key
• Let Smart Money lead
• Patience ensures clean execution
• Alignment across HTF → MTF → LTF confirms validity before committing

Previous Target Achieved. What now?
Crash & I have a New Setup🤑
The previous target was hit just as expected. It almost did at least. Profits are booked. Now let's look at a new setup. This time, the target would still be the same. Good luck!
#ETH #ETHEREUM #CRYPTOCURRENCY #TRADINGVIEW #TechnicalAnalysis #ToTheMoon
🚀 BINANCE:ETHUSDT to Reach $5K
> ATH Breakout: A sustained move above the $4,891 previous All-Time High is the final hurdle. Clearing this resistance puts ETH into price discovery, making $5,000 the immediate psychological and measured target.
> Deflationary Supply: Net negative ETH issuance (due to fee burning/EIP-1559 and staking rewards) continuously shrinks the circulating supply. This persistent supply shock is a major fundamental driver for upward price pressure.
> Long-Term Pattern: Confirmation of a breakout from a major multi-year structure (like an ascending channel or bull pennant) on high timeframes projects significant measured moves, often validating $5,000 as a logical next step.
And that's it!
#ETH #ETHEREUM #CRYPTOCURRENCY #TRADINGVIEW #TechnicalAnalysis #ToTheMoon

USDCHF- Bullish Outlook| Tracking Smart MoneyHigh Timeframe (HTF):
USDCHF remains bullish, with strong corrective moves.
• Price swept SSL and fell into a major external OB.
• Continuation is expected as price seeks liquidity and maintains HTF bullish intent.
⸻
Mid-Term View (MTF):
The mid-term OB has been fully mitigated, confirming bullish structure.
Price swept liquidity and completed the trap, validating the continuation setup.
⸻
Lower Timeframe (LTF):
Price has given a CHoCH / bullish flip, printing clear bullish structure.
Currently, price is aligned and holding, waiting for delivery.
⸻
Mindset / Strategy:
• Track price, follow Smart Money footprints
• Patience is key — waiting for clean continuation before committing
• Alignment across HTF → MTF → LTF ensures proper confirmation

EICHER MOTORS Looking good here EICHER MOTORS Looking good here
Sector Strong
Stock is in monthly FVG
Daily FVG Displacement
Hourly RB with LRLR
wait for RB ce levels for entry (can take confirmation on 5tf)
