$MTL Reached first target at 7.8k Sats (30% since entry)$MTL Reached first target at 7.8k Sats (30% since UCTS Buy signal)...
Rejection not being too strong, neither sell volume...
RSI rejected at overbought levels aswell.
if it manages to break above resistance and flip it we will reach new local highs with 1st target 9k sats.
#MTL
MTL

Time to buy soon $MTLMake sure to place some optimistic bets for this coin because the whales cant seem to control the pumps

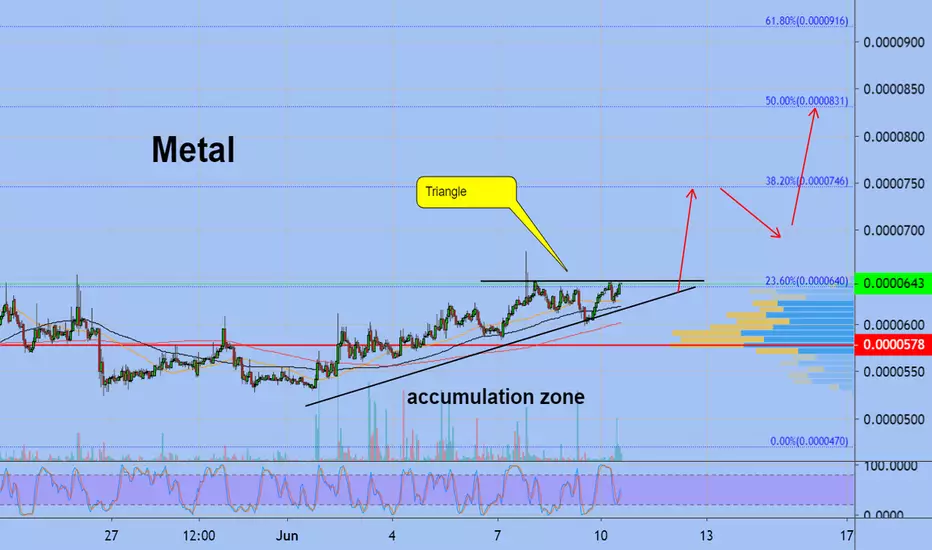
Metal signal by EXCAVOMTLBTC look like rocket. You can see accumulation zone. Formed billish triangle
RSI- oversold
We need just wait little
MTL UPDATE : Breaking For More Profits.#MTL_Update
#MTL looking very good for our 100% fib level breakout towards 7540 sats breaking our from the current triangle.
We will update more or on it.

Metal (MTLBTC) Prepares For Another Run (220% Or More Possible)Metal (MTLBTC) is another altcoin that we traded in the past with great results. Our last public trade generated for our readers and followers over 100% profits, and we believe Metal can move again and do even more this time.
Here you can find our latest public trade (great results):
Right now we are looking at:
New all-time low (on Binance)
Long term bullish divergence.
The RSI hit oversold and is now trending up.
We believe there is plenty of room for growth.
Thanks a lot for reading and your support.
Namaste.
This is not financial advice.
All the information shared here on this channel, and/or by Alan Masters, is intended for educational and entertainment purposes only.

Metal/Bitcoin (29 May) #MTL $MTL #BTC $BTC#BUY #WAIT
Current Price : 553
Buyzone : Buy close to 500 as possible
Sellzone : 600-900
Stoploss : Below 450

Daily Bullish Signal $MTL #MTL #MTLBTC #BTC $BTC (3 May)RED ARROW indicates the EXPECTED Time and Targets
Level Stoploss point up to maximize profit and reduce risk
I'm working all the time, even in Bearish Market
======================
My path doesn't seem like anyone. I'm like a MONK, always studying to find the direction that prices will follow. I will feel very comfortable if the price goes exactly in the direction I drew. I will always try and practice until PERFECTION is MY OWN


MTL-BTC Long Trade PlanCommodity : METAL
Trade Type : LONG
Trading Against : BITCOIN
Entries : Double-UP Entries throughout the Buy Zone
Profit Taking : 25% at each TP point.
Profit Locking : Move SL to break even once TP1 is hit, to TP1 once TP2 hits, to TP2 once TP3 hits and so on
Duration - 2-4 weeks
Investment in trade : 5% of the total Trading Balance.
Prospective Profit : 14% to 63%
Prospective Loss : 19%
RRR : Between 0.75 and 3.24 depending on TPs
Buy Zone/TPs/SL price points are marked in the chart as follows
Greens - Profit Targets (TPs)
Blue - Buy Zone (Entries)
Red - Stop Loss (SL)

Daily Bullish Signal $MTL $MTL #MTLBTC $BTC #BTC (17 April)RED ARROW indicates the EXPECTED Time and Targets
Level Stoploss point up to maximize profit and reduce risk
I'm working all the time, even in Bearish Market
======================
My path doesn't seem like anyone. I'm like a MONK, always studying to find the direction that prices will follow. I will feel very comfortable if the price goes exactly in the direction I drew. I will always try and practice until PERFECTION is MY OWN

MTL LONG (Bullish Gartley)MTL Bullish Gartley Potential Reversal Zone.
Short term targets (38.20% and 61.80% of D low to A high) for a type I or a type II reversal and stop loss (100% of XA) identified. I am bullish mid term.
Good trade and good luck everyone.
Zakaidze Omar

MTLBTC - LongFalling wedge forming on 1hr chart..
Let's see what will happen..
Keep an eye on BTC movement..


$MTL Reached a strong support zone at ~1005sats$MTL Reached a strong support zone at ~1005sats
This could be a good entry level IF (BIG IF) we found in the upcoming days signals of bounce/hodl of this level
Volume decreasing (could be exhaustion on the bearish side)
Both EMA50/100 could act as support too
Set alerts & ⏳
#MTL


MTL/BTC - ready for big gains?MTL/BTC looks to be in a good potential buy area with a tight s/l.
Target 1: 0.0001640
Blue triangle indicates the current range. Anything falling outside of the triangle is considered a breakout.
Green box is buy.
Green line indicates t/p.
This is not financial advice. All charts shown on my page, including this one, are just for fun.
If you enjoy my ideas please give this post a like and follow my page if you would like to see future posts! :)


Metal or Gold ?Hello all.
Using a pitchfork with Ichimoku give us some targets for MTL. Enjoy this ride up and fill your bags with money.

