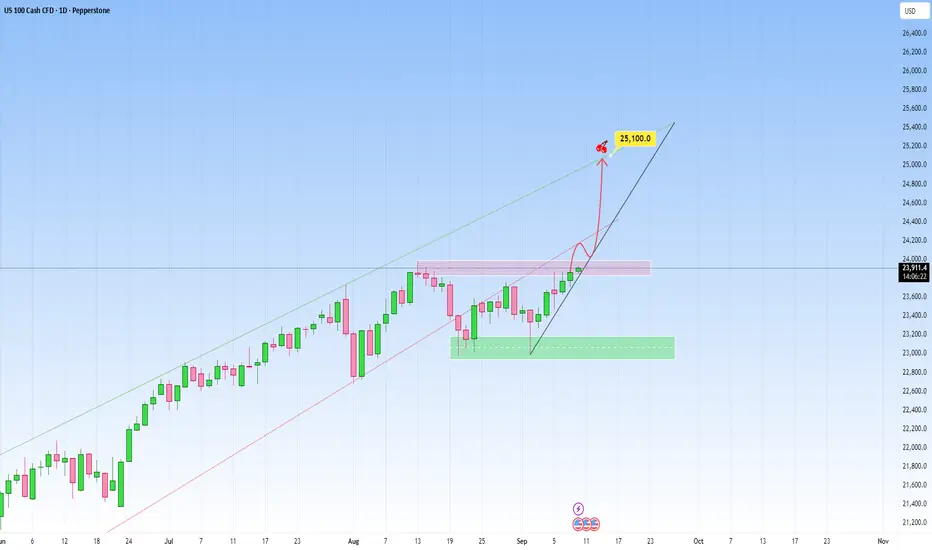
NAS100 Outlook: Recent rise has been steady!Market context on NAS100 remains bullish clearly. The most recent move saw a steady recovery, heading towards the upper boundary of the newly projected channel. And this right here is another great opportunity to get involved.
The market is likely in the early stages of a new impulsive leg to the upside right here.
We could also have short-term consolidation or pullback, then a continuation toward the upper boundary but I believe the latter is more plausible.
My target will be at 25,100.
NASDAQ 100 CFD
NASDAQ100 HIGH PROBABILITY SETUP SOON!!!🚨 NAS100 HIGH PROBABILITY SELL SETUP 🚨
* Here We Can See Clearly The Next Potential Move For US100 Coming Hours/Days.
* Keep Your Eyes Close On Your Trading Positions.
* Happy PIP Hunting Traders.
FXKILLA.

NAS100 Trend Analysis: From Higher Highs to a Potential Shift📊 NASDAQ 100 (NAS100) Analysis 📊
Someone recently asked me to cover the NAS100 🤔 as price action can look a little confusing right now. On the 4H chart ⏰, we’ve been trending strongly 🟢📈 throughout the week. However, as we head into the end of the week 📅, things are starting to shift.
Zooming into the 30M timeframe 🔍, price action is showing early signs of weakness ⚠️. We’ve had a high, then a higher high ⬆️, and now a lower high 🔽 — instead of a continuation of higher highs.
In the video, we take a deep dive 🎥 into market structure 🏗️, price action 💡, and the trend 📊, highlighting what to watch out for as institutions and big players wind up or unwind positions 💼 into the week’s close.
💬 Your thoughts and comments are welcome!
⚠️ This is educational only and not financial advice. 📚

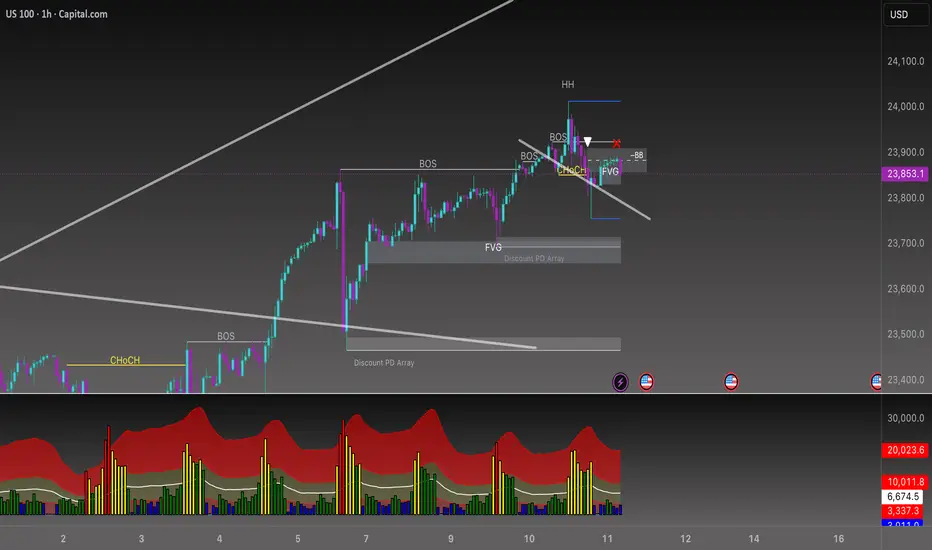
Beyond the Chart – NAS100 Through Technicals & Fundamentals⚖️ CAPITALCOM:US100 Fundamental Impact today
• The core driver is the US CPI (inflation) + Unemployment Claims at 3:30 pm.
• Expect increased volatility on NAS100 around that time:
• ✅ Lower CPI + weaker jobs → Bullish NAS100 (rate cut hopes).
• ❌ Higher CPI + strong jobs → Bearish NAS100 (higher for longer Fed).
1. Bearish Continuation (Main Scenario)
• Rejection from the bearish FVG + BB zone → downside continuation.
• Targeting:
• 23,750 short-term liquidity sweep.
• Then 23,700–23,650 (discount FVG).
• Extended target: 23,540 (major discount PD array).
2. Deeper Retracement / Liquidity Sweep (Alternative Scenario)
• Price might push slightly above the bearish FVG / BB zone (~23,900–23,930) to sweep late shorts.
• Then reversal down, same targets as scenario 1.
3. Bullish Recovery (Less Likely for Now)
• If price reclaims above 23,950–24,000, structure shifts bullish again.
• Potential revisit of 24,100+ liquidity above the HH.
⸻
⚖️ Bias
• For now, bias is bearish unless 23,950–24,000 is broken with strength.
• Volume histogram also shows selling momentum increasing after the rejection.
NasdaqNasdaq continues its bullish rally, after the last attempt to break above this key level failed, 24000 was finally broken. Let's head to 24100

Can COIN's $330 Breakout Reach $380? ~ Tactical Entry Plan📈 COINBASE GLOBAL, INC. (COIN) - Money Heist Plan (Swing/Day Trade) 🕵️♂️
🚨 Ready to execute the ultimate heist on COIN? This Money Heist Plan uses the Thief Strategy, a layered limit order approach to catch the breakout at $330.00 ⚡. Below, I've outlined the setup, technicals, fundamentals, and macro insights to help you navigate this trade like a pro. Set your alarms, plan your escape, and let’s dive into the details! 🔒
🛠️ Trade Setup: The Thief Strategy
The Thief Strategy is a tactical approach using multiple limit order layers to enter the trade post-breakout, maximizing flexibility and precision. Here’s how to execute it:
Asset: COINBASE GLOBAL, INC. (COIN) 💰
Entry Trigger: Breakout above $330.00 ⚡
Set a price alert on TradingView to catch the breakout in real-time! 🔔
Layered Entries (Thief Style): Place multiple buy limit orders to scale in:
$310.00
$315.00
$320.00
$325.00
$330.00
Pro Tip: Adjust layers based on your risk tolerance and strategy. Confirm entries only after the breakout at $330.00! ✅
Stop Loss (SL): Place at $295.00 post-breakout 🛑
Note: Adjust SL based on your risk management. The Thief Strategy is flexible—manage risk at your discretion, dear Traders (Thief OGs)! 😎
Take Profit (TP): Target $380.00 🎯
Resistance and overbought levels signal a potential police barricade 🚔. Escape with profits before the trap! Adjust TP based on your strategy.
Disclaimer: TP is not fixed—take profits at your own risk and preference.
📊 Why This Plan? Technical & Fundamental Breakdown
🔍 Technical Analysis: The Thief’s Blueprint
Breakout Catalyst: COIN is testing the $330.00 resistance. A confirmed breakout signals strong bullish momentum 📈.
Thief Strategy Advantage: Layered entries reduce risk of false breakouts and allow scaling into the move.
Key Levels to Watch:
Support: $295.00 (SL zone)
Resistance/Target: $380.00 (overbought zone)
Setup Confirmation: Use volume spikes and RSI for breakout confirmation. Set TradingView alerts to stay sharp! 🔔
📉 Fundamental & Macro Insights
Market Cap: $81.47B
PE Ratio (TTM): 30.52 (above industry avg., signaling high valuation)
EPS (TTM): $10.39
Revenue Growth (YoY): +12.36% (2025 est.) 💪
Profit Margin: 42.67% 🔥
Cash Reserves: $7.54B (strong balance sheet)
Risks:
Q2 profit drop to $33.2M vs. $294.4M YoY 📉
High P/E (30.71) and Price/Sales (12.61) raise valuation concerns
Macro Drivers:
Genius Act: Boosted crypto optimism 🚀
Crypto Market Trends: Bitcoin’s record highs in July 2025 fuel COIN’s upside potential
😰 Fear & Greed Index
Current Sentiment: Neutral to Greedy (Crypto Fear & Greed Index: 0-100)
Trend: Mixed emotions due to crypto volatility and regulatory developments
Takeaway: Greed supports breakout potential, but stay cautious of volatility spikes.
🧠 Investor Sentiment
Retail Traders: Cautiously optimistic 😊, holding for long-term crypto growth but cautious of short-term volatility.
Institutional Traders: Mixed 🤔—some see overvaluation, others bet on crypto adoption and regulatory clarity.
🐂 Bullish vs. Bearish Outlook
Bullish Score: 60% 🐂
Why? Strong revenue growth (+13.72% YoY est. for 2026), crypto adoption, and institutional interest.
Bearish Risks: 40% 🐻
Why? Profit volatility, high valuation, and crypto market dependence.
Key Watch: Q3 earnings (Sep 2025) and crypto market trends.
💡 Why Trade COIN Now?
Short-Term: Neutral to slightly bearish due to profit concerns, but the $330.00 breakout could spark a quick swing/day trade.
Long-Term: Bullish on COIN’s role in crypto infrastructure and regulatory tailwinds.
Thief Strategy Edge: Layered entries and disciplined risk management make this setup ideal for volatile markets.
🔗 Related Pairs to Watch (USD)
BITSTAMP:BTCUSD : Bitcoin’s momentum drives COIN’s price action.
BITSTAMP:ETHUSD : Ethereum’s performance impacts COIN’s trading volume.
BITSTAMP:XRPUSD : Watch for altcoin rallies tied to regulatory news.
AMEX:SPY : Broader market trends influence COIN’s beta (3.69).
📅 Market Data Snapshot (10 Sep 2025)
Previous Close: $318.78
Day’s Range: $315.88 - $328.67
52-Week Range: $142.58 - $444.65
Avg. Volume: 13.43M shares
✨ “If you find value in my analysis, a 👍 and 🚀 boost is much appreciated — it helps me share more setups with the community!”
#TradingView #COIN #SwingTrading #DayTrading #CryptoTrading #TechnicalAnalysis #ThiefStrategy #MoneyHeist

Nas100 Trade Set Up Sep 10 2025FX:NAS100
www.tradingview.com
Price has tested PDH and formed BSL on the 15m and SSL with a 15m FVG that is currently being respected so i want to see either a test of BSL followed by 1m IFVG to go lower and respect the 15m again or fail and go to test SSL

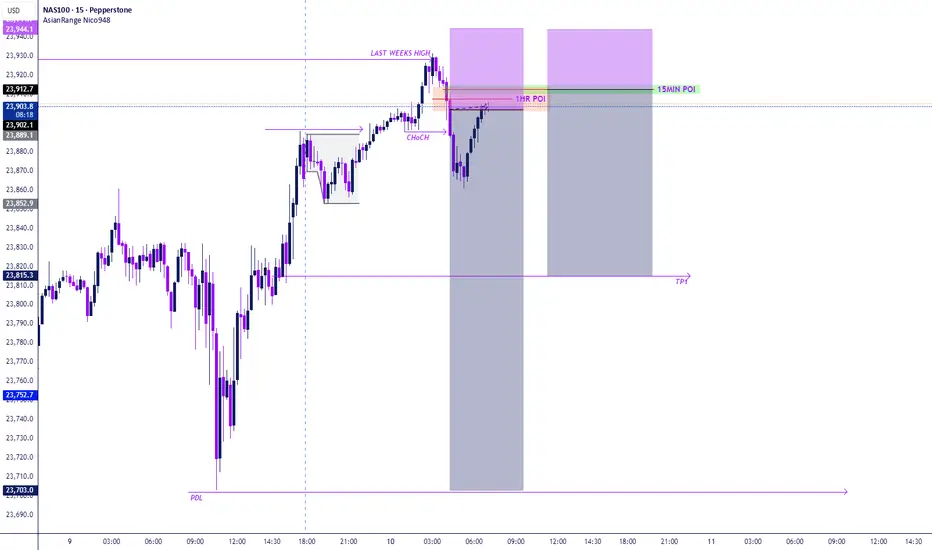
NAS100 – Liquidity Sweep & Short Setup (1H + 15M Scaling)After an aggressive bullish run, NAS100 swept last week’s high and immediately shifted structure (ChoCH).
This confirms external liquidity has been taken and market sentiment is turning bearish.
🔎 Trade Narrative
1. Liquidity Sweep → Last week’s high taken.
2. ChoCH → Order flow shifted bearish after sweep.
3. POIs in Play:
1H Supply Zone → First entry short (early exposure, confirmation).
15M Refined POI → Sell limit placed (precision scaling inside the 1H zone).
4. Target → Previous Day’s Low (PDL) as the next liquidity pool.
📐 Execution Plan
Entry 1: Short from 1H POI ✅
Entry 2: Sell limit at refined 15M POI ✅
Stop Loss: Above 1H supply sweep candle.
Take Profit: Previous Day’s Low (PDL).
Risk Management: Total risk capped at 1% across both entries.
🧠 Institutional Logic
Scaling entries across HTF + LTF zones provides:
Higher TF confirmation ✅
Lower TF precision ✅
Blended entry for better RR ✅
⚖️ Bias: Bearish
Targeting PDL unless price structure shifts bullish again.
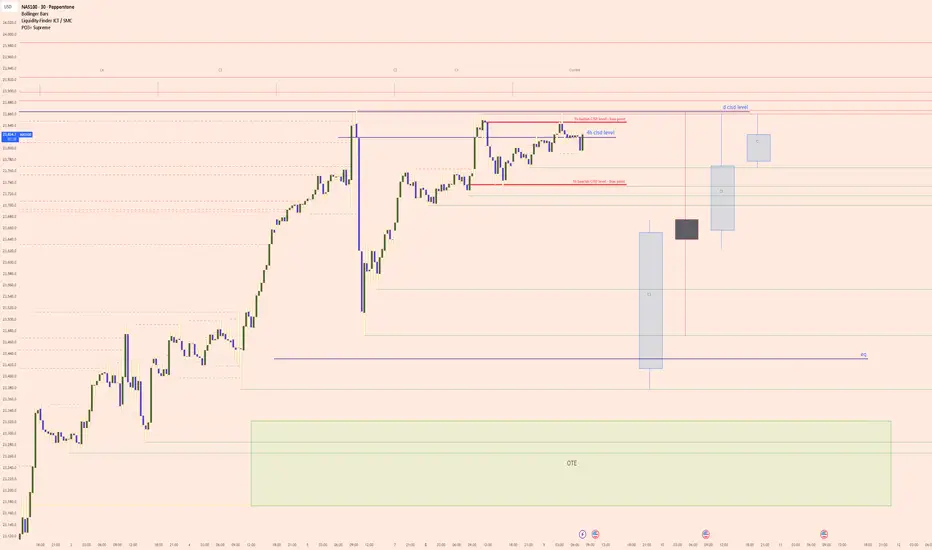
NAS100 (Nasdaq) Key Levels and Probable Draw on LiquidityA clear bullish market structure driven by an aggressive upward displacement.
This energetic move to the upside has created several price inefficiencies, or gaps, which are areas where price delivery was one sided.
Currently, price is consolidating in a premium range, above the equilibrium of the recent impulse leg.
The logical draw on liquidity, or the ultimate target for this bullish momentum, is the distinct old high labeled as the "d cisd level" (Daily change in the state of delivery).
The market is likely reaching for this level to clear out any resting buy side orders.
Before reaching that ultimate target, a retracement is a high probability event.
Price may pull back to rebalance the inefficiency at the "4h cisd level", which should now act as a significant support area.
This would represent a move back into a relative discount, offering a more favorable entry for buyers aiming for the highs.
Should this level fail, a deeper retracement into the larger green zone labeled "OTE" would signify an optimal entry point within the overall bullish leg.
The narrative remains bullish as long as these key lower levels of support are respected.
The alternative path would likely have led to chasing price in a premium, resulting in a poor risk to reward entry. PEPPERSTONE:NAS100 CME_MINI:NQ1! CME_MINI:MNQ1!
USNAS100 Holds Above 23,690 – Bulls Eye 23,870 ATHUSNAS100 – Overview
The Nasdaq 100 remains in bullish momentum while trading above the pivot at 23,690, with the next target near the ATH at 23,870.
Technical Outlook:
📈 As long as price holds above 23,690, bullish momentum is expected toward 23,860 → 23,940 → 24,090.
📉 A confirmed 1H close below 23,690 would shift bias bearish, opening the way to 23,600 → 23,500 → 23,280.
Key Levels:
Pivot: 23,690
Resistance: 23,860 – 23,940 – 24,090
Support: 23,600 – 23,500 – 23,280

NASDAQ NAS100 at a Crossroads: Riding Nvidias Surge with CautionThe immediate reaction to Nvidia's stellar earnings has been decidedly bullish, propelling the NASDAQ higher. We saw a classic "buy the rumor, sell the news" event where the "news" was so powerful it triggered a "fear of missing out" (FOMO) rally with a healthy correction on Friday.
In the next one to two weeks, the near-term bias is bullish, but with extreme caution. The market has received the fundamental "all-clear" it was waiting for from its most important company. However, the index is now technically overextended and sentiment is euphoric, making it vulnerable to a short-term pullback or consolidation. The primary trend, however, remains bullish IMO.
1. The Catalyst: Nvidia Earnings
Nvidia didn't just beat expectations; it shattered them and raised future guidance, validating the entire AI investment thesis.
Revenue & EPS: Significant beats on both the top and bottom lines.
Guidance: Q2 revenue guidance of ~$28B was vastly higher than analyst estimates of ~$26.6B, demonstrating unprecedented demand for its Blackwell and Hopper architecture chips.
Data Center: Revenue of $22.6B, up 427% year-over-year, is the core of the story. This shows that AI infrastructure spending is not slowing; it's accelerating.
Stock Split: The announcement of a 10-for-1 stock split adds a psychological boost for retail investors, improving accessibility and reinforcing bullish sentiment.
Analyst Interpretation: This wasn't just a quarterly report; it was a fundamental confirmation that the AI revolution has tangible, massive earnings power. It alleviated fears that the AI trade was a bubble. For the NASDAQ, which is market-cap weighted and heavily influenced by NVDA, this was rocket fuel.
2. Technical Analysis (One-Day Timeframe Post-Earnings)
Price Action: The NASDAQ gapped up powerfully at the open, breaking cleanly above its previous consolidation range. This was a strong bullish signal.
Volume: The rally was accompanied by massive volume, confirming broad institutional participation. This wasn't a low-volume grind; it was a conviction move.
3. Macro & Fundamental Backdrop
Interest Rates: The market is currently pricing in a higher-for-longer stance from the Fed. However, recent economic data (PMIs, jobless claims) has shown slight signs of softening, which keeps hopes alive for a potential rate cut later in the year. A stable, non-accelerating rate environment is acceptable for tech stocks, especially those like Nvidia with explosive earnings growth that outweighs rate concerns.
Geopolitics: While always a risk (U.S.-China tensions, elections), the market has largely shrugged off these concerns for now, choosing to focus on the stellar corporate fundamentals.
Market Breadth: A key watch-out. The rally has been narrow, led primarily by the "Magnificent 7" (now perhaps the "Fab 1" - Nvidia). For the rally to be sustainable, we need to see broader participation from other sectors and smaller-cap stocks within the NASDAQ.
4. Likely Outcome for the Next 1-2 Weeks: Bullish with a Caveat
Bullish Scenario (60% Probability):
The momentum from Nvidia is likely to carry the NASDAQ higher in the very near term. We could see a continued "melt-up" towards 17,400-17,500 as underinvested funds are forced to chase performance and add equity exposure. Any dip will likely be shallow and bought aggressively, with the 17,000 level holding firm.
Consolidation/Pullback Scenario (35% Probability):
This is the most likely healthy outcome. After such a massive, emotion-driven surge, the market is likely to need a period of digestion. We could see the NASDAQ chop sideways for a week or two to work off the overbought conditions. This would reset the momentum indicators and allow the market to build a new base for the next leg higher. This is not a bearish signal; it is a strengthening signal.
Bearish Reversal Scenario (5% Probability):
A sharp reversal below the 17,000 support level and a fill of the earnings gap (~16,900) would be a significant warning. This would likely require a new, negative macro catalyst (e.g., unexpectedly hot inflation data, a major geopolitical escalation) that forcefully changes the interest rate narrative.
Trading & Investment Implication
For Bulls / Existing Longs: Hold positions. Consider taking partial profits on extreme strength, but avoid selling your entire position. The trend is your friend. Use any pullback to the 17,000 support as a potential buying opportunity.
For New Entrants: Chasing the green spike is high-risk. Be patient. Wait for the inevitable pullback or period of consolidation to establish a position. The risk/reward is poor on the day after a massive gap up.
For Bears: Fighting this tape is exceptionally dangerous. The fundamental news from NVDA is a game-changer for the index. Shorting based solely on overbought conditions is a quick path to losses.
Final Analyst Call: The next week is likely bullish with high volatility, potentially extending gains. However, the following week is highly susceptible to a consolidation or pullback as the initial euphoria settles. The overall trajectory for the next two weeks is cautiously bullish, with the understanding that a 2-4% pullback is a normal and healthy part of a strong uptrend.
The burden of proof is now on the bears to prove they can wrestle control back from a market that just received the best possible news from its most important constituent.
Not financial advice, this is just my opinion.

NAS100 H4 | bullish momentum to extendNAS100 has reacted off the buy entry at 23,720.82, which is a pullback support and could bounce from this level to the take profit.
Stop loss is at 23,572.15, which is a pullback support.
Take profit is at 24,065.29, which lines up with the 61.8% Fibonacci projection and the 138.2% Fibonacci extension.
High Risk Investment Warning
Trading Forex/CFDs on margin carries a high level of risk and may not be suitable for all investors. Leverage can work against you.
Stratos Markets Limited (tradu.com ):
CFDs are complex instruments and come with a high risk of losing money rapidly due to leverage. 65% of retail investor accounts lose money when trading CFDs with this provider. You should consider whether you understand how CFDs work and whether you can afford to take the high risk of losing your money.
Stratos Europe Ltd (tradu.com ):
CFDs are complex instruments and come with a high risk of losing money rapidly due to leverage. 66% of retail investor accounts lose money when trading CFDs with this provider. You should consider whether you understand how CFDs work and whether you can afford to take the high risk of losing your money.
Stratos Global LLC (tradu.com ):
Losses can exceed deposits.
Please be advised that the information presented on TradingView is provided to Tradu (‘Company’, ‘we’) by a third-party provider (‘TFA Global Pte Ltd’). Please be reminded that you are solely responsible for the trading decisions on your account. There is a very high degree of risk involved in trading. Any information and/or content is intended entirely for research, educational and informational purposes only and does not constitute investment or consultation advice or investment strategy. The information is not tailored to the investment needs of any specific person and therefore does not involve a consideration of any of the investment objectives, financial situation or needs of any viewer that may receive it. Kindly also note that past performance is not a reliable indicator of future results. Actual results may differ materially from those anticipated in forward-looking or past performance statements. We assume no liability as to the accuracy or completeness of any of the information and/or content provided herein and the Company cannot be held responsible for any omission, mistake nor for any loss or damage including without limitation to any loss of profit which may arise from reliance on any information supplied by TFA Global Pte Ltd.
The speaker(s) is neither an employee, agent nor representative of Tradu and is therefore acting independently. The opinions given are their own, constitute general market commentary, and do not constitute the opinion or advice of Tradu or any form of personal or investment advice. Tradu neither endorses nor guarantees offerings of third-party speakers, nor is Tradu responsible for the content, veracity or opinions of third-party speakers, presenters or participants.

ZGM | NASDAQ SNIPER ZONES FOR LONGTERM BASED ON SNR Nasdaq Trade !
NASDAQ H4 BREAKOUT THE SELL TRENDLINE FIRST , AND BOX OF RBS CALLED (RESISTANCE BECOME SUPPORT) HAVE A X SETUP
X SETUP EXPLAINED !
The Sell TL Broke And Nasdaq Have A Buy TL Thats Means Its The XSetup
X SETUP + QM SETUP + SUPPORT
FOLLOW US FOR MORE KNOWLEDGE AND TRADE IDEAS

NASDAQ (NQ1!): Buy It Until The Market Notifies Us Otherwise!Welcome back to the Weekly Forex Forecast for the week of Sept 8 - 12.
In this video, we will analyze the following FX market: NASDAQ (NQ1!) NAS100
The NASDAQ looks poised to move higher. There is potential for it to make a new ATH.
Wait for pullbacks to poi's for valid long setups.
I do not see a reason to sell this market. Until there is a bearish break of market structure, buys are the ticket.
Enjoy!
May profits be upon you.
Leave any questions or comments in the comment section.
I appreciate any feedback from my viewers!
Like and/or subscribe if you want more accurate analysis.
Thank you so much!
Disclaimer:
I do not provide personal investment advice and I am not a qualified licensed investment advisor.
All information found here, including any ideas, opinions, views, predictions, forecasts, commentaries, suggestions, expressed or implied herein, are for informational, entertainment or educational purposes only and should not be construed as personal investment advice. While the information provided is believed to be accurate, it may include errors or inaccuracies.
I will not and cannot be held liable for any actions you take as a result of anything you read here.
Conduct your own due diligence, or consult a licensed financial advisor or broker before making any and all investment decisions. Any investments, trades, speculations, or decisions made on the basis of any information found on this channel, expressed or implied herein, are committed at your own risk, financial or otherwise.

NAS100 Bearish Reversal from Supply Zone – Short SetupThe NAS100 (1H chart) is trading within a channel structure marked by a rejection line (resistance) and a support line. Price recently broke below the EMA (70 & 200), showing bearish momentum.
Supply Zone (POI): 23,524 – 23,637, where price may retest before further decline (potential short entry zone).
Trend: Current momentum is bearish after rejection from channel resistance.
Support/Target: Main downside target is 22,979 – 22,905, aligning with previous swing low and Fibonacci extension area.
EMA Strategy: Price below both 70 & 200 EMA indicates bearish trend continuation.
Structure Break: Breakdown of channel support suggests sellers are in control.
📌 Trading Plan:
Entry (Sell Zone): 23,524 – 23,637 (POI Supply Zone)
Stop Loss: Above 23,640 (channel resistance)
Target: 22,979 – 22,905
Conclusion:
Market is in bearish structure. Wait for pullback to supply zone for a high-probability short entry, targeting the lower support zone.

NAS100 At Major Resistance - Breakout or Reversal?NAS100 Technical Analysis: 🚀 At Major Resistance - Breakout or Reversal? 📉
Asset: NAS100 (NASDAQ 100 CFD)
Analysis Date: September 5, 2025
Current Closing Price: 23,639.8 (as of 12:59 AM UTC+4)
Timeframes Analyzed: 1H, 4H, D, W
Executive Summary & Market Outlook 🧐
The NAS100 is at a critical technical juncture, testing a formidable resistance zone between 23,600 and 23,800. 📊 The index is in a clear long-term bullish trend but shows signs of short-term exhaustion after a powerful rally. This is a classic "make-or-break" level. A decisive breakout above 23,800 could ignite a new leg up towards 24,500, while a rejection here may trigger a significant corrective pullback towards 22,800. This analysis provides a roadmap for both intraday traders 🎯 and swing traders 📈.
Multi-Timeframe Technical Analysis 🔍
1. Trend Analysis (Daily & 4-Hour Chart):
Primary Trend: 🟢 Bullish. Price is above all major Daily Moving Averages (200, 100, 50 EMA), which are aligned bullishly.
Short-Term Trend: 🟡 Bullish but Overextended. The rally has been near-vertical, suggesting the market is ripe for a pause or pullback.
2. Key Chart Patterns & Theories:
Resistance Confluence Zone 🧱: The current price is battling a massive resistance cluster. This zone includes:
A prior major swing high (Price Action Resistance).
The 127.2% and 161.8% Fibonacci extension levels from the last significant correction.
A potential Bullish Cypher pattern's Potential Reversal Zone (PRZ).
Elliott Wave Theory 🌊: The rally from the last major low is best counted as a powerful Impulse Wave. We are likely in the final stages of Wave 5 or a complex Wave 3 extension. This implies that while the trend is up, a larger Wave (4) correction is increasingly probable. Typical retracement targets for a Wave 4 are the 38.2% Fib level near 22,800.
Ichimoku Cloud (H4/D1) ☁️: Price is trading high above the Cloud on daily charts, confirming the strong bullish trend. The Lagging Span (Chikou Span) is also well above price, indicating sustained buying pressure. However, such extreme extensions often precede consolidation.
Gann Theory ⏳: The 23,600-23,800 area represents a key mathematical resistance zone. A daily close above this could open the path to the next Gann angle target.
3. Critical Support & Resistance Levels:
Resistance (R1): 23,800 - 24,000 (Key Psychological & Technical Ceiling) 🚨
Resistance (R2): 24,500 (Projected Target)
Current Closing Price: ~23,640
Support (S1): 23,200 - 23,400 (Immediate Support & 21-period EMA) ✅
Support (S2): 22,800 - 23,000 (Major Support - 38.2% Fib & Prior Breakout Zone) 🛡️
Support (S3): 22,200 (200-Day EMA & 50% Fib)
4. Indicator Consensus:
RSI (14-period on 4H/D): Reading is above 70 on both timeframes, signaling severely overbought conditions. 📛 This is a warning against chasing longs at these highs. A bearish divergence is forming on the 4H chart, hinting at weakening momentum.
Bollinger Bands (4H) 📏: Price is consistently riding the upper band, a sign of a strong trend. However, a move back towards the middle band (20-period SMA) is a common next step after such extensions.
Moving Averages: The bullish alignment (EMA8 > EMA21 > EMA50) is intact. The EMA 21 on the 4H chart (~23,400) is critical immediate support.
Volume & VWAP: Volume has been declining on the most recent push higher, a potential bearish divergence 📉 suggesting a lack of conviction at these highs.
Trading Strategy & Forecast 🎯
A. Intraday Trading Strategy (5M - 1H Charts):
Bearish Scenario (Rejection Play) ⬇️: This is the preferred setup given overbought conditions. Look for bearish reversal candlestick patterns (e.g., Bearish Engulfing, Evening Star 🌟) at or near the 23,800 resistance.
Entry: On confirmation of rejection.
Stop Loss: Tight, above 23,850.
Target: 23,400 (TP1), 23,200 (TP2).
Bullish Scenario (Breakout Play) ⬆️: If buyers overpower and we get a strong 1H close above 23,850, a momentum long could be viable.
Entry: On a small pullback to ~23,780 (re-test as support) or on the breakout.
Stop Loss: Below 23,650.
Target: 24,200 (TP1), 24,500 (TP2).
B. Swing Trading Strategy (4H - D Charts):
Strategy: WAIT FOR A PULLBACK. The risk/reward for new long entries at this resistance is poor. 🚫 The optimal strategy is to wait for a healthy correction to key support zones to add long positions.
Ideal Long Zones: 23,200 (shallow pullback) or 22,800 (deeper correction). ✅
Bearish Risk: A daily close below 22,800 would signal a much deeper correction is likely underway, potentially targeting 22,200.
Risk Management & Conclusion ⚠️
Key Risk Events: High-impact US economic data (e.g., NFP, CPI) and Fed policy announcements are paramount. 🔥 Any hawkish surprises could be the catalyst for a sharp tech-led selloff.
Position Sizing: The potential for increased volatility demands conservative risk management. Never risk more than 1-2% of your account on a single trade.
Conclusion: The NAS100 is bullish but exhausted. 🥴 The current resistance zone is a high-risk area for new longs and a high-probability area for a pullback. 🎯 Swing traders should be patient for a better entry. Intraday traders can play the range between 23,200 and 23,800 until a decisive break occurs. The overall trend remains up, but a period of consolidation or correction is the most probable outcome in the near term.
Overall Bias: 🟢 Bullish above 22,800 | 🟡 Neutral/Bearish below 23,200
For individuals seeking to enhance their trading abilities based on the analyses provided, I recommend exploring the mentoring program offered by Shunya Trade. (Website: shunya dot trade)
I would appreciate your feedback on this analysis, as it will serve as a valuable resource for future endeavors.
Sincerely,
Shunya.Trade
Website: shunya dot trade
Disclaimer: This post is intended solely for educational purposes and does not constitute investment advice, financial advice, or trading recommendations. The views expressed herein are derived from technical analysis and are shared for informational purposes only. The stock market inherently carries risks, including the potential for capital loss. Therefore, readers are strongly advised to exercise prudent judgment before making any investment decisions. We assume no liability for any actions taken based on this content. For personalized guidance, it is recommended to consult a certified financial advisor.

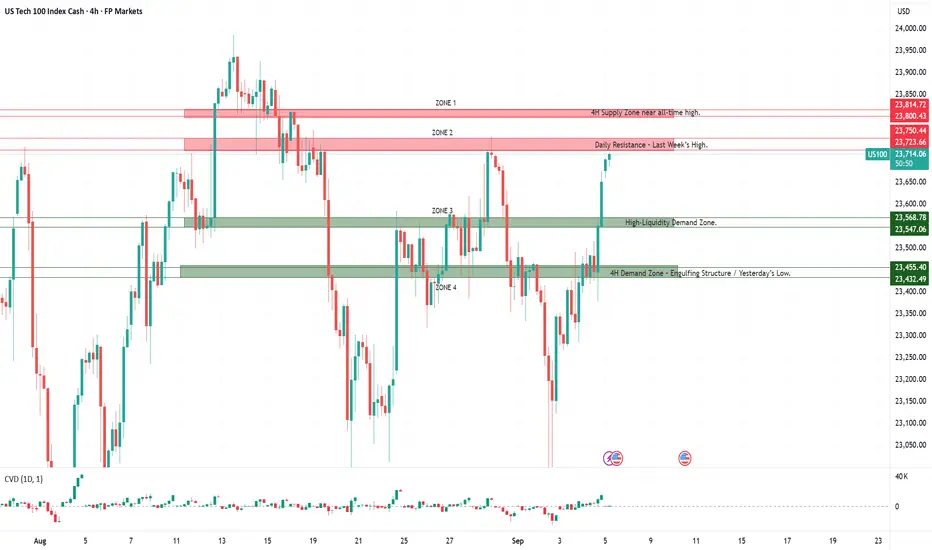
US100 – Today’s Key Trading ZonesHere are today’s trading zones for the US100. The levels are not fixed buy or sell signals, but decision areas where price often accelerates. Rejections can set up counter-trades, while clean breaks and retests can create continuation opportunities.
Zone 1
This area represents a major resistance close to the historical top. Price entering this zone carries a high probability of seller absorption and sharp rejection. A clean breakout and hold above would shift sentiment and open the door for new highs.
Zone 2
A key decision area from previous weekly highs. Often acts as a liquidity pool where breakout traps are common. A strong rejection can offer short opportunities, while a confirmed break and retest may flip the zone into support.
Zone 3
This level has repeatedly attracted strong reactions and carries high resting liquidity. Expect aggressive order flow here – either a sharp bounce for longs or, if broken, a continuation short on retest.
Zone 4
Formed around a strong 4H engulfing pattern and aligned with yesterday’s low. Buyers are likely to defend this level, making it a key intraday demand zone. A decisive break below would indicate seller dominance and could accelerate downside momentum.
Market Sentiment – Cautious Optimism
Overall sentiment in the US100 remains cautiously optimistic, supported by strong performance in Big Tech and expectations of a more dovish Fed. Still, the backdrop is fragile given broader macroeconomic signals, with investors balancing optimism against underlying economic risks.
Big Tech Drives the Market
Large-cap tech stocks led the market higher at record pace. Alphabet surged nearly 9%, Apple advanced 3–4%, and Tesla gained about 1.4%, boosted by a favorable antitrust ruling and strong technical momentum. Alphabet even reached a new record high, underscoring the sector’s ability to lift the entire index.
Macro Data – Mixed but Supportive
Weaker job openings data reinforced expectations of Fed rate cuts, a positive driver for growth stocks as lower bond yields support risk appetite. At the same time, the ISM Services PMI rose to 52.0, marking a third straight month of expansion and showing resilience in the services sector despite manufacturing weakness and a cooling labor market.
Nasdaq - Preparing for another correction!🚔Nasdaq ( TVC:NDQ ) is starting to look weak:
🔎Analysis summary:
Over the course of the past couple of months, we witnessed an incredible rally on the Nasdaq. Following this previous price action, it is quite likely that we will soon see another correction. This could start with the current retest of the channel resistance trendline.
📝Levels to watch:
$23.000
SwingTraderPhil
SwingTrading.Simplified. | Investing.Simplified. | #LONGTERMVISION

Fed cut odds hit 97% ahead of Friday’s jobs report Markets are waiting for Friday’s U.S. NFP jobs report, which could heavily influence the Federal Reserve’s next move on interest rates.
Traders want a result that supports the case for rate cuts but doesn’t raise fears of a weakening economy. The ADP private payrolls report showed 54,000 new jobs in August. Stocks moved higher on the news, as wall street saw the number as weak enough for the Fed to cut rates in September, but not so weak that it signals a recession.
According to CME Group’s FedWatch tool, there is now a 97% chance the Fed will lower rates when it meets in two weeks.

NAS100 H4 | Heading into pullback resistanceNAS100 is rising towards the sell entry at 23,720.82, which has been identified as a pullback resistance and could reverse from this level to the downside.
Stop loss is at 23,927.51, which is a swing high resistance.
Take profit is at 23,097.53, which is a multi swing low support.
High Risk Investment Warning
Trading Forex/CFDs on margin carries a high level of risk and may not be suitable for all investors. Leverage can work against you.
Stratos Markets Limited (tradu.com ):
CFDs are complex instruments and come with a high risk of losing money rapidly due to leverage. 65% of retail investor accounts lose money when trading CFDs with this provider. You should consider whether you understand how CFDs work and whether you can afford to take the high risk of losing your money.
Stratos Europe Ltd (tradu.com ):
CFDs are complex instruments and come with a high risk of losing money rapidly due to leverage. 66% of retail investor accounts lose money when trading CFDs with this provider. You should consider whether you understand how CFDs work and whether you can afford to take the high risk of losing your money.
Stratos Global LLC (tradu.com ):
Losses can exceed deposits.
Please be advised that the information presented on TradingView is provided to Tradu (‘Company’, ‘we’) by a third-party provider (‘TFA Global Pte Ltd’). Please be reminded that you are solely responsible for the trading decisions on your account. There is a very high degree of risk involved in trading. Any information and/or content is intended entirely for research, educational and informational purposes only and does not constitute investment or consultation advice or investment strategy. The information is not tailored to the investment needs of any specific person and therefore does not involve a consideration of any of the investment objectives, financial situation or needs of any viewer that may receive it. Kindly also note that past performance is not a reliable indicator of future results. Actual results may differ materially from those anticipated in forward-looking or past performance statements. We assume no liability as to the accuracy or completeness of any of the information and/or content provided herein and the Company cannot be held responsible for any omission, mistake nor for any loss or damage including without limitation to any loss of profit which may arise from reliance on any information supplied by TFA Global Pte Ltd.
The speaker(s) is neither an employee, agent nor representative of Tradu and is therefore acting independently. The opinions given are their own, constitute general market commentary, and do not constitute the opinion or advice of Tradu or any form of personal or investment advice. Tradu neither endorses nor guarantees offerings of third-party speakers, nor is Tradu responsible for the content, veracity or opinions of third-party speakers, presenters or participants.

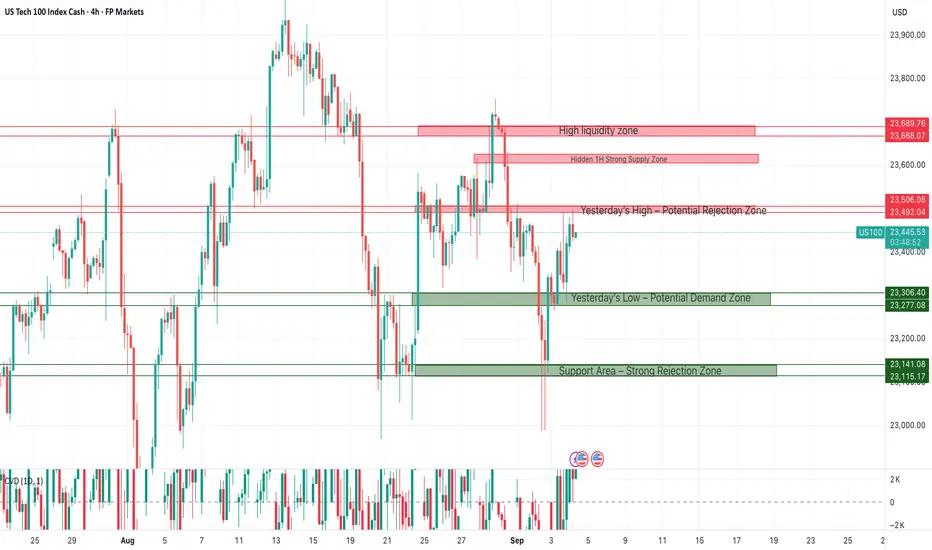
US100 on Shaky Ground – What Traders Should Watch TodayZones in Focus
The marked zones on the chart are not fixed buy or sell levels but decision areas where price is likely to accelerate and create short-term opportunities.
Red zones (potential supply): If price trades into these areas and shows rejection, it can set up short positions. A clean break above, however, flips the zone into potential support, opening the door for continuation longs.
Green zones (potential demand): If price reaches these areas and bounces sharply, it can provide long setups. A decisive break lower, by contrast, turns the zone into resistance, creating opportunities for continuation shorts on a retest.
The framework is built around letting price action on the 5-minute chart confirm the reaction: rejections favor counter-trades, while breakouts and retests favor continuation in the direction of the move.
The Market Is Sending Mixed Signals
The latest JOLTS report showed U.S. job openings falling to 7.18 million in July, below expectations of 7.38 million and down from 7.36 million in June. That makes it the lowest reading in ten months – and for the first time since the COVID era, there are more unemployed workers than available jobs.
For equities, this kind of data is a double-edged sword. On one hand, fewer openings cool the labor market and strengthen the case for earlier Fed rate cuts. On the other, if the trend deepens, it signals weaker economic momentum and risks feeding through to lower earnings growth.
Mood Check: Nasdaq Between Hope and Fear
The mood in the Nasdaq-100 is cautiously optimistic, yet undeniably fragile.
The bright side: Big Tech carried the index higher yesterday, with Alphabet rallying 9% and Apple 3–4%. That added roughly 1% to the Nasdaq-100 and reminded us how concentrated the index still is – a single positive headline can shift sentiment fast. At the same time, falling yields and softer labor data fuel hopes that the Fed may soon move toward cuts, a clear tailwind for growth stocks.
The risk side: Macro signals tell a different story. The ISM confirmed that manufacturing remains in contraction, and JOLTS made clear that the labor market is cooling. Inflation pressure may be easing, but so is economic momentum. That keeps investors defensive, even as the index rallies.
The Bigger Picture
Taken together, US100 sentiment is leaning positive in the near term, but the foundation is shaky. Gains are being driven more by mega-cap strength and expectations of rate relief than by broad economic resilience. Until the macro backdrop turns more convincingly, every rally remains vulnerable.
US100 – London Session OutlookTrading Focus
The marked zones on the chart highlight areas where I look for small but quick intraday moves. There are two potential sell zones and two potential buy zones. If a zone breaks, I look for continuation trades on a retest of that same level.
This approach allows me to capture short, tactical opportunities with clear risk levels, while adapting quickly if price breaks structure.
Macro Update – Manufacturing Still Under Pressure
Yesterday, the ISM Manufacturing PMI was released. The August figure came in at 48.7%, a slight improvement from July’s 48.0%, yet still below the 50% threshold that signals expansion. This indicates that U.S. manufacturing remains in contraction for the sixth consecutive month, though the slower pace points to some early signs of stabilization. New orders climbed back above 50%, suggesting demand may be recovering, but production and employment both weakened, and prices remained elevated, underscoring persistent cost pressures. Overall, the sector is still under strain, showing only tentative signs of recovery.
Market Sentiment
Overall, market sentiment is cautious. The rebound in new orders provides a hint of optimism, but weak production, soft labor data, and sticky input costs keep investors on edge. Traders remain defensive, seeking confirmation before committing risk in what is still a fragile backdrop.
What’s Next – JOLTS Job Openings
Today, all eyes are on the JOLTS Job Openings report, a key gauge of U.S. labor market strength.
A higher reading signals tight labor conditions, keeping wage and inflation pressures high and limiting the Fed’s ability to cut rates.
A weaker reading suggests cooling demand for workers, supporting the case for easing.
This release has the potential to move markets quickly, adding another layer of volatility.
NAS100 H4 | Bearish drop offNAS100 has rejected off the sell entry of 23,475.21, which is a pullback resistance that lines up with the 38.2% Fibonacci retracement and could drop from this level to the downside.
Stop loss is at 23,575.82, which is a pullback resitance that aligns with the 61.8% Fibonacci retracement.
Take profit is at 23,110.94, which is a swing low suport that is slightly below the 161.8% Fibonacci extension.
High Risk Investment Warning
Trading Forex/CFDs on margin carries a high level of risk and may not be suitable for all investors. Leverage can work against you.
Stratos Markets Limited (tradu.com ):
CFDs are complex instruments and come with a high risk of losing money rapidly due to leverage. 65% of retail investor accounts lose money when trading CFDs with this provider. You should consider whether you understand how CFDs work and whether you can afford to take the high risk of losing your money.
Stratos Europe Ltd (tradu.com ):
CFDs are complex instruments and come with a high risk of losing money rapidly due to leverage. 66% of retail investor accounts lose money when trading CFDs with this provider. You should consider whether you understand how CFDs work and whether you can afford to take the high risk of losing your money.
Stratos Global LLC (tradu.com ):
Losses can exceed deposits.
Please be advised that the information presented on TradingView is provided to Tradu (‘Company’, ‘we’) by a third-party provider (‘TFA Global Pte Ltd’). Please be reminded that you are solely responsible for the trading decisions on your account. There is a very high degree of risk involved in trading. Any information and/or content is intended entirely for research, educational and informational purposes only and does not constitute investment or consultation advice or investment strategy. The information is not tailored to the investment needs of any specific person and therefore does not involve a consideration of any of the investment objectives, financial situation or needs of any viewer that may receive it. Kindly also note that past performance is not a reliable indicator of future results. Actual results may differ materially from those anticipated in forward-looking or past performance statements. We assume no liability as to the accuracy or completeness of any of the information and/or content provided herein and the Company cannot be held responsible for any omission, mistake nor for any loss or damage including without limitation to any loss of profit which may arise from reliance on any information supplied by TFA Global Pte Ltd.
The speaker(s) is neither an employee, agent nor representative of Tradu and is therefore acting independently. The opinions given are their own, constitute general market commentary, and do not constitute the opinion or advice of Tradu or any form of personal or investment advice. Tradu neither endorses nor guarantees offerings of third-party speakers, nor is Tradu responsible for the content, veracity or opinions of third-party speakers, presenters or participants.
