Nasdaq-100 H4 | Swing-low support at 23.6% Fibonacci retracementThe Nasdaq-100 (NAS100) is falling towards a swing-low support and could potentially bounce off this level to climb higher.
Buy entry is at 22,509.40 which is a swing-low support that aligns closely with the 23.6% Fibonacci retracement.
Stop loss is at 22,250.00 which is a level that lies underneath a pullback support and the 38.2% Fibonacci retracement.
Take profit is at 22,921.84 which is a multi-swing-high resistance.
High Risk Investment Warning
Trading Forex/CFDs on margin carries a high level of risk and may not be suitable for all investors. Leverage can work against you.
Stratos Markets Limited (tradu.com ):
CFDs are complex instruments and come with a high risk of losing money rapidly due to leverage. 63% of retail investor accounts lose money when trading CFDs with this provider. You should consider whether you understand how CFDs work and whether you can afford to take the high risk of losing your money.
Stratos Europe Ltd (tradu.com ):
CFDs are complex instruments and come with a high risk of losing money rapidly due to leverage. 63% of retail investor accounts lose money when trading CFDs with this provider. You should consider whether you understand how CFDs work and whether you can afford to take the high risk of losing your money.
Stratos Global LLC (tradu.com ):
Losses can exceed deposits.
Please be advised that the information presented on TradingView is provided to Tradu (‘Company’, ‘we’) by a third-party provider (‘TFA Global Pte Ltd’). Please be reminded that you are solely responsible for the trading decisions on your account. There is a very high degree of risk involved in trading. Any information and/or content is intended entirely for research, educational and informational purposes only and does not constitute investment or consultation advice or investment strategy. The information is not tailored to the investment needs of any specific person and therefore does not involve a consideration of any of the investment objectives, financial situation or needs of any viewer that may receive it. Kindly also note that past performance is not a reliable indicator of future results. Actual results may differ materially from those anticipated in forward-looking or past performance statements. We assume no liability as to the accuracy or completeness of any of the information and/or content provided herein and the Company cannot be held responsible for any omission, mistake nor for any loss or damage including without limitation to any loss of profit which may arise from reliance on any information supplied by TFA Global Pte Ltd.
The speaker(s) is neither an employee, agent nor representative of Tradu and is therefore acting independently. The opinions given are their own, constitute general market commentary, and do not constitute the opinion or advice of Tradu or any form of personal or investment advice. Tradu neither endorses nor guarantees offerings of third-party speakers, nor is Tradu responsible for the content, veracity or opinions of third-party speakers, presenters or participants.
NASDAQ 100 CFD

Nasdaq 100 Dips as Tariffs Spark CautionWhile crypto markets rally, U.S. equities have cooled. The Nasdaq 100 dropped by 0.6% following the announcement of new tariffs, particularly those aimed at Canadian goods. Tech stocks are reacting cautiously to these developments, although Nvidia’s record-breaking $4 trillion market cap continues to provide some support for the index.
With major financials such as JPMorgan and Wells Fargo reporting Q2 earnings next week, investors will soon get clarity on how corporate America is coping with higher input costs and global trade tensions.
Technical View (Nasdaq 100):
The index is consolidating between resistance at 22,900 and support at 22,600. A break above 22,900 could reignite the tech rally, while a drop below support may see price test 22,400 and potentially 22,000 in coming sessions.
NAS100 (Cash100) Double Top H8Potential short on NAS100.
Risk/reward = 5.4.
Entry = 22 956
Stop loss = 23 059
TP level 1 = 22 473 (50% of position)
T level 2 = 22 303 (50% of position)
RSI divergence.
Waiting for closure of current H8 candle to close in range.
Looking for lower volume on H8 closure, however, will make exception id higher since top 1 was on Thursday the 3rd and markets closed early.

Nasdaq 100 Index 2-Hour Chart Analysis2-hour candlestick chart for the Nasdaq 100 Index (NDX) on the NASDAQ exchange. The chart spans from May to August, showcasing a significant upward trend with notable fluctuations. Key indicators include a recent price of 22,861.53, representing a 0.72% increase. The chart features technical analysis elements such as support and resistance levels, highlighted by green and red boxes, and a downward arrow suggesting a potential price movement.

USNAS100 Consolidates Between 22815–22705 | Breakout Will DefineUSNAS100 – Technical Outlook
The NASDAQ remains under pressure amid ongoing tariff uncertainty, with traders closely watching for any progress in negotiations or signs of escalation.
Currently, the price is consolidating between 22815 and 22705, awaiting a breakout to define the next directional move.
A 1H candle close below 22705 would confirm bearish continuation, targeting 22600, with further downside potential toward 22420.
A break above 22815 would shift momentum bullish, opening the way to 22880, followed by 23010.
Key Levels:
Support: 22600 / 22420
Resistance: 22815 / 22880 / 23010

NASDAQ Potential DownsidesHey Traders, in today's trading session we are monitoring NAS100 for a selling opportunity around 22,750 zone, NASDAQ is trading in a downtrend and currently is in a correction phase in which it is approaching the trend at 22,750 support and resistance area.
Trade safe, Joe.

Watch me trade NQ LIVE!This is a just a quick video showing what I look for in order to take a trade.
I entered a short on NQ minutes ago, looking for 2.44 RR!
Apologies for this rough cut video. It was spur of the moment, and I wanted to share with my followers and viewers!
Enjoy!
May profits be upon you.
Leave any questions or comments in the comment section.
I appreciate any feedback from my viewers!
Like and/or subscribe if you want more accurate analysis.
Thank you so much!
Disclaimer:
I do not provide personal investment advice and I am not a qualified licensed investment advisor.
All information found here, including any ideas, opinions, views, predictions, forecasts, commentaries, suggestions, expressed or implied herein, are for informational, entertainment or educational purposes only and should not be construed as personal investment advice. While the information provided is believed to be accurate, it may include errors or inaccuracies.
I will not and cannot be held liable for any actions you take as a result of anything you read here.
Conduct your own due diligence, or consult a licensed financial advisor or broker before making any and all investment decisions. Any investments, trades, speculations, or decisions made on the basis of any information found on this channel, expressed or implied herein, are committed at your own risk, financial or otherwise.

NASDAQ Bulls Defend Pivot – Can 23,000 Break Next?USNAS100
The Nasdaq 100 is currently holding above the pivotal 22,720 level, supported by market optimism amid recent tariff-related developments from the White House.
Bullish Scenario:
Sustained price action above 22,720 keeps bullish momentum intact. A break and 1H close above 22,815 would confirm strength, opening the path toward the psychological milestone and potential all-time high at 23,000.
Bearish Breakdown:
A 1H or 4H close below 22,720 would invalidate the bullish bias and strengthen downside pressure, with initial support seen at 22,615 and deeper correction likely toward 22,420.
Key Technical Levels:
• Resistance: 22,815 · 23,000
• Support: 22,615 · 22,420

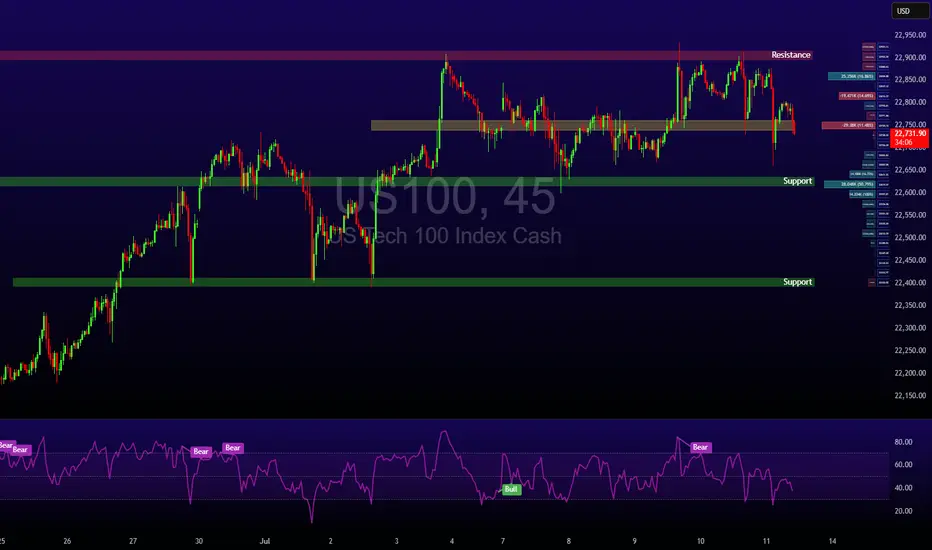
NAS100 Reading Market Structure: When to Trade and When to WaitI'm currently keeping a close eye on the NASDAQ 📉. Price has remained largely range-bound over the past few sessions and continues to show signs of pressure 🔻. While we've seen a short-term rally 🚀, it lacks the conviction and momentum typically seen in stronger trending environments 📊.
When comparing the current conditions to previous trend phases, the difference is clear. Structure is unclear, and there's no confirmation of sustained direction yet. As shown on the chart 📈, we previously saw strong bullish momentum followed by a sharp shift, suggesting indecision in the market 🤔.
In these situations, patience is key ⏳. It's just as important to know when not to trade as it is to know when to act 🎯. For now, I’m choosing to stay on the sidelines until a clearer trend develops.
Not financial advice ⚠️

NASDAQ After the Fireworks: Bearish Setup LoadedAfter the classic 4th of July rally, I stepped in on the short side of Nasdaq, targeting 22,000 and 21,400 zones. The market structure shows exhaustion, and with the cloud retest failing to hold new highs, I positioned accordingly.
Technical:
• Price stalled at prior expansion highs with tight compression near 23,000.
• Daily FibCloud offered resistance confirmation.
• Bearish risk-reward skew forms after extended rally and thin retraces.
• Volume divergence spotted.
Fundamentals:
Multiple overlapping uncertainties:
• Trump confirmed tariffs will take effect on August 1, threatening a 10% surcharge on BRICS-aligned nations.
• Treasury Secretary Bessent anticipates several trade deal announcements within 48h—but stresses quality over quantity.
• Bank of America maintains its base case of 0 rate cuts in 2025, citing strong economic data and sticky inflation risks.
The combination of tariff escalation, hawkish monetary expectations, and global trade friction creates a perfect backdrop for volatility and correction—especially in overextended tech indices like the Nasdaq.
Note: Please remember to adjust this trade idea according to your individual trading conditions, including position size, broker-specific price variations, and any relevant external factors. Every trader’s situation is unique, so it’s crucial to tailor your approach to your own risk tolerance and market environment.

Nasdaq 100: Bearish Signals Near the All-Time HighNasdaq 100: Bearish Signals Near the All-Time High
As the 4-hour chart of the Nasdaq 100 (US Tech 100 mini on FXOpen) shows, the index reached a new all-time high last week. However, the price action suggests that the current pace of growth may not last.
Last week’s strong labour market data triggered a significant bullish impulse. However, the upward momentum has been entirely retraced (as indicated by the arrows).
The tax cut bill signed on Friday, 4 July, by Trump — which is expected to lead to a significant increase in US government debt — contributed to a modest bullish gap at today’s market open. Yet, as trading progressed during the Asian session, the index declined.
This suggests that fundamental news, which could have served as bullish catalysts, are failing to generate sustainable upward movement — a bearish sign.
Further grounds for doubt regarding the index's continued growth are provided by technical analysis of the Nasdaq 100 (US Tech 100 mini on FXOpen) chart, specifically:
→ a bearish divergence on the RSI indicator;
→ price proximity to the upper boundary of the ascending channel, which is considered resistance.
It is reasonable to suggest that the market may be overheated and that bullish momentum is waning. Consequently, a correction may be forming — potentially involving a test of the 22,100 level. This level acted as resistance from late 2024 until it was broken by strong bullish momentum in late June.
This article represents the opinion of the Companies operating under the FXOpen brand only. It is not to be construed as an offer, solicitation, or recommendation with respect to products and services provided by the Companies operating under the FXOpen brand, nor is it to be considered financial advice.

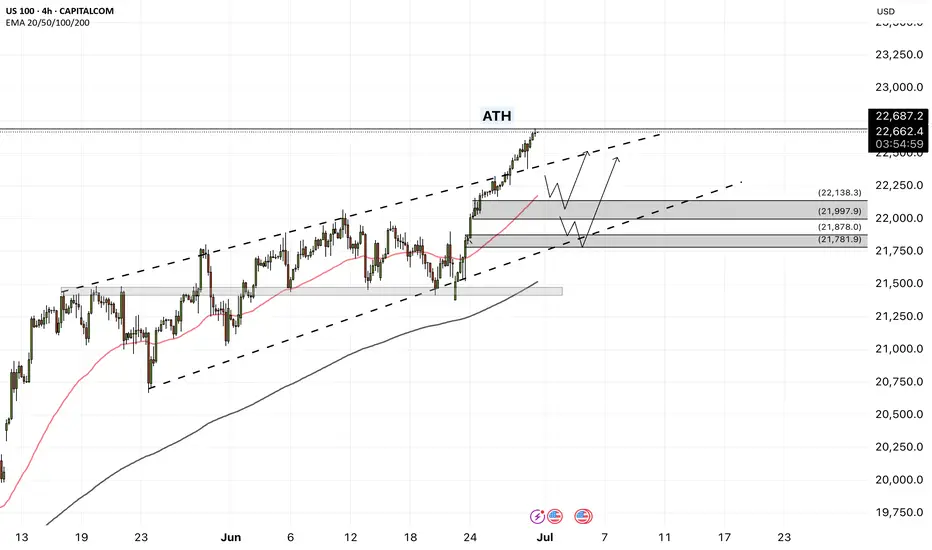
NAS100 - Stock market is waiting for tariffs!The index is above the EMA200 and EMA50 on the four-hour timeframe and is trading in its ascending channel. Maintaining the ascending channel will lead to the continuation of the Nasdaq's upward path to higher targets, but if it does not rise and corrects towards the demand limits, you can buy the Nasdaq index with appropriate reward and risk.
Three months ago, Donald Trump postponed the imposition of severe retaliatory tariffs, granting America’s major trading partners more time to reach new agreements that Washington views as “fairer.” Now, as the White House’s July 9 deadline approaches, only two official trade deals have been finalized—one with the United Kingdom and another with Vietnam. As for China, merely a fragile temporary truce has been reached, which has so far prevented any additional tariffs from being enforced.
Although reports suggest promising progress in negotiations with India, Japan, and South Korea, no final agreements have been secured with these countries yet. Interestingly, talks with the European Union—which had previously stalled—have suddenly taken a positive turn, and prospects for a deal with Canada in the coming days have also improved.
However, given the limited time left, it seems unlikely that trade agreements with all of America’s 18 key partners will be reached before the deadline. This situation has raised a critical question for the markets: Will Trump set a new deadline for the remaining countries, or will the suspended tariffs be reinstated?
The prevailing view is that the U.S. president will once again resort to threats before granting any extensions—this time not merely by reviving the “Liberation Day” tariffs, but also by promising even heavier tariffs to extract the last concessions from the remaining trade partners.
U.S. Treasury Secretary Scott Bassett stated that if no agreements are reached by August 1, tariffs will revert to the levels announced in April. He also emphasized that Washington’s core strategy in these trade talks is to apply maximum pressure. According to Bassett, letters will be sent to various countries, outlining the August 1 deadline for reaching deals. This news, which broke during the market’s closing hours, sparked a wave of risk appetite in the financial markets.
In a week when the U.S. economic calendar is notably devoid of major data releases, investors are focusing their attention on the minutes from the Federal Reserve’s June FOMC meeting—a document that could offer fresh insights into the trajectory of interest rates for the second half of the year.
June’s strong employment report, which exceeded market expectations, has effectively dashed hopes for an interest rate cut this month. Now, if the positive economic momentum persists, the likelihood of a rate cut in the September meeting may also gradually be priced out by the markets.
According to data from Challenger, Gray & Christmas, U.S. employers announced 47,999 job cuts in June, marking a sharp decline from 93,816 in the previous month. Compared to June of last year, layoffs have dropped by 2%. However, total job cuts in the second quarter of 2025 reached 247,256—a 39% increase from the same period last year (177,391) and the highest second-quarter layoff figure since 2020.
With no significant economic reports scheduled for the coming days, investors will be closely analyzing Wednesday night’s Fed minutes and the limited remarks from central bank officials—statements where every word has the potential to significantly move the markets.

Nasdaq Approaches 23,000 Mark for the First TimeOver the past five trading sessions, the U.S. Nasdaq index has posted a gain of more than 1.5%, supported by a recent rise in market confidence that has pushed the equity index to new all-time highs. The NFP employment data released yesterday surprised markets with 147,000 new jobs, compared to the 111,000 expected, reflecting a recovery in the labor market that could ultimately support domestic consumption in the U.S.. This has helped maintain investor confidence in equities, supporting a bullish bias in the Nasdaq in recent sessions.
Sustained Uptrend
Since the early days of April, the Nasdaq has maintained a solid upward trend, with no relevant signs of selling pressure that would threaten the current bullish structure. As a result, the long-term bias remains clearly bullish within the broader market outlook. However, it's worth noting that a growing sense of indecision has emerged in recent sessions, reflected in the candlestick patterns, which could open the door to short-term bearish corrections.
Technical Indicators
MACD: The MACD histogram continues to hover around the neutral zero line, indicating a balance in moving average strength during recent sessions. If this pattern continues, it may result in a more defined period of price neutrality in the short term.
RSI: The presence of consistent RSI highs, alongside higher price highs in the Nasdaq, has led to the formation of a bearish divergence. This suggests that market equilibrium has been affected by recent bullish momentum, and could lead to price pullbacks in the upcoming sessions.
Key Levels to Watch:
23,000 – Psychological barrier: A tentative resistance level in the short term due to the lack of clear technical references. A breakout above this level could reinforce the current bullish bias and signal a more sustained upward trend.
21,800 – Nearby support: An area aligned with a recent neutral technical zone, which may act as relevant support in the event of a short-term pullback.
21,000 – Key support: A level that coincides with the 50-period simple moving average. A break below this level could put the current bullish structure at risk and pave the way for a more significant downward move.
Written by Julian Pineda, CFA – Market Analyst

US100 — New ATH Trading SetupThe price recently previous ATH at the 22730 level. Current ATH is marked near 22,800, with a POC at 22,640.
Potential support around 22,500, below POC.
Watch for a bounce or further rise beyond 22,920.
Buyers probably will push right through 23,000 level today on Micros and Minis.

USNAS100 Key Level: 22,740 – Will the Trend Continue or Reverse?USNAS100 Update – Bullish Momentum Holds Above 22,740
USNAS100 has continued to push higher, following through as expected from yesterday’s analysis.
The index maintains bullish momentum as long as it trades above the key pivot at 22,740.
However, a 1H close below 22,730 could trigger a bearish correction toward 22,615.
A sustained break below that level may shift the trend to bearish.
Key Levels:
• Resistance: 22,870 / 23,000
• Support: 22,615 / 22,410

Nasdaq-100 H4 | Bullish uptrend to extend higher?The Nasdaq-100 (NAS100) is falling towards a swing-low support and could potentially bounce off this level to climb higher.
Buy entry is at 22,509.40 which is a swing-low support that aligns closely with the 23.6% Fibonacci retracement.
Stop loss is at 22,150.00 which is a level that lies underneath an overlap support and the 38.2% Fibonacci retracement.
Take profit is at 23,264.68 which is a resistance that aligns with the 61.8% Fibonacci projection.
High Risk Investment Warning
Trading Forex/CFDs on margin carries a high level of risk and may not be suitable for all investors. Leverage can work against you.
Stratos Markets Limited (tradu.com ):
CFDs are complex instruments and come with a high risk of losing money rapidly due to leverage. 63% of retail investor accounts lose money when trading CFDs with this provider. You should consider whether you understand how CFDs work and whether you can afford to take the high risk of losing your money.
Stratos Europe Ltd (tradu.com ):
CFDs are complex instruments and come with a high risk of losing money rapidly due to leverage. 63% of retail investor accounts lose money when trading CFDs with this provider. You should consider whether you understand how CFDs work and whether you can afford to take the high risk of losing your money.
Stratos Global LLC (tradu.com ):
Losses can exceed deposits.
Please be advised that the information presented on TradingView is provided to Tradu (‘Company’, ‘we’) by a third-party provider (‘TFA Global Pte Ltd’). Please be reminded that you are solely responsible for the trading decisions on your account. There is a very high degree of risk involved in trading. Any information and/or content is intended entirely for research, educational and informational purposes only and does not constitute investment or consultation advice or investment strategy. The information is not tailored to the investment needs of any specific person and therefore does not involve a consideration of any of the investment objectives, financial situation or needs of any viewer that may receive it. Kindly also note that past performance is not a reliable indicator of future results. Actual results may differ materially from those anticipated in forward-looking or past performance statements. We assume no liability as to the accuracy or completeness of any of the information and/or content provided herein and the Company cannot be held responsible for any omission, mistake nor for any loss or damage including without limitation to any loss of profit which may arise from reliance on any information supplied by TFA Global Pte Ltd.
The speaker(s) is neither an employee, agent nor representative of Tradu and is therefore acting independently. The opinions given are their own, constitute general market commentary, and do not constitute the opinion or advice of Tradu or any form of personal or investment advice. Tradu neither endorses nor guarantees offerings of third-party speakers, nor is Tradu responsible for the content, veracity or opinions of third-party speakers, presenters or participants.

USNAS10 Faces Key Test at 22,615 Ahead of NFP VolatilityUSNAS100 – Key Levels Ahead of Major News
Today’s economic data releases (NFP, Unemployment Rate, etc.) are expected to drive volatility in the market. Traders should watch key levels closely.
Technical Outlook (USNAS10):
• Price is attempting to test 22,615.
• If it holds above 22,615, the bullish momentum is likely to continue.
• However, if price stabilizes below 22,615 on the 1H chart, further downside toward 22,420 is expected before a potential bullish reversal begins.
A breakout above 22,740 could trigger further upside toward 23,000
Key Levels:
• Resistance: 23,000 / 23,100
• Support: 22,420 / 22,280

NASDAQ price dropAfter the Nasdaq price reaches around 23642.2, a historic drop will occur and the target is to drop to 16308.
Whatever happens at the highest price, the final destination is towards 16308.
I have identified the price levels in the middle of this expected drop that can cause the price to correct.
IG:NASDAQ

EURUSD BULISH OR BEARISH DETAILED ANALYSISEURUSD has been playing out exactly as forecasted, now trading confidently above the key 1.17 handle. Price action has respected prior structure levels perfectly, with the recent bullish impulse forming clean higher highs and higher lows. After a minor corrective move and successful retest of the previous breakout zone, we’re now seeing continuation momentum build toward the 1.21 target. This pattern is a textbook bullish flag followed by a clean breakout and retest, confirming the strength behind this current upside leg.
Fundamentally, the euro has gained strength due to growing divergence between the ECB and the Fed. With inflation in the Eurozone stabilizing and recent data indicating a modest recovery in manufacturing and services PMI, there's increasing speculation the ECB may hold rates longer, while the Fed is seen leaning toward eventual rate cuts as US labor data softens. The June NFP miss and downward revisions in prior data have weakened the USD’s position, creating a favorable environment for EURUSD bulls.
The technical confluence with macro fundamentals is striking. Risk sentiment is improving across global markets as inflation fears ease and rate clarity emerges. The euro remains supported by strong capital inflows and demand for yield stability. Additionally, EURUSD has cleared multi-month resistance zones with conviction, signaling institutional interest and momentum-based positioning. The recent candle formations suggest buyers are in firm control.
We remain on track for the 1.21 level, which aligns with prior swing highs and a key Fibonacci extension target. Any pullback toward the 1.16–1.1650 region should be viewed as a high-probability buying opportunity. With the DXY under pressure and euro zone resilience improving, EURUSD continues to be one of the top-performing major pairs heading into Q3. Stay patient and ride the wave—this move has more room to run.

USNAS100 Bullish Momentum Holds Above Key PivotUSNAS100 – Overview
The price successfully retested the 22,610 level and resumed its bullish trend, reaching 22,750 as anticipated in our previous idea.
Currently, the index needs to maintain stability above the 22,610 pivot line to sustain the upward momentum toward the next resistance at 22,790. A sustained move above this level may open the path toward 23,000.
However, a 1H candle close below 22,610 could trigger a corrective move down to 22,480. A break below this support would expose the next key level at 22,280.
Pivot: 22,610
Resistance: 22,790 – 23,000
Support: 22,480 – 22,280

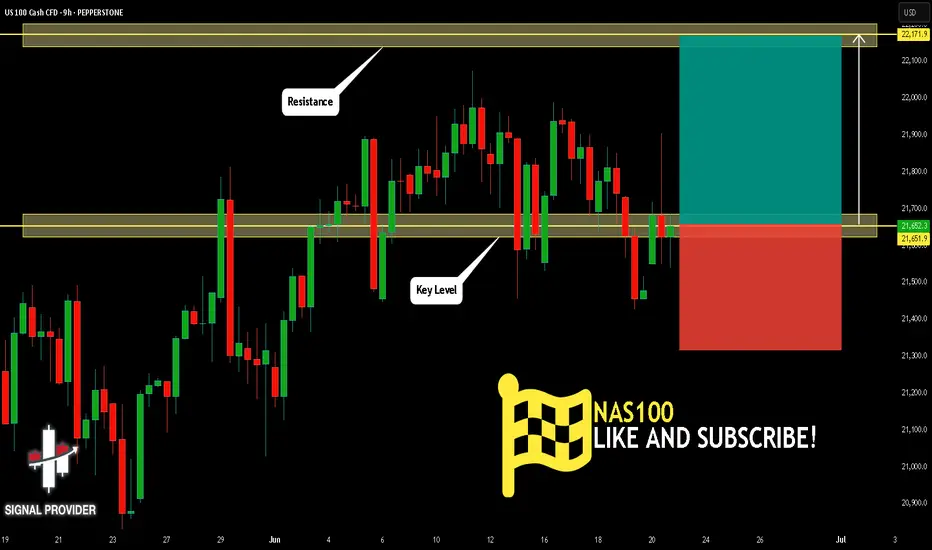
NAS100 Will Go Up From Support! Buy!
Please, check our technical outlook for NAS100.
Time Frame: 9h
Current Trend: Bullish
Sentiment: Oversold (based on 7-period RSI)
Forecast: Bullish
The market is approaching a key horizontal level 21,651.9.
Considering the today's price action, probabilities will be high to see a movement to 22,171.9.
P.S
We determine oversold/overbought condition with RSI indicator.
When it drops below 30 - the market is considered to be oversold.
When it bounces above 70 - the market is considered to be overbought.
Disclosure: I am part of Trade Nation's Influencer program and receive a monthly fee for using their TradingView charts in my analysis.
Like and subscribe and comment my ideas if you enjoy them!
NAS100 - The stock market is breaking the ceiling!The index is above the EMA200 and EMA50 on the four-hour timeframe and is trading in its medium-term channels. If it does not increase and corrects towards different zone, it is possible to buy the index near the reward.
Following a strong rally in U.S.equities, the S&P 500 and Nasdaq indices both achieved new all-time highs on Friday. It marks the first time since February that the S&P 500 has surpassed its previous peak, while the Nasdaq entered fresh price territory for the first time since December.
Despite ongoing market focus on economic data and the Federal Reserve’s interest rate policy path, the simultaneous surge in both indices reflects a renewed appetite for risk in the stock market—an appetite that has been accelerating since mid-April, especially in tech stocks.
In contrast, the Russell 2000 index, which tracks small-cap U.S. companies, still remains significantly below its prior high. To return to its October levels, it would need to rise over 13.5%. However, Friday’s 1.7% gain suggests capital is beginning to flow more broadly into underrepresented sectors.
Analysts argue that a strong breakout in the Russell 2000 could signal a broader rotation toward increased risk-taking—possibly driven by optimism over future rate cuts, easing inflation, and improved business conditions in the second half of the year.
Now that the S&P 500 has reached new highs and the Nasdaq has joined in, attention turns to the Russell 2000. If it begins to accelerate upward, markets could enter a new phase of sustained bullish momentum.
Following a week focused on gauging U.S. consumer spending strength, the upcoming holiday-shortened week (due to Independence Day) will shift attention to key employment and economic activity data.
On Tuesday, markets await the ISM Manufacturing PMI and the JOLTS job openings report. Wednesday will spotlight the ADP private employment report, and Thursday—one day earlier than usual due to the holiday—will see the release of several crucial figures, including the Non-Farm Payrolls (NFP), weekly jobless claims, and the ISM Services Index.
Currently, investor reaction to Donald Trump’s tariff commentary has been minimal. Market participants largely believe that any new tariffs would have limited inflationary effects and that significant retaliation from trade partners is unlikely.
Friday’s PCE report painted a complex picture of the U.S. economy. On one hand, inflation remains above ideal levels; on the other, household spending is showing signs of fatigue—a combination that presents challenges for policymakers.
Inflation-adjusted personal consumption fell by 0.3%, marking the first decline since the start of the year and indicating a gradual erosion of domestic demand. While wages continue to rise, their impact has been offset by declining overall income and reduced government support. To maintain their lifestyle, households have dipped into their savings, driving the personal savings rate down to 4.5%—its lowest level this year.
On the inflation front, the core PCE price index—the Fed’s preferred inflation gauge—rose 2.7% year-over-year, slightly above expectations. Monthly inflation also increased by 0.2%. Although these figures appear somewhat restrained, they remain above the Fed’s 2% target, with persistent price pressures in services—particularly non-housing services—still evident.
Altogether, the data suggest the U.S. economy faces a troubling divergence: weakening household income and consumption could slow growth, while sticky inflation in the services sector—especially under a potential Trump tariff scenario—could limit the Federal Reserve’s ability to cut interest rates.
NASDAQNASDAQ If the price cannot break through the 22728 level, it is expected that the price will drop. Consider selling the red zone.
🔥Trading futures, forex, CFDs and stocks carries a risk of loss.
Please consider carefully whether such trading is suitable for you.
>>GooD Luck 😊
❤️ Like and subscribe to never miss a new idea!
