NASDAQ: Minor Pullback, Still on TrackOn Friday, the Nasdaq experienced a slight pullback, which was quickly absorbed at the start of the week. Currently, the index is still developing the turquoise wave B, which should top out just below resistance at 23,780 points, signaling the start of the bearish wave C. This move should lead to the low of the magenta wave (4) within our turquoise Target Zone between 17,074 and 15,867 points. Alternatively, there is a 42% probability that wave alt.(4) is already complete. In this scenario, the magenta wave alt.(5) could carry the index immediately above the mentioned resistance.
📈 Over 190 precise analyses, clear entry points, and defined Target Zones - that's what we do.
US NAS 100

NAS100 LongNow that we have an official strong bullish close breaking previous highs on the weekly and monthly time frame. We will look for a potential pullback. The 3M candle is currently on track to closing as a strong bullish engulfing. Also, a 1M morning start followed up by a bullish momentum candle.

USTECH Long opportunity USTECH is currently on a bullish impulse move, sitting at the resistance level of 22,000. price is trading above the 50 SMA and we can see momentum favors the bulls with the RSI above the 55 level
Expecting a drop in price, based on the technical analysis, where we could potentially see a retest of of the 21,800 price level before the bullish trend resumes beyond 22,000.
Fundamentals with the Iran Israel cease fire support further bullish indices with confidence coming back into the markets.

NAS100 Bullish Breakout SetupNAS100 Bullish Breakout Setup 🚀
🧠 Chart Analysis (H4 timeframe)
🔹 Ascending Channel:
Price has been trending inside a clear ascending channel (blue zone), supported by higher highs and higher lows.
🔹 Support & Resistance:
Support: Around 21,635.32 – tested multiple times (highlighted by 🔵 arrows).
Resistance: Around 22,265.19 – recent highs and psychological barrier.
🔹 Double Bottom Formation 👣:
Near support zone, a potential double bottom (bullish reversal pattern) is visible. The neckline has been challenged.
🔹 Breakout Confirmation 🟢:
Price has broken above the descending neckline of the double bottom and is hovering near 21,644, indicating potential bullish continuation if sustained.
🔹 Target 🎯:
Projected breakout target lies at 22,265.19, aligning with the previous resistance zone.
🔹 Volume & Momentum 📊:
While not shown, a breakout above the neckline generally needs strong volume confirmation to validate the move.
📌 Conclusion:
If price sustains above the 21,635 – 21,644 area and gains momentum, the path to 22,265 looks likely ✅. However, a false breakout could drag the price back into the channel.

NAS100 live trade execution 10k profit and breakdown Seven fundamentals for the week: Iran-Israel war, Fed to fire up tariff-troubled markets
Premium
When will the Fed cut interest rates? That question competes with the Israel-Iran war and the fate of the tariffs America slaps on its peers. US retail sales and interest rate decisions in Japan and the UK keep things lively as well.

NAS - TIME TO MAKE ACTIVE TRADER ROOM GREATER AGAIN!Team, last week we got a good entry on both DOW/US30 AND NAS100/TEC100
Yes, i do know about the situation with ISRAEL AND IRAN.
This will drag on for at least 3-6 months for the solutions
however, I expect the cease fire should be stop within next week as President Trump's is negotiation with Iran
There are two strategy to trade for the NAS- NASTY market
Rule: make sure you calculate how much position and volume you are taking risk on the trade. Every time you enter, ensure you are understood each trade risk.
As I always do.
The last 90 days we have not losing a single trade - check my new video release soon.
OK, lets get back to the trade set up again
entry small volume at market now.
If market falling down during US session, buy more at the second setting
However, I expect the 1st setting likely to recover soon.
Jump on board now.
See you to the moon

update TP for NASDAQ i see more ups for NASDAQ .The Nasdaq index touched strong support, so I think it will rise further, as shown.

-(update)- Opportunity for buying NASDAQ After careful observation and relying on support and resistance, I see an upward movement from the support represented in front of you.


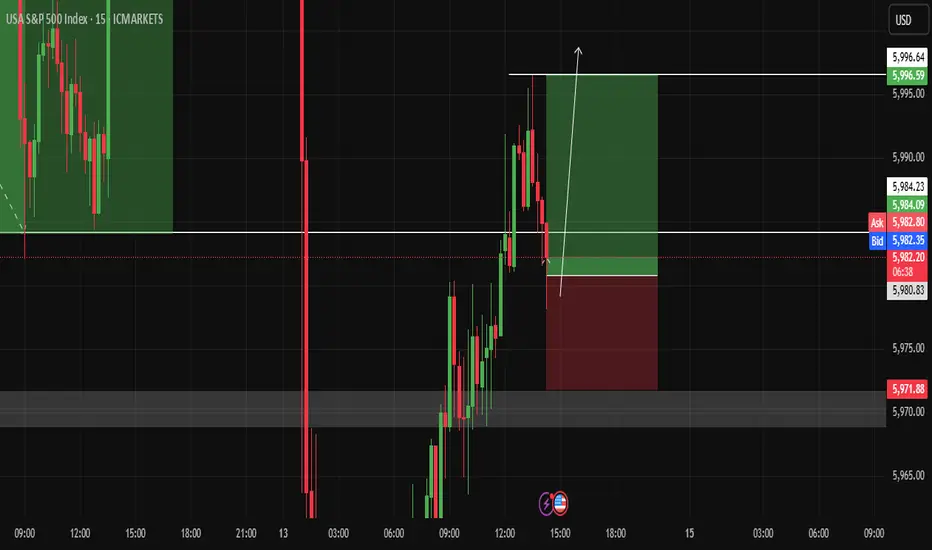
Opportunity to buy NASDAQBy combining support and resistance, I see NASDAQ rising to 5996 before reaching to 5971
NAS - LOOKING FOR RECOVERTeam This morning we got out of beautiful SHORT on UK100
Market dumping hard due to ISRAEL'S and Iran
However we expect market to be recover during UK market opening
Please follow the price accordingly to the chart
Once it reach 1st target, take 50-70% profit reduce the volume and bring stop loss to BE
LET'S GO.

NDX CRACK!I will keep this simple.
The rising wedge broke. Markets are in trouble.
The Trump disaster keeps escalating every day.
This is what the world looks like without the US
strong leadership defending freedom and democracy. CHAOS!

NASDAQ ShortLooking for the short on Nasdaq been trading this long and short through out the week. Check the linked publications. Shouted out 22,000 before seeing the short.

NASDAQ 100 Long 21,900Target to the upside 21,900. We initially highlighted NASDAQ will reach 22,000 then see a bearish turn. Refer to linked Idea.


BUY POSITIONToday im looking at buy positions to the highlighted target continue to make higher highs


Staircase seen in real chartsFor the most part OANDA:NAS100USD has exhibited a near perfect staircase up so far.
It does appear fairly extended right now, but with rotation out of safe havens into risk on assets again, what remains to be seen is how much fuel is in the tank, and how far can the tailwind take it.

NQ (Nasdaq) Futures Trading Levels [6/11/25]For Day Traders, here's some trading levels for NQ Futures Trading for today. It's CPI day, so we should get some nice swings today. Trade carefully and trade smart!

Nasdaq will reach 25'000 still no body see it?Current level: 21,876
Previous ATH: 22,222.61
Next stop? Well… if you ask the pivot levels they're whispering "23347.20, baby."
What we’re looking at is not just a strong recovery it’s a market that refuses to take a breather. With weekly candles forming higher lows and pivot zones behaving like polite suggestions rather than resistance, it’s hard not to think the index is gearing up for a proper breakout.
Sure, skeptics will say we’re overextended. Bears will point to the volume spikes and say “exhaustion.” But momentum? She's dancing in stilettos on top of R3 like it's a catwalk.
Now, here's the fun part:
If this rhythm keeps up and if inflation, rates, and the Fed behave like decent background characters then 25,000 by the end of the year isn’t just possible. It's that slightly overconfident friend at the party who's already halfway into a celebratory toast.
So… who dares to trust the trend?
Because let’s be honest: being early is painful, being late is expensive but being in the trend? That’s just good business.
📈 Trade safe, manage risk, and don’t fight the trend. Unless you're into that kind of thrill.
#tradehills #Pscarfo

NASDAQ failed to capture hourly fair value gap multiple times.The US100 index failed to close a body above the hourly fair value gap multiple times. I would expect it to go towards sellside liquidity marked on the chart after multiple failed attempts at closing above an important level .

NASDAQBearish structure has formed, Waiting for further confirmation before looking for short positions.
SolarFX

