XAU/USD | Consolidation! (READ THE CAPTION)By examining the Hourly chart of XAUUSD, we can see that Gold has been ranging between the 4H FVG and the bearish OB. After the CPI news yesterday, Gold went up as high as 4374, before dropping again and touching the high of the 4H FVG at 4317 and then again going up and now it's being traded at 4323. Gold is now consolidating between the Bearish OB and the 4H FVG.
It's not clear yet how Gold might react in the coming hours and weeks before the new year, however, it still is possible for Gold to hit a new ATH by the end of the year.
Nasdaq

NAS100 – 30-Minute Timeframe Tradertilki AnalysisMy friends, greetings,
I have prepared a NAS100 analysis for you on the 30-minute timeframe.
My friends, if NAS100 reaches the positive levels between 25.001 and 24.951, I will open a buy position and target the 25.258 level.
My friends, I share these analyses thanks to each like I receive from you. Your likes increase my motivation and encourage me to support you in this way.🙏
Thank you to all my friends who support me with their likes.❤️

WDC - Peak PassedWestern Digital is showing a situation similar to Seagate Technology.
The upward move ended in November 2025, and the stock has entered a corrective phase.
Wave C is now underway — this will be an impulsive, strong downward move.
Targets:
139 -> 122
---
Please subscribe and leave a comment.
You’ll get new information faster than anyone else.
---

NASDAQ: Dip Buy Time! Wait For Valid Buy Setups!Welcome back to the Weekly Forex Forecast for the week of Dec. 15 - 19th.
In this video, we will analyze the following FX market: NASDAQ (NQ1!) NAS100
The NASDAQ is is still bullish, despite the leeriness toward AI and tech stocks. Profits were taken Friday, causing a bearish close on the day. But there are supporting structures for higher prices nearby, and I will personally be watching for price to contact those areas and look for valid market shifts to signal buys are in order!
Enjoy!
May profits be upon you.
Leave any questions or comments in the comment section.
I appreciate any feedback from my viewers!
Like and/or subscribe if you want more accurate analysis.
Thank you so much!
Disclaimer:
I do not provide personal investment advice and I am not a qualified licensed investment advisor.
All information found here, including any ideas, opinions, views, predictions, forecasts, commentaries, suggestions, expressed or implied herein, are for informational, entertainment or educational purposes only and should not be construed as personal investment advice. While the information provided is believed to be accurate, it may include errors or inaccuracies.
I will not and cannot be held liable for any actions you take as a result of anything you read here.
Conduct your own due diligence, or consult a licensed financial advisor or broker before making any and all investment decisions. Any investments, trades, speculations, or decisions made on the basis of any information found on this channel, expressed or implied herein, are committed at your own risk, financial or otherwise.

USNAS100 | Breakout Watch Between 25250–25100USNAS100 | Technical Overview
The price is currently consolidating between 25250 and 25100, waiting for a breakout to determine the next direction.
- A 1H candle close below 25100 will signal a bearish continuation toward 24770, with further downside potential toward 24570 and 24360.
- A 1H candle close above 25250 will support a bullish move toward 25430, and if momentum continues, the next target is 25670.
Today’s economic data will likely increase volatility. With inflation cooling and fundamentals improving, the indices market may experience bullish volatility in the short term.
Key Levels
Pivot Zone: 25250 – 25100
Support: 24770, 24570, 24360
Resistance: 25430, 25670, 25830
Bias: Breakout-dependent; fundamentals lean bullish.

US100 - Short SetupI would love to see this continue it's bearish theme, obviously the stock market open volume is what really drives this instrument. If we can stay in this position and follow a theme as indicated with the path arrows on the chart, this may well be one of the best entries this year!
We have banked a bit of profit now and running this risk free. We may be able to get multiple entries from this original signal, or in the case this resistance zone breaks and we get the remaining position tapped at entry, we have 25,250 sell zone to fall back on.

US100 - Short Position US100 H1
We have a top forming on a previous area of supply, a higher risk trade, but with high risk comes high reward. We have a 10R measured here on this position.
Failing this, we may take a loss and trade towards 25,250 price, major resistance, from here, we will look to recoup any potential loss from this trade and then some, risk management is key as always.

GOOGLE; Will we see continuation?📈 Hey Traders!
Here’s a fresh outlook from my trading desk. If you’ve been following me for a while, you already know my approach:
🧩 I trade Supply & Demand zones using Heikin Ashi chart on the 4H timeframe.
🧠 I keep it mechanical and clean — no messy charts, no guessing games.
❌ No trendlines, no fixed sessions, no patterns, no indicator overload.
❌ No overanalyzing the market; use only two time frames.
❌ No scalping, and no need to be glued to the screen.
✅ I trade exclusively with limit orders, so it’s more of a set-and-forget style.
✅ This means more freedom, less screen time, and a focus on quality setups.
✅ Just a simplified, structured plan and a calm mindset.
💬 Let’s Talk:
💡Do you trade supply & demand too ?
💡What’s your go-to timeframe ?
💡Ever tried Heikin Ashi ?
📩 Got questions about my strategy or setup? Drop them below — ask me anything, I’m here to share.
Let’s grow together and keep it simple. 👊

STX - Move BeginsFrom April to November 2025, Seagate Technology completed an upward move, forming a five-wave structure.
The first and fifth waves are roughly equal in size.
Since November, Seagate completed a corrective phase with waves A and B already formed.
Wave C is now underway — an impulsive, strong downward move is expected.
Targets:
264 -> 234 -> 209
---
Please subscribe and leave a comment.
You’ll get new information faster than anyone else.
---

NVDIA ANALYSISFirst of all, my main focus in trading is Crypto but I also examine US stocks once in a time.
As I can understand from the chart in here, there is a high possibility that Nvdia is about to face a crash.
For the ones who comes to my profile for the first time, please here me out for a bit.
Technical outlook:
I'm an Elliott analysist and I always use waves to gauge the price and as I can see by my calculations, Nvdia has already finished its short term 5 wave impulsive upward move.
Low volume and shift in market structure supports this thought as well.
Moreover, if you want a simpler explanation; there is also a head and shoulders pattern formed right in here as well which also signaling a contuniuation thorugh downwards.
What I believe is that there is a high chance for a double Zig-Zag corrective pattern to form for the long run. For now, let's focus on the demand zone. I believe that zone will be the first A point of A-B-C corrective Zig-Zag move.
Fundemental factors:
Today we have witnessed that US has announced its inflation is way lower than expectation (%2.7). Expectation was way too much (%3.1) and it means that FED will not be willing to cut the interest rates for the new quarter of the new year which is going to be very bearish.
Moreover, Tomorrow Bank of Japan (BOJ) will announce its interest rate hike. The problematic thing is that some officials and bank menagers from Japan pointed out that Japan may actually want to increase its intertest rates even more next year by March 2026.
The biggest problem about the news lies just in here.
Yes, FED is pumping more money to people and Trump is going to be doing tax refunds and all but we can't ignore the macro news and other events.
I believe that 2026 will start very bad for the markets like Crypto or Nasdaq but I also see a very green light in the end of the tunnel as well. Second quarter might be way more profitable if you play this carefully.
Thanks for reading.

Tilray: 80% gains!TLRY shares have made significant strides, boasting a gain of over 80%. Currently, the price continues to develop within orange wave iii, aiming to surpass the resistance at $23.20 in the next phase. A drop below the support at $3.51, however, would trigger our alternative scenario. In this case, it implies that the large beige wave alt.W is not yet complete (Probability: 33%).

QQQ mid-term TANasdaq uptrend is still not fully restored, and it's having a negative trampoline move, the recent pump is overbought on indicators, watch out for the correction in the near future.
If SMA50 test won't be successful then it may go down to test the previous lows again, watch the blue line as a pivot for the support.

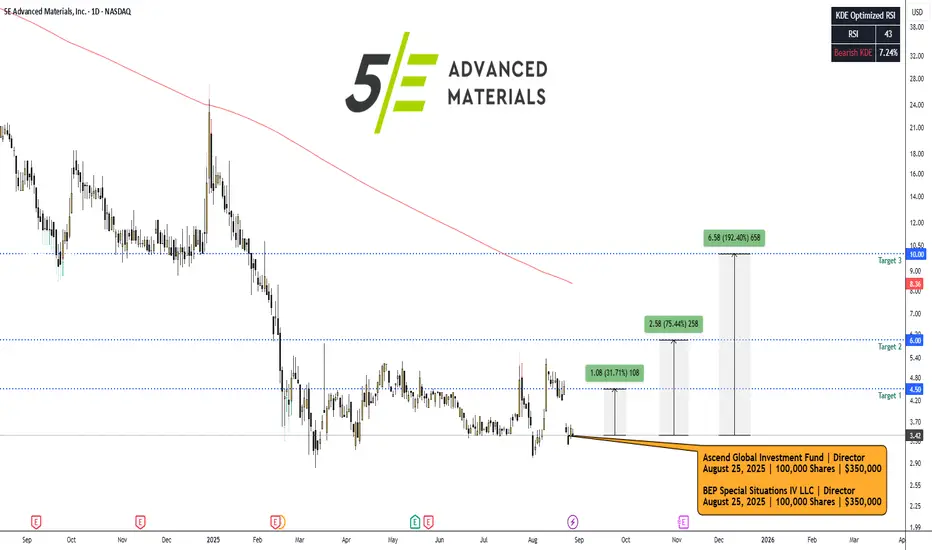
FEAM — 5E ADVANCED MATERIALS. August 27, 2025.NASDAQ:FEAM #FEAM — 5E ADVANCED MATERIALS (NASDAQ:FEAM) Insider Purchase Analysis | Basic Materials | Specialty Chemicals | USA | NASDAQ | August 27, 2025.
Overview: This report examines the recent insider purchases of FEAM shares on August 25, 2025, in the context of the company's operational focus on boron and lithium production. FEAM, a critical minerals developer with assets in California, has faced significant share price depreciation amid market challenges in the lithium sector. The insider activity, coupled with a concurrent public offering, signals potential confidence in near-term catalysts. We provide a comprehensive analysis for institutional consideration.
1. Insider Trading Context
Buyers and Transaction Details: On August 25, 2025, BEP Special Situations IV LLC (a director-affiliated entity) purchased 100,000 shares at $3.50 per share, increasing its holdings to 7,597,349 shares.
Similarly, Ascend Global Investment Fund SPC - Strategic Segregated Portfolio (potentially related) acquired 100,000 shares at the same price, bringing combined indirect beneficial ownership to 7,830,646 shares.
Additionally, CEO Paul Weibel III bought 1,628 shares, and CFO Joshua Malm purchased 1,425 shares, both at $3.50. These transactions coincide with the closing of an $8.31 million public offering of common stock at $3.50 per share, raising capital for operational advancements.
Size and Significance: The director/fund purchases represent the bulk of the activity, totaling ~$350,000 per entity, while executive buys are smaller (~$5,000–$6,000 each). Insider ownership stands at 79.00%, with recent transactions boosting it by 1.16%. Top holders include Bluescape Energy Partners LLC (37.45% of outstanding shares).
Bullish Signal Interpretation: Insider buys at depressed prices, especially amid a capital raise, often indicate confidence in undervaluation or upcoming catalysts. This aligns with FEAM's focus on boron (stable pricing at ~$757/MT in the U.S.) and lithium (recovering demand from EVs).
The stock rose 7.82% on August 26, 2025, post-announcement, suggesting market recognition of this vote of confidence. High insider ownership (79%) reduces agency risks and aligns interests with shareholders.
Charts:
• (1D)
• (5D)
• (1H)
Insider Trades:
FEAM Ownership:
SEC From 4:
www.sec.gov
www.sec.gov
2. Technical Analysis
Chart Overview (1-Year View): FEAM has been in a prolonged downtrend since September 2024, declining from ~$24 to $4.20 by August 2025, reflecting sector pressures.
A sharp drop in December 2024 (from $20 to $10) marked a breakdown below key support, followed by consolidation around $4–$6. The descending trendline (purple) connects highs from October 2024 onward, acting as resistance. Moving averages show bearish alignment: SMA20 ($3.57), SMA50 ($3.92), SMA200 ($6.34). Volume trends indicate spikes during sell-offs (e.g., December 2024, March 2025), with recent August 2025 volume elevated on the offering news.
Chart Overview (1-Month View): Short-term volatility is evident, with a bounce from $3.50 lows in late June to $5.00 highs in mid-August, followed by a pullback to $3.42. Candlestick patterns include a bullish engulfing on August 7–11 (green candles with volume spike), but recent red candles suggest profit-taking. RSI (14) at 38.40 indicates approaching oversold territory, potentially signaling a reversal if buying momentum builds.
Key Levels and Indicators:
• Support: $3.00 (psychological floor, recent lows), $2.82 (52-week low).
• Resistance: $4.00 (near-term), $5.00 (mid-August high), $6.00 (SMA200 convergence).
• Trendlines: Bearish descending channel intact; a break above $4.00 could invalidate.
• RSI/MACD: RSI neutral-to-oversold (38.40); MACD not shown but implied convergence on pullback suggests potential bullish crossover if volume supports.
• Volume and Patterns: Average volume 35K; recent spikes (e.g., 131K on August 27) correlate with news. No clear reversal patterns yet, but insider buys at $3.50 may establish a base.
➖➖➖
3. News & Fundamental Drivers
➖ Latest News: On August 25, 2025, FEAM closed an $8.31 million public offering to fund project development, including its Fort Cady boron-lithium project. An updated technical report was released on August 12, 2025, highlighting resource estimates. The company presented at the Sidoti Micro-Cap Conference on May 22, 2025.
➖ Earnings Reports: Fiscal Q3 2025 (ended March 31, 2025, reported May 15, 2025) showed EPS of -$1.68, missing estimates of -$1.31 by $0.37. TTM EPS stands at -$16.11, with no sales reported (pre-commercial stage). ROA -44.56%, ROE -82.77%, reflecting development-phase losses. Next earnings expected September 8, 2025.
➖ Sector Outlook: The boron market is projected to grow from $3.63B in 2025 at >4% CAGR, driven by glass, ceramics, and agriculture demand. Lithium supply currently outpaces demand, stabilizing prices in 2025, but EV battery growth forecasts >400 GWh demand by year-end, with potential shortages ahead.
Catalysts include U.S. tariffs on imports, FEAM's domestic production advantages, and project milestones (e.g., commercial boron output).
➖➖➖
4. Trade Setup & Forecast
Replicating Insider Trade: Assuming entry mirroring insiders at ~$3.50 (current price $3.42 offers a slight discount).
Entry Price: $3.42–$3.50.
Price Targets:
➡️ Short-term (1–3 months): $4.50 (break above resistance, +31.6%).
➡️ Mid-term (3–6 months): $6.00 (SMA200 test, +75.4%).
➡️ Long-term (6–12 months): $10.00 (channel breakout, +192.4%).
We recommend a Strong Buy with 25–35% potential upside over the next 6 months, targeting $4.50–$4.75 on project milestones.
Disclaimer: This report is for informational purposes only and does not constitute investment advice. Past performance is not indicative of future results.
META Momentum Builds! Bullish Swing Trade Roadmap🚀 META: The Layered Entry Swing Play - AI Momentum Revival 📈
Executive Summary 💼
META Platforms sits at a pivotal technical juncture where institutional AI capex demand collides with short-term profit-taking. This swing trade targets the $720 resistance breach using a disciplined layered entry methodology — perfect for risk-managed traders seeking 3-5% upside with controlled downside.
📊 Trade Setup | Master Plan
Asset: 🔵 META (NASDAQ) | Meta Platforms, Inc.
Timeframe: Swing Trade (4-6 weeks)
Bias: 🟢 BULLISH (Support Zone Recovery)
Risk Appetite: Moderate to Aggressive
🎯 Entry Strategy | The Intelligent Layering System
Rather than chasing a single entry price, we employ a pyramiding buy-in method across key support zones. This reduces emotional trading and improves risk-reward at scale.
Multi-Layer Entry Points (Buy in Tranches):
Layer 1 (Initial Position): $638.50 — 2% account risk
Layer 2 (Dip Catch): $630.00 — 2% account risk
Layer 3 (Strength Reload): $650.00 — 2% account risk
Layer 4 (Breakout Confirmation): $660.00 — 1.5% account risk
Total Allocation: ~7.5% per full setup (adjust per your risk tolerance)
Rationale: Layering avoids the emotional cost of "missing" an entry and distributes your execution cost—professional traders call this dollar-cost averaging on entries.
🛑 Stop Loss | Discipline Wins Wars
Hard Stop: $610.00
Reasoning: Below this level, the daily chart's support at the 200-EMA fails. Loss = ~4-5% from average entry ($645), which is reasonable swing risk.
⚠️ DISCLAIMER: This stop-loss level is MY analysis only. You remain fully responsible for your risk. Consider your account size, leverage, and emotional tolerance before committing capital. Never risk more than 2% per trade.
🎪 Target Strategy | Know When to Take Profits
Primary Target (Resistance Police Force): 📍 $720.00
Why $720 Matters:
328-Period SMA (4-hour chart) typically acts as resistance during consolidated ranges
Overbought Territory Signal: RSI creeping above 70 = profit-taking zone
Technical Trap Warning: Large sellers often cluster here after gaps up
Psychological Level: Round numbers ($720) trigger algorithmic selling
Escape Plan: When price approaches $720, take 50% off the table to lock profits. Let remaining 50% run with a trailing stop at +3% below entry.
⚠️ DISCLAIMER: This target is NOT guaranteed. META could face: regulatory headwinds, macro rate shock, or competitor moves. You decide your exit—never marry a target. Protect your capital first.
📡 Related Pairs to Monitor (Correlation Watch) 🔗
1️⃣ NASDAQ:GOOG (Google / Alphabet Inc.) — POSITIVE CORRELATION (+0.82)
Key Insight: Both compete in AI advertising and data-center infrastructure. If GOOG rallies, META usually follows.
Watch: GOOG breaks above $200 = risk-on sentiment for META.
2️⃣ NASDAQ:TSLA (Tesla, Inc.) — MODERATE POSITIVE CORRELATION (+0.71)
Key Insight: Both are "mega-cap AI/Tech bets." TSLA weakness can drag META down (flight to safety).
Watch: TSLA support breaks = potential META correction into your layers.
3️⃣ NASDAQ:AMZN (Amazon.com) — POSITIVE CORRELATION (+0.76)
Key Insight: AWS AI infrastructure play; if AMZN capex concerns flare, META suffers (shared narrative).
Watch: AMZN guidance = signal for META's data-center spend outlook.
4️⃣ AMEX:SPY (S&P 500 ETF) — MODERATE CORRELATION (+0.68)
Key Insight: Macro beta. Fed rate decisions move SPY; SPY moves all mega-caps.
Watch: CPI data Dec 18, 2025 at 8:30 AM ET = critical catalyst.
5️⃣ TVC:VIX (Volatility Index) — NEGATIVE CORRELATION (-0.55)
Key Insight: Rising VIX = fear. META can gap down on broad market panic.
Watch: VIX above 20 = consider tightening your stop or waiting for another layer signal.
💡 Key Technical Confluences
✅ Why This Setup Works:
Layered entries = you're never "too early" or paying too much
52-week range sits between $480–$796 (META has room to $720) 📈
Analyst consensus = "Strong Buy" with targets ~$832 median
AI capex narrative = earnings growth driver into Q1 2026
Dividend pay date Dec 23 = pre-holiday consolidation likely
❌ Risks to Abort:
Breaking below $610 = trade is invalid; exit immediately
Regulatory shock (FTC enforcement) = gap down risk
Macro CPI shock Dec 18 = volatility surge, potential liquidation
Competitive loss to GOOG/AMZN AI = narrative reversal
📈 Risk Management Checklist
Before you trade this setup:
Do you understand layering reduces timing risk? ✅
Is your stop at $610 within your risk tolerance? ✅
Have you calculated max loss? (e.g., 7.5% × 2% per layer = ~$150 per $1000 risked) ✅
Is $720 target realistic in 4-6 weeks? (YES—analyst upside + technical confluence) ✅
Will you stick to your exit plan, or will greed override? ⚠️ (This is the real test!)
🎬 Action Plan | Execution Timeline
Week 1 (Dec 18–22): Place Layer 1 & 2 buy orders. Watch CPI data (Dec 18, 8:30 AM ET).
Week 2–3: Scale into Layers 3 & 4 on any dips. Monitor GOOG/AMZN correlation.
Week 4–6: Approach $720; take 50% profit at resistance. Manage trailing stop on remainder.
Exit Plan: TP hit = reduce risk. SL hit = accept loss, move on. No "hope trading."
📝 Disclaimer & Fun Caveat
🎭 This is a "playful but serious" swing-trade idea. It's designed for entertainment AND education—think of it as how a mischievous but disciplined trader (our "thief trader OG") approaches META with style, humor, and risk management.
✨ Closing Thought
If you find value in this analysis, a 👍 and 🚀 boost is much appreciated — it helps me share more setups with the community!
#META #SwingTrade #TechStocks #AITheme #LayeredEntry #TradingView #StockMarket #NASDAQ #Bullish #MoneyManagement
#RiskManagement #ProfitTaking #TechnicalAnalysis #StockAnalysis #TradeSetup #LongBias #2025Trading

XAU/USD | Gold Near Previous ATH, Next Breakout in Focus!By analyzing the #Gold chart on the 4 hour timeframe, we can see that price moved exactly as expected and continued higher. Gold successfully hit the $4351 and $4359 targets and even pushed up to $4375.
Based on the main analysis, the next key target is a new all time high above $4382. Since gold has reached the very strong supply area around the previous ATH, the pullback we are seeing now is normal and has brought price back to around $4359. I expect a small correction first, followed by another bullish move and a fresh high. Targets above $4400 are clearly not out of reach.
Please support me with your likes and comments to motivate me to share more analysis with you and share your opinion about the possible trend of this chart with me !
Best Regards , Arman Shaban
The Related Analysis :

EUR/USD | EURUSD Pullback From Supply, Buyers Step Back In!By analyzing the #EURUSD chart on the 6 hour timeframe, we can see that price moved up as expected and reached the supply zone between $1.178 and $1.182. As soon as price hit this key area, selling pressure appeared and EURUSD dropped to $1.17.
After reaching this level, buyers stepped in again and demand increased. Right now, #EURUSD is trading around $1.17330. I expect to first see another upward move, and then we should watch the price reaction again at the $1.178 to $1.182 supply zone.
THE LATEST TA on EURUSD :
Please support me with your likes and comments to motivate me to share more analysis with you and share your opinion about the possible trend of this chart with me !
Best Regards , Arman Shaban

XAU/USD | CPI incoming (READ THE CAPTION)As you can see in the 4H chart of Gold, it is consolidating between the Bearish OB and the 4H FVG, mostly because it is waiting for CPI to make a move.
There's a support level at 4317 to monitor, and there's a Buyside liquidity below 4306 and another one below 4300.
Monitor these zones and make sure NOT to set an order for CPI news, cause it will without a doubt hurt you.
Hope you have a good day folks.

NASDAQ |CPI Day – Bearish Structure With Correction ExpectationsUSNAS100 | Technical Overview
The price has dropped nearly 500 points, exactly as we mentioned yesterday.
Today’s movement will be heavily influenced by the U.S. CPI release, which is expected to add significant volatility to the Nasdaq.
Technical Outlook
The market appears to be forming a short bullish correction, potentially moving slightly higher before resuming its bearish trend toward 24570.
If the price closes a 1H candle below 24810 without a corrective bounce, this will signal a continuation of the bearish move directly.
Key Levels
Pivot Line: 24940
Support: 24780, 24570, 24360
Resistance: 25100, 25210, 25420

Palantir Teases Bers at Resistance, Nasdaq Looks WeakDespite the fact that Santa's rally could see at least a temporary rise for the stock market, I still think the Nasdaq could be breaking to new cycle lows as we head into the new year. Palantir has also caught my eye for a potential short setup, given its bearish clues around resistance.
Matt Simpson, Market Analyst at City Index

Can PepsiCo Extend Higher Following This Technical Breakout?📈 ASSET OVERVIEW
Asset: NASDAQ:PEP — PEPSICO, INC
Exchange: NASDAQ
Market Type: Stock
Trading Style: Swing Trade
🧠 TRADE THESIS (BULLISH BIAS)
NASDAQ:PEP has activated a bullish structure following a Triangular Moving Average (TMA) breakout, signaling a potential trend continuation phase.
Price action confirms:
Higher lows structure 📊
Momentum expansion after consolidation
Breakout supported by trend-following averages
This setup favors controlled accumulation, not chasing.
🎯 ENTRY PLAN — STEALTH LAYERING STRATEGY
Instead of a single fixed entry, this plan uses a layered limit order approach to manage volatility and improve average price.
🔹 Layered Buy Limits (Example):
150.00
148.00
147.00
146.00
📌 You may add or adjust layers based on personal risk management and market volatility.
📌 Entry can also be taken at any price level depending on confirmation and execution style.
This method helps:
Reduce emotional entries
Improve risk-adjusted positioning
Adapt to pullbacks without panic
🛑 RISK MANAGEMENT (STOP-LOSS)
Protective Stop: 144.00
⚠️ Risk management is always trader-dependent.
This stop is a reference level, not a mandatory rule.
Adjust based on:
Account size
Risk tolerance
Timeframe preference
🎯 PROFIT OBJECTIVE
Primary Target: 158.00
This zone aligns with:
Strong historical resistance
Overbought conditions
Potential liquidity trap area
📌 Partial profit booking is encouraged near resistance.
📌 Capital protection > maximum profit.
🔍 ADDITIONAL CONFIRMATIONS TO WATCH
Volume expansion on continuation
Price holding above breakout structure
No aggressive bearish rejection near resistance
🔗 RELATED SYMBOLS TO WATCH (CORRELATION CHECK)
NYSE:KO (Coca-Cola) → Sector strength confirmation
AMEX:SPY → Overall market risk sentiment
AMEX:XLP → Consumer Staples sector momentum
📊 If AMEX:XLP & NYSE:KO remain strong, probability increases for NASDAQ:PEP follow-through.
⚠️ IMPORTANT NOTES
This is not financial advice
Market conditions can change rapidly
Always align execution with your personal trading plan
✨ “If you find value in my analysis, a 👍 and 🚀 boost is much appreciated — it helps me share more setups with the community!”
Disclaimer: This is a stealth-style trading strategy shared for educational and entertainment purposes only.
#PEP #PepsiCo #SwingTrading #NASDAQ #BullishBreakout
#LayeredEntry #TechnicalAnalysis #Stocks #TradingView

AMD - Returning Red LogoAMD has resumed its downward move, hence the “red” color and old logo feel more relevant than ever.
Wave analysis suggests further decline, with primary targets around 170 , then 155 , or somewhere in between.
---
Please subscribe and leave a comment.
You’ll get new information faster than anyone else.
---

Lam Research - Wave ContinuesLam Research is continuing its corrective move, with wave C already in progress.
Fibonacci levels indicate multiple downside targets.
Targets:
141 -> 134 -> 125
---
Please subscribe and leave a comment.
You’ll get new information faster than anyone else.
---

How I Spot Trading Opportunity – Part IILast week, we discussed how to spot trading opportunities using multiple asset classes. I also created multiple tabs for each asset class, such as currencies, commodities, and indices. Within each asset class, there are multiple products.
The whole idea is this: if you already have a trading methodology that is working well for you in a particular asset, say gold or silver, and you have been trading it for a long time, why not apply the same trading methodology across other markets?
It is not too difficult to pick up trading ideas fairly quickly from the market at any point in time. And I am going to share with you how I do that.
Micro E-mini Nasdaq Futures & Options
Ticker: MNQ
Minimum fluctuation:
0.25 index points = $0.50
Disclaimer:
• What presented here is not a recommendation, please consult your licensed broker.
• Our mission is to create lateral thinking skills for every investor and trader, knowing when to take a calculated risk with market uncertainty and a bolder risk when opportunity arises.
CME Real-time Market Data help identify trading set-ups in real-time and express my market views. If you have futures in your trading portfolio, you can check out on CME Group data plans available that suit your trading needs www.tradingview.com
