US100 – Bullish Continuation in Play After Daily OB ReactionHello traders,
On the 1-hour chart, NASDAQ (US100) has reacted strongly from the bullish Daily Order Block, showing clear signs of higher-timeframe strength. This reaction suggests that the bullish order flow is still intact.
With this structure in mind, I expect the upward move to continue toward the bearish Daily Fair Value Gap, which serves as my first target.
My final target for this bullish leg is the equal highs around 26,136, where a significant liquidity pool rests.
However, before the next expansion higher, I would prefer to see price move lower to sweep the liquidity below the recent lows and trade into an Optimal Trade Entry (OTE) zone. From there, I’ll look for lower-timeframe confirmation to catch the next leg up.
Staying bullish unless higher-timeframe invalidation occurs.
💌It is my honor to share your comments with me💌
🔎 DYOR
💡Wait for the update!
Nasdaq
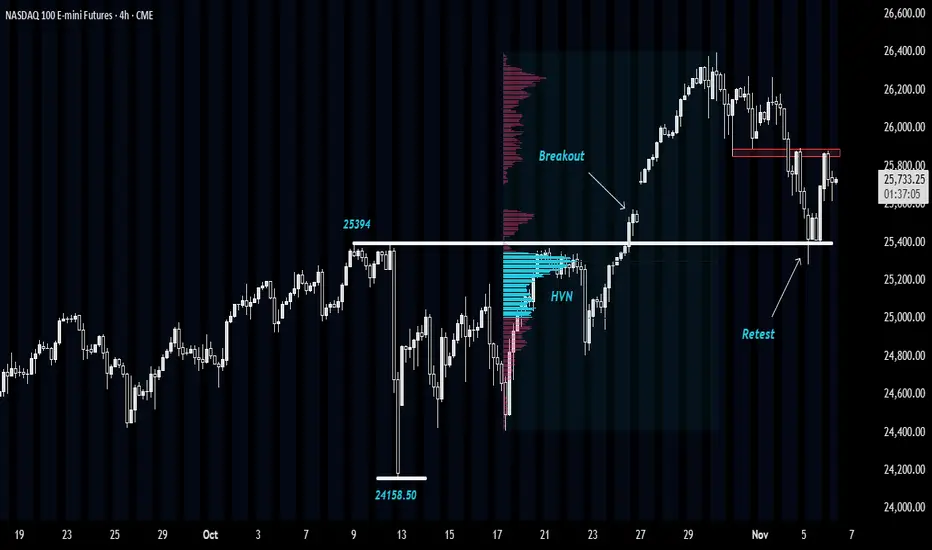
NASDAQ: Retesting Breakout ZoneThis idea is based upon successful Breakout Retest scenario near a High-Volume Node (HVN).
Let's first get to the basics:
A successful Breakout Retest -
A breakout retest scenario occurs when the price breaks through a key level of support or resistance and then returns to test that same level before continuing in the breakout direction.
For example, if the price breaks above a resistance zone, traders wait to see if the price comes back down to that zone. If it holds as new support and shows rejection candles or strong buying, that’s called a successful retest.
At a successful retest, several things typically happen:
➡The old resistance acts as new support (or vice versa in case of breakdown).
➡Traders who missed the initial breakout enter the trade, adding momentum.
➡Weak hands or short-term traders exit, cleaning up the order flow.
➡The price often accelerates in the direction of the breakout with stronger conviction and volume.
In simple terms, a successful retest confirms that the breakout was genuine and not a false move.
High Volume Node -
HVN is a price level or zone on a volume profile where a large amount of trading activity has occurred. It represents an area where buyers and sellers actively agreed on price, leading to high transaction volume.
These zones usually act as balance areas- price tends to pause, consolidate, or even reverse near them because many traders have open positions there. When price revisits an HVN, it often encounters strong support or resistance, as market participants react to protect or exit their earlier trades.
In short, an HVN marks a fair value area on the chart where market consensus was strongest.
NASDAQ Analysis -
In the Nasdaq E-mini chart, we can observe a sharp decline from 25,394 to 24,158, but without any meaningful follow-through on the downside.
Subsequently, the price reacted once again from this same zone on 21st and 22nd October, before eventually breaking above 25,394 with strong momentum to form new highs.
At present, the market has pulled back to the 25,394 level, which previously acted as resistance. This area is now holding as support, suggesting a successful retest and presenting a potential buying opportunity.
Moreover, this retest is aligning with a HVN around 25,300, further reinforcing the support zone.
In the short term, the price is facing resistance near 25,900. A conservative long entry could be considered after a sustained move above 25,900, while an aggressive low-risk entry could be initiated around 25,500, closer to support.
📣Disclaimer:
Everything shared here is meant for education and general awareness only. It’s not financial advice, nor a recommendation to buy, sell, or hold any asset. Do your own research, manage your risk, and make sure you understand what you’re getting into.
Nvidia: Acceleration Toward New Highs Nvidia gained strong upward momentum shortly after our last update, surging past the $196.45 mark, which had previously served as resistance. As a result, our prior short-term alternative scenario was triggered, and we have now adjusted the chart accordingly (with minor modifications). We now view the green wave as complete and believe that the joint top of green wave and beige wave III, as well as the low of wave IV, have already been established. The Target Zone we had initially set for the wave- low has therefore been removed. In our updated short-term alternative scenario, we still see a 30% probability of a new low for beige wave alt.IV below the $176.21 support level. In this case, however, price would likely rebound above the lower $145.50 level.

US Equities have this week left... Part IISo, yesterday heads up was given that the US Equities (and pretty much global equities generally) have this week left of bullishness.
This was observed with a TD Bear Setup perfected completion, coming into a stall. What was not mentioned was that the leading indicators of JNK, TIP and TLT were already showing signs of imminent breakdown (to understand about these three leads, refer to the book: Anatomy of the Bear by Russell Napier)
So just wanted to show it more obviously here.
While the US Equities were in a bit of a stall to close slightly positive, the three leads were clearly Bearish in the candlestick patterns with a single wipeout bearish, near marubozu, down candlestick that wiped out at least three days to two weeks of gain.
This like a slap in the morning while we are at the sweetest part of the dream.
Heads up, wake up!
Btw, with this kind of risk-off, crypto would not be spared either.
Short, sharp, sweet...
HTZ:From Breakdown to Breakout,Bullish Reversal Gaining TractionHertz Global Holdings, Inc. (NASDAQ: HTZ)
Technical Outlook: Potential Reversal Following Structural Breakout
Date : 5 November 2025
Summary
Hertz Global Holdings (HTZ) has exhibited signs of a potential medium-term trend reversal following a prolonged downtrend since mid-2023. Multiple bullish technical signals — including a breakout from key continuation patterns, RSI divergence, and sustained support retests — point toward a possible shift in market sentiment.
Price Action and Technical Developments
1. Downtrend continuation : Since July 2023, HTZ has been in a persistent downtrend, reinforced by a breakdown below major horizontal support.
2. Symmetrical triangle breakdown (Feb 2024) : The stock failed to hold within a consolidation structure, confirming bearish momentum at that stage.
3. Bullish divergence (Sept 2024) : Despite registering new price lows, the RSI formed higher highs, suggesting weakening downside momentum and potential for reversal.
4. Falling wedge breakout (Nov 2024) : Price action reversed from a classic bullish pattern, followed by a strong rally through the end of November.
5. Symmetrical triangle breakout (Apr 2025) : HTZ broke out of consolidation on elevated volume, coinciding with a break above the long-term descending trendline — a key technical inflection point.
6. Current setup (Nov 2025) : The share price is consolidating within a falling channel. On 4 November 2025, it rebounded from a confluence of supports — including the uptrend line from September 2024 and prior resistance turned support — reinforcing near-term bullish bias.
Trading Idea
Entry Zone: 4.71 - 5.50
Target: 10.50 and 15.00
Support: 4.71
Conclusion
After a long downtrend, HTZ is showing a clear shift in momentum. With multiple bullish patterns confirmed and strong support holding, the stock may be entering a new uptrend phase toward USD 10.50 and USD 15.00.

XAU/USD | Gold’s Sharp Breakdown – Bears Still in Control!By analyzing the Gold (XAUUSD) chart on the 2-hour timeframe, we can see that after several days of consolidation, price finally broke down sharply, hitting all our targets at $3,999, $3,985, and $3,947, and extending to $3,928 — delivering over 700 pips in profit.
After reaching the marked demand zone, gold bounced slightly and is now trading around $3,940. However, unless we see strong bullish momentum soon, a deeper decline remains likely. The next potential downside targets are $3,930, $3,915, and $3,905.
Further targets and updates will be shared in the next analysis.
Please support me with your likes and comments to motivate me to share more analysis with you and share your opinion about the possible trend of this chart with me !
Best Regards , Arman Shaban

DXY-USD Game PlanDXY-USD Game Plan
📊 Market Sentiment
On 29/10, the FED lowered rates by 25BPS as expected. However, Powell’s remarks introduced uncertainty regarding December’s potential cut, stating that decisions will depend on upcoming data.
One FED member dissented, preferring no cut, a shift from September’s unanimous decision.
As a result, rate cut expectations dropped from 95% to 68%, sparking short-term bullish sentiment for the USD, as traders adjusted portfolios toward defensive positioning.
📈 Technical Analysis
The Dollar Index (DXY) hit its HTF Weekly Bullish Trendline and got rejected, forming a structural reversal pattern.
We’ve now seen a break of short-term daily bearish trend, confirming strength and a potential leg higher toward 102.00 (Monthly FFVG).
📌 Game Plan / Expectations
Expecting price to wick or close above 100.25, then potentially retrace before resuming the bullish leg.
Primary upside target: Monthly FFVG zone at 102.00.
Sentiment remains bullish for the dollar short term, which may pressure risk assets (stocks and crypto) temporarily.
💬 If this DXY breakdown supports your macro view, like, comment, and follow.
For deeper insights and liquidity-based macro models, subscribe to my Substack (free access available).
⚠️ Disclaimer
This analysis is for educational purposes only and does not constitute financial advice. Always conduct your own research before trading or investing.

Bull Run Stumbles: S&P 500 Heads Toward a Potential Correction After a rough day on Wall Street, the S&P 500 dropped about 1.2%, pulling U.S. markets lower. But there’s more behind this fall than just profit-taking.
What’s Really Happening?
Warning Signs from Wall Street
Two top banking leaders raised caution. Morgan Stanley’s Ted Pick expects a 10–15% correction, calling it a “healthy normalization.”
Goldman Sachs’ David Solomon warned that tech stocks are showing bubble-like behavior, with prices running much faster than earnings.
AI Boom Driving Market Concentration
The AI craze and tech optimism have made a few mega-cap companies dominate the market. In fact, just 10 big tech firms now make up nearly 40% of the S&P 500’s total value, making the market more fragile.
Fed Confusion Adds to Uncertainty
The Federal Reserve is sending mixed signals — some officials talk about possible rate cuts by December, while others say rates should stay high because the economy is still strong.
Adding to the mess, a partial U.S. government shutdown has delayed key data, leaving investors and the Fed guessing about what’s really happening in the economy.
What the Chart Reveals
From a technical standpoint, the U.S. market’s rally has been nothing short of extraordinary. Since the April bottom near 4,835, the index has soared nearly 42%, touching a recent peak around 6,920 — and even gained about 12–13% before the latest (April 2025) pullback began.
But now, the momentum seems to be fading. The chart is flashing early warning signals — RSI divergence suggests that while prices made new highs, the underlying strength (momentum) did not. That often hints at a potential trend reversal.
If this weakness deepens, the index could correct swiftly by around 10%, targeting the 6,200–6,100 zone. And if the “healthy normalization” predicted by Morgan Stanley’s Ted Pick (a 15% drop) plays out, the index might slide further to around 5,700 — a level that would reset valuations to more reasonable territory after the sharp run-up.
Valuation Check
Let’s set aside all the opinions and headlines for a moment and focus on the key valuation metrics that truly help us understand the real picture of the U.S. market.
The Price-to-Earnings (P/E) Ratio — The Market’s Mood Meter
P/E Ratio = Current Market Price/Earnings Per Share (EPS)
So, Current Market Price = P/E Ratio*EPS
Currently, the S&P 500’s P/E ratio stands at 30.8x, with an EPS of $222.5.
When you multiply the two — 30.8 × 222.5 = roughly $6,800 — it perfectly aligns with the index’s recent market level.
Now, to find out what the fair value of the market should be, let’s use the 5-year median P/E ratio, which is around 25.4x.
Fair Market Price = 25.4*222.5 = 6,650.
This aligns perfectly with the technical chart levels, suggesting that a 15% correction would be a healthy pullback to help cool down the overheated U.S. market.
The Buffett Indicator — Market Cap vs. GDP
One of Warren Buffett’s favorite valuation tools compares the total U.S. stock market capitalization to the country’s GDP — essentially measuring how large the market has grown relative to the real economy.
At present, this ratio stands at around 224%, far above the long-term fair value range of 100–120%. Even when compared to its 5-year median level of 192%, the market still appears significantly overvalued.
To return to its median level, the ratio would need to drop by roughly:
100 = 16.6%
That’s roughly a 15–16% correction, which again perfectly aligns with both the technical chart signals and Ted Pick’s projection of a healthy market normalization.
The Bottom Line
The U.S. market’s extraordinary rally has been built on a mix of AI optimism, liquidity hopes, and investor euphoria, but the fundamentals are starting to whisper caution.
Both valuation metrics and technical signals point to the same conclusion — the market is stretched, and a 10–15% correction wouldn’t be a disaster; it would be a return to balance.
History shows that every overheated bull run needs a pause — not to end the story, but to give it a stronger foundation.
So if the coming months bring some red on the screen, smart investors will see it not as fear, but as the market taking a deep breath before its next big move.

Nasdaq: Sharp tech drop sets up critical support testNasdaq slid 2% yesterday in its sharpest tech-led drop since late summer—are we looking at a healthy correction, or could there be a deeper move ahead?
Caution returned to tech stocks as AI valuations and a handful of Big Tech earnings disappointed. The broader market also retreated, with traders watching for the next move from both the Fed and the earnings calendar.
Key drivers:
AI and semiconductor leaders like Nvidia, AMD, and Palantir led the selloff as investors questioned how much further the AI trade can run.
Hawkish remarks from multiple Fed officials raised doubts about any imminent rate cuts, even after the recent 25bp cut, fuelling profit-taking in volatile growth names.
Top Wall Street banks cautioned about stretched valuations, warning a 10–20% correction was possible as positioning remains crowded in mega caps.
Technically, the Nasdaq is pulling back from historic highs, testing median channel support with RSI retreating toward neutral. Key resistances are near 25500 and 25750, with support showing at 25200 and then under 25k.
Stay nimble and respect the potential range between 25450 and 25870 as pivotal for the next Nasdaq swing. Wait for strong resistance confirmation, but don’t ignore bounce risk if earnings and data surprise to the upside.
This content is not directed to residents of the EU or UK. Any opinions, news, research, analyses, prices or other information contained on this website is provided as general market commentary and does not constitute investment advice. ThinkMarkets will not accept liability for any loss or damage including, without limitation, to any loss of profit which may arise directly or indirectly from use of or reliance on such information.

Nasdaq Selloff Extends in Asia — But How Bad Is It, Really?Asian markets saw a second wave of selling today, with Nasdaq futures falling around 1% during Asian trade. After fielding several emails from journalists asking “why,” I can’t help but think this move may be more about technical repositioning after an extended run higher.
In this video, I walk through the monthly, weekly, and daily Nasdaq charts to share where I think we could go from here.
Matt Simpson, Market Analyst at City Index.

SMH ETF Power Move Incoming – ATR Confirms Bullish Momentum!🎯 SMH Semiconductor Heist: Bulls Loading Up! 💎🚀
📊 Asset Analysis
VanEck Semiconductor ETF (SMH) - The chip sector's flagship ETF is showing serious strength after bouncing off the ATR (Average True Range) support zone. Bulls are flexing their muscles, and momentum is building for an upside breakout. Time to plan your entry like a pro! 🧠💰
🔥 Trade Setup: The "Layered Thief" Entry Strategy
Bias: BULLISH 🐂
Strategy: Multi-layered limit order entries (maximize your position while managing risk)
🎯 Entry Zones (Layer Your Orders):
Deploy multiple buy limit orders across these price levels to build your position strategically:
Layer 1: $328
Layer 2: $332
Layer 3: $336
Layer 4: $340
Note: You can add more layers based on your capital allocation and risk tolerance. The goal is to average into the position as price consolidates before the breakout.
🛑 Risk Management
Stop Loss: $324
This level invalidates the bullish setup if breached. The ATR support zone should hold — if it doesn't, we're outta here!
⚠️ Risk Disclosure: This stop loss level is based on my analysis. However, YOU are the captain of your own ship! Adjust your risk parameters according to your account size and risk appetite. Trade smart, not reckless! 🧠
🎯 Target Zones
Primary Target: $364 (Take Profits Here!) 💰
Maximum Target: $368 (Resistance Zone/Overbought Alert) ⚠️
At $368, we're approaching a major resistance level where profit-taking, overbought conditions, and potential bull traps converge. It's the "police barricade" 🚨 — smart thieves know when to escape with the loot! Secure your gains before hitting this ceiling.
⚠️ Profit-Taking Disclosure: These are MY target levels based on technical analysis. Your profit targets should align with YOUR trading plan and risk-reward preferences. Take money when YOU feel comfortable — it's your capital, your rules! 💼
🔗 Correlated Assets to Watch
Keep an eye on these related tickers for confirmation and broader market context:
NASDAQ:SOXX - iShares Semiconductor ETF (direct sector peer)
NASDAQ:NVDA - NVIDIA (semiconductor heavyweight, major SMH component)
NASDAQ:AMD - Advanced Micro Devices (chip sector bellwether)
NYSE:TSM - Taiwan Semiconductor (global chip manufacturing leader)
NASDAQ:AVGO - Broadcom (diversified semiconductor play)
NASDAQ:QQQM / QQQ - Nasdaq 100 ETFs (tech sector correlation)
📈 Why it matters: SMH trades in sync with these assets. If they're showing strength, it confirms the bullish thesis. If they're weak, proceed with extra caution!
📈 Technical Confluence
✅ ATR support zone holding strong
✅ Bulls regaining control after retracement
✅ Volume accumulation at support levels
✅ Risk-reward ratio favors the bulls (SL: $324 → Target: $364 = solid R:R)
The technical stars are aligning for a bullish continuation move! 🌟
🎓 Trading Wisdom
This setup combines patience (layered entries), discipline (defined stop loss), and realistic expectations (conservative profit targets). The semiconductor sector is volatile but rewarding when you trade with a plan! 💼📊
✨ If you find value in my analysis, a 👍 and 🚀 boost is much appreciated — it helps me share more setups with the community!
⚠️ Disclaimer
This analysis represents the "Thief Style Trading Strategy" — a playful approach to technical analysis meant for educational and entertainment purposes only. This is NOT financial advice. Trading involves substantial risk of loss. Always conduct your own research, manage your risk appropriately, and never trade with money you can't afford to lose. Past performance does not guarantee future results. Trade at your own risk! 🎲
#SMH #Semiconductors #SwingTrading #DayTrading #TechnicalAnalysis #NVDA #AMD #ChipStocks #TradingSetup #StockMarket #BullishSetup #LayeredEntry #RiskManagement #TradingStrategy #VanEckETF #TechStocks #MarketAnalysis #TradingIdeas #PriceAction

SHORTS WINNING TODAY (ʘ‿ʘ)Michael Burry is once again betting against the market. For Nvidia, he bought puts covering about 1 million shares worth approximately $187 million. For Palantir the exposure is puts on roughly 5 million shares valued at about $912 million
Palantir, which has gained over 170% this year, but is currently down 8.8% on Tuesday after its latest quarterly results (which were good) were eclipsed by Burry and a general risk-off shift in the market. Palantir CEO, Alex Karp has called Burry out for market manipulation even though most analysts might call Palantir “overvalued”.
In crypto markets, Bitcoin has been hovering near the key $100,000 level, a price it hasn’t dropped below since June 23. If it breaks lower, traders could be watching $98,240 and then $96,975 as the next major support levels.
Ether tumbled as much as 9% on Monday, breaking below the $3,600 support after hackers stole more than $100 million from a major DeFi protocol. The decline leaves Ethereum about 25% below its August peak of $4,885.

Grab (GRAB) – Riding the Trend WaveGrab is looking grabbingly strong 😎 — making higher highs and higher lows since 7 April 2025, up almost 95% until 23 September 2025!
The stock broke out of its downtrend line from 21 Nov 2024 with big volume on 11 Sep 2025 — strong confirmation that bulls are taking charge. After the breakout, price retested the trendline (now support) twice and also bounced right from the Fibonacci 38.2% zone. Beautiful confluence! 🎯
The uptrend line from April is still holding well — as long as this stays intact, the party’s not over yet 🕺
📈 Trade Idea:
Entry zone: 5.65 – 5.37
Targets:
TP1 👉 6.60
TP2 👉 7.10
Support / Invalidation: 5.37 zone, uptrend line, or old downtrend line turned support
Summary:
Grab is acting like a true comeback kid 💪 — breakout ✔️, retest ✔️, uptrend intact ✔️.
If momentum keeps building, we might be seeing the next leg up soon! 🚀

Amazon: Break Through ResistanceAmazon shares recently surged decisively above the resistance level at $242.52. This strong rally has pushed the beige wave V significantly higher. For now, we see further upside potential for this move, until the broader wave (V) in blue is complete.

NAS100 | Bearish Momentum Extends The Nasdaq 100 fell about 2.1% (~500 points) as projected, maintaining a bearish outlook while technology stocks continued to weigh on market sentiment.
Below 25,700: Bearish continuation towards 25,340 → 25,230 → 25,000.
Above 25,700: Short-term recovery towards 25,820 → 26,170.

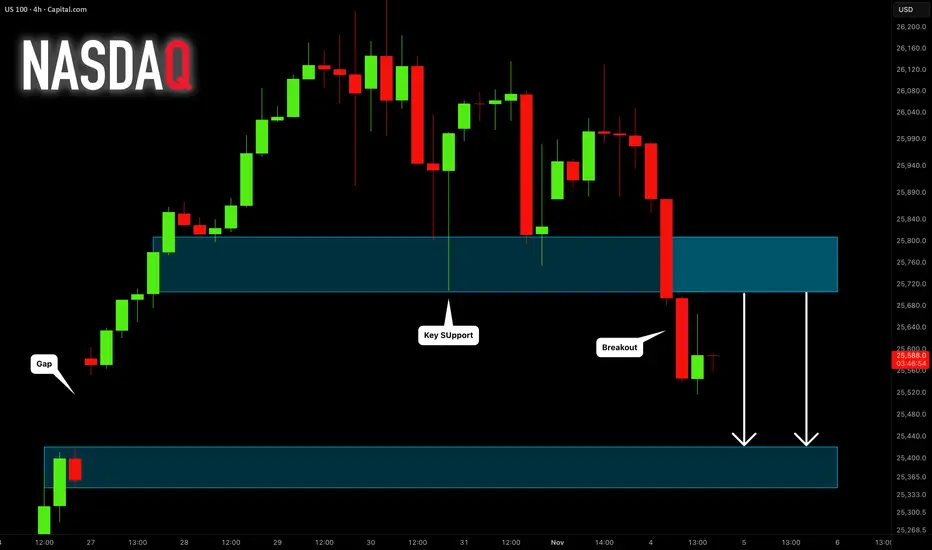
NASDAQ INDEX (US100): Forgotten Gap
A week ago, US100 formed a gap up opening.
It looks like the index is finally ready to fill it.
A breakout of a major horizontal support is a strong bearish signal.
Expect a bearish continuation to 25420.
❤️Please, support my work with like, thank you!❤️
I am part of Trade Nation's Influencer program and receive a monthly fee for using their TradingView charts in my analysis.
NASDAQ (NQ1!) – Bearish Divergence Potential PullbackOn the 1-hour chart, a clear bearish divergence has formed at recent highs, aligning with loss of bullish momentum and price rejection near the upper trend channel. The short-term structure suggests sellers may gain control, with potential retracement zones around the 0.5–0.618 FIB levels and an unfilled GAP below.
If price confirms continuation after a minor relief bounce, we could see a corrective wave unfold before the broader uptrend resumes.
Bias: Short-term Bearish – looking for retracement opportunities toward key support levels before potential trend continuation.

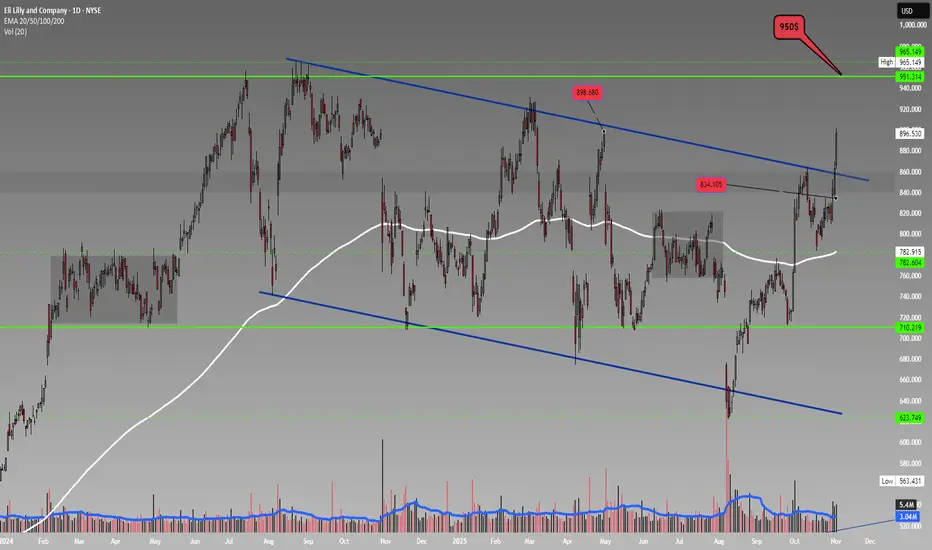
LLY DAILY OUTLOOKLLY has been rising strongly with high volume for the past three days! It closed above its long-term downtrend. Let’s see if it can reach $950.
If you already hold a position, taking some profits could be considered. If it falls below $835, the situation might change.
💬 Remember: Profit looks best in your pocket money that’s not in your pocket isn’t yours yet!
Wishing everyone successful trades and good profits!
How to Trade NASDAQ NAS100 Retracements Into An Imbalance🚀 NASDAQ NAS100 Analysis – Watching for a Bullish Opportunity 📈
I'm currently focused on the Nasdaq NAS100. On the weekly timeframe, it remains in a strong bullish trend 💹. Recently, however, we've seen a sharp and aggressive retracement. Given that the market was overextended, this pullback is healthy and expected, as price seeks to tap liquidity pools and rebalance ⚖️.
Zooming into the 4-hour timeframe, we can clearly identify a bullish imbalance 🔹. This area serves as my key point of interest for a potential move lower. The ideal scenario is for price to hold above the imbalance low and then break structure bullishly 🔼.
Key conditions for a high-probability long trade:
Price must not break below the imbalance low 🚫⬇️
Price must establish higher highs and higher lows to confirm bullish momentum 🔝
If these conditions align, I will be looking for a long entry opportunity. ⚠️ Not financial advice – this is purely market analysis for educational purposes.

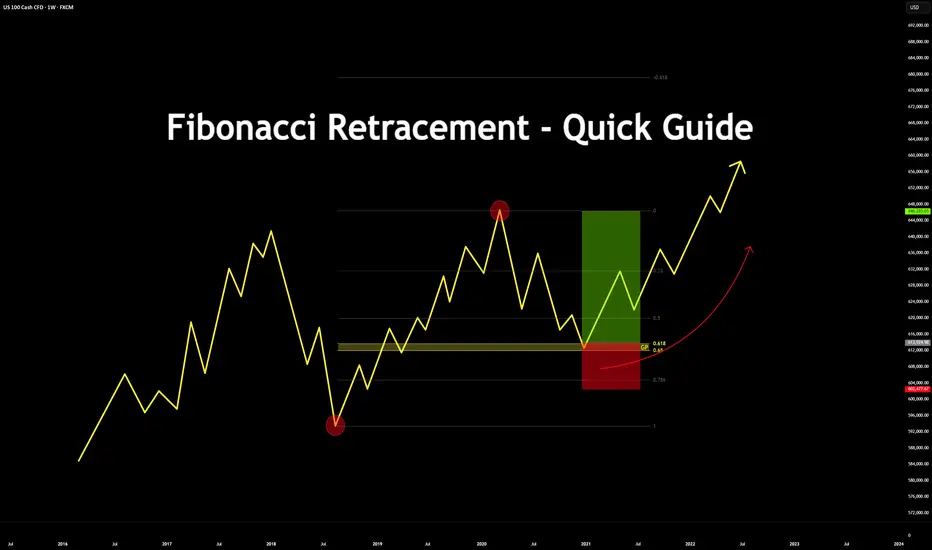
Fibonacci Retracement - Quick Guide in 5 StepsTrading the Fibonacci Retracement - Quick Guide in 5 Steps.
What is the Fibonacci tool?
The Fib Retracement Tool is a tool used widely across many charts. From crypto to stocks.
It assists in identifying the Golden Pocket, along with any potential Support and Resistance zones based on the sequence in Fibonacci.
Investors & Traders draw it from a previous high/low or low/high.
On a chart, each key level shows where price might pause or reverse during a pull back, before it continues the trend.
In this guide you will learn how to use the Fibonacci tool in 5 steps.
1. Configurations
Open up your Fib Retracement Tool's settings, apply the below configurations.
(You can change the color to your choice)
2. Identify High/Low's
Identify, recent highs and lows of your current chart/pair.
3. Applying Fib Retracement
Select your Fib Retracement tool. Place it on your chart starting from the swing low to the swing high.
4. Once completed
Highlight the Golden Pocket Field in the zone (0.65-0.618)
5. Review Entry
Price will eventually make it's way back down to the Golden Pocket to retest and reverse.
SL Placement would be on a previous low or key level, TP placement would be at a previous high or key level.
Bonus:
See the real time example below:
Please like, comment and follow if this guide was useful to you.
If you have any requests on analysis or tutorial requests, let me know and I'll be happy to make one!
Microsoft: Wave X Top Confirmed! As primarily anticipated, Microsoft shares recently reached the high of turquoise wave X just below resistance at $562.17 before quickly reversing lower. This decline, part of the same-colored wave Y, is likely to bottom within our magenta long Target Zone between $477.87 and $451.84, where we also expect the low of magenta wave (4). In our view, this range presents attractive opportunities for long positions, as we anticipate a renewed upward move during magenta wave (5) to follow. This rally should push price above the $562.17 resistance and complete the larger blue wave (I). Alternatively, we see a scenario in which the high at $562.17 marked only the end of beige wave alt.III (probability: 36%). In this case, a drop below the $392.97 support would be expected to form the low of wave alt.IV.


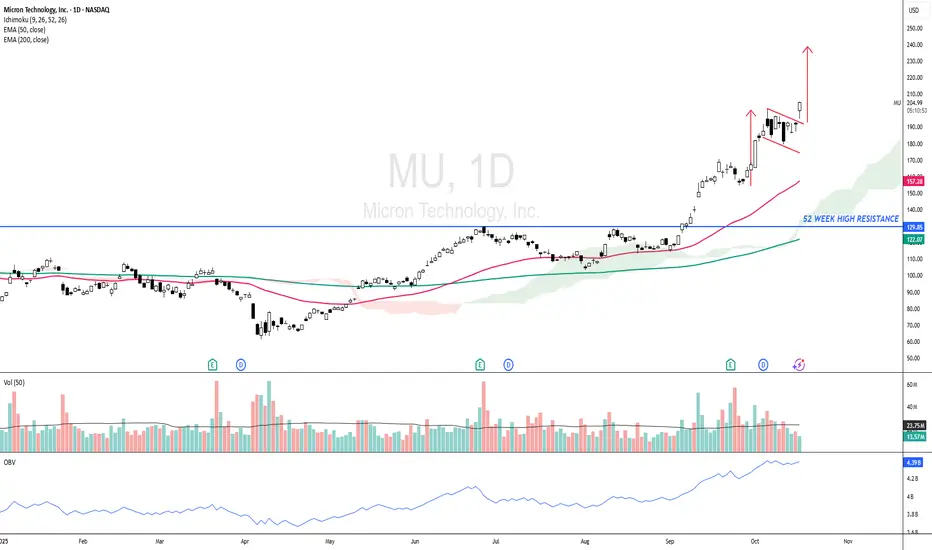
MU - Bullish Continuation Pattern ?MU - CURRENT PRICE : 204.00 - 205.00
The stock has surged nearly 70% since my previous buy call, demonstrating strong bullish momentum. I shared the link of my previous trading idea for reading purpose.
Currently, the price has broken out of a bullish flag pattern, indicating the potential for another leg higher. Estimate target of this bullish flag pattern is around 237.00. Support level is 179.00 (the low of 10 October 2025 candle).
Take note also this ascending in prices is also supported by rising in On Balance Volume (OBV) readings. (Look at the blue line at bottom of chart)
ENTRY PRICE : 203.00 - 205.00
TARGET : 237.00
SUPPORT : 179.00