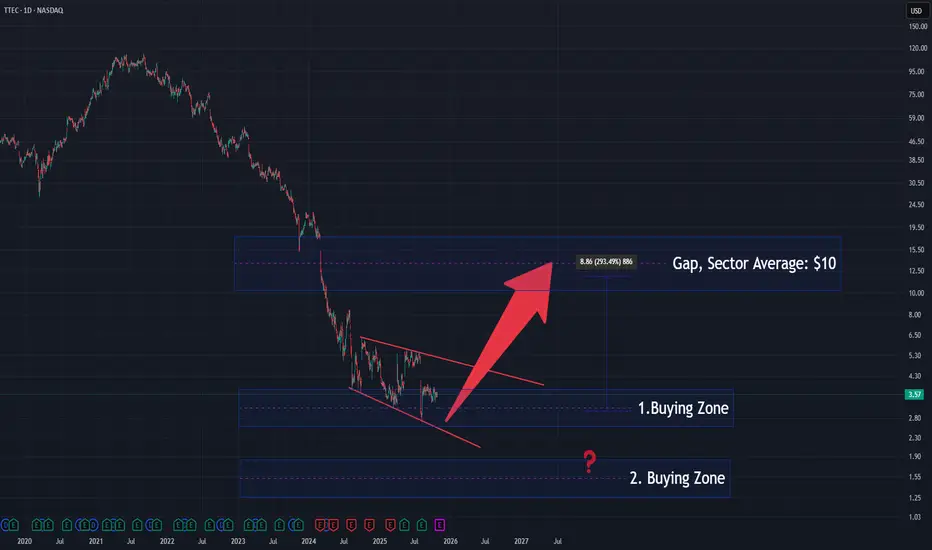
TTEC – Accumulation Setup and Sector Mean Reversion PotentialTTEC (NASDAQ)
The price structure is forming a descending diagonal, suggesting a potential exhaustion phase of the ongoing downtrend.
The stock is currently trading inside the 1st Buying Zone, with a possible deeper test toward the 2nd Buying Zone before a sustained reversal begins.
The sector average stands near $10, aligning with the gap area, which could act as a major upside target if accumulation continues.
📈 A confirmed breakout from the diagonal pattern would strengthen the bullish bias toward that sector-level equilibrium.
Nasdaq
ORACALE (ORCL) Rally! Cycle 3 → $400, Eyes on Supercycle $6,000🌀 ORACLE (ORCL) – Elliott Wave Supercycle Analysis | Smart Money & Fibonacci Confluence
🔭 Macro Perspective
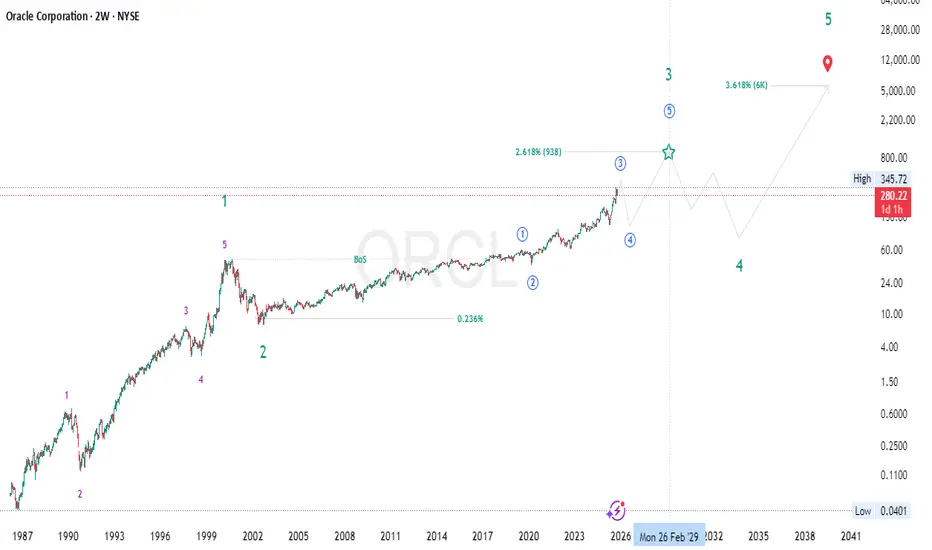
Oracle’s long-term chart (NYSE: ORCL) showcases a powerful Supercycle (III) wave in motion — a multi-decade expansion phase fueled by institutional participation, structural growth, and technological innovation.
The internal Cycle waves (1–5) are clearly defined, with current price action positioned deep within Cycle Wave (3) — the strongest segment of this major bullish leg.
🟢 Supercycle Wave (I) (1987 – 2000)
Elliott Behavior: The first grand impulsive advance, representing Oracle’s rise during the early software and database revolution.
Fibonacci Structure: Wave (3) extended toward the 2.618× of Wave (1), typical of an early institutional growth wave.
SMC Dynamics:
Breaks of structure (BoS) at each impulsive stage.
Liquidity sweeps before rallies — consistent smart money accumulation patterns.
Fundamentals: Explosive earnings growth through enterprise software adoption and global market expansion.
💥 Conclusion: The dot-com peak in 2000 completed Supercycle (I).
🔵 Supercycle Wave (II) (2000 – 2002)
Nature: The sharp, emotion-driven retracement following the tech bubble.
Fibonacci Retracement: Retraced into the 0.236 zone of (I), providing the long-term discount region for accumulation.
SMC Characteristics:
Liquidity grab beneath 1998–1999 structure.
Long accumulation base confirming institutional re-entry.
Fundamentals: Oracle streamlined operations and built the groundwork for enterprise-level solutions.
🧱 Bottom: Wave (II) ended around 2002 — the base of today’s decades-long uptrend.
🟣 Supercycle Wave (III) (2002 – 2030s, ongoing)
This ongoing macro impulsive wave contains five internal Cycle Waves (1–5) .
⚪ Cycle Wave (1) (2002 – 2019)
Elliott Context: A powerful, sustained impulsive leg lasting nearly two decades.
Structure: Clean five-wave advance with strong extensions during 2010–2019.
Fibonacci Note: The move achieved near the 1.618× extension relative to its starting point.
SMC Insight:
Consistent higher highs and higher lows throughout the period.
BoS continuation patterns confirming institutional markup.
Fundamentals: Expansion of Oracle’s business model — cloud transition, data analytics, and enterprise software dominance.
📈 End: Cycle (1) peaked near 2019 , completing the first internal impulsive leg of Supercycle (III).
🔵 Cycle Wave (2) (2019 – 2020)
Nature: A sharp yet shallow correction that coincided with the global market decline (COVID crash).
Fibonacci Retracement: Retraced around the 0.236–0.382 zone of Wave (1).
SMC Dynamics:
Liquidity sweep under 2018–2019 structure.
Fast accumulation pattern — strong re-accumulation footprint.
Fundamentals: Short-term market shock, but Oracle’s fundamentals remained intact and rebounded swiftly.
🧭 Conclusion: Cycle (2) ended in 2020, setting the foundation for the explosive ongoing Cycle (3) rally.
🟢 Cycle Wave (3) (2020 – ~2026, in progress)
Elliott Context: The most powerful internal impulsive wave — currently unfolding.
Target Zone: Projected to complete near $380–$400 , expected around late 2025 to early 2026 .
Fibonacci Extension: The 2.618× extension of Wave (1) perfectly aligns near $400.
SMC & Market Structure:
Continuous BoS and HH–HL formations — clear institutional control.
No macro distribution yet; structure remains intact.
Liquidity inducements near highs suggest ongoing markup phase.
Price Action: Aggressive impulses, shallow retracements, and orderly continuation patterns.
Fundamentals:
Rapid expansion in Cloud Infrastructure (OCI), AI-driven services, and recurring revenue models.
Sustained EPS growth and improved margin performance support wave maturity.
🚀 Expectation: Completion near $400 will likely trigger a Cycle (4) corrective structure before the final impulsive push.
🟠 Cycle Wave (4) (Projected: 2026 – 2028)
Elliott Behavior: A corrective phase — retracing part of the strong Cycle (3) run.
Fibonacci Retracement: Expected correction into the 0.236–0.382 zone of Wave (3), roughly $200–$280.
SMC Insight:
Break of structure (BoS) near top zones to induce liquidity.
Re-accumulation base forming after liquidity sweep below key supports.
Market Psychology: Cooling from euphoria, consolidation, and rebalancing of valuations.
Fundamentals: Period of stabilization after several years of aggressive expansion.
📉 Outlook: Likely forms the structural foundation for the next rally phase (Cycle 5).
🟢 Cycle Wave (5) (Projected: 2028 – early 2030s)
Elliott Context: The final impulsive leg completing Supercycle (III).
Target Zone: Fibonacci 3.618× extension (~$900–$950) of Cycle (1).
SMC Structure:
Final markup phase with strong BoS continuation patterns.
Climax rallies as retail sentiment peaks.
Price Action: Parabolic trend, thin retracements, and expanding volatility.
Fundamentals: Oracle could cement its dominance in global data, AI, and enterprise infrastructure markets.
💎 Completion: Cycle (5) will mark the end of Supercycle (III), leading into the long-term corrective Supercycle (IV).
🔶 Supercycle Wave (IV) (Projected: 2030s – 2040s)
Nature: Major macro correction after decades of expansion.
Fibonacci Depth: Likely retraces into the 0.382–0.5 zone of (III).
SMC Behavior: Distribution → liquidity sweep → re-accumulation.
Market Context: Could align with macroeconomic tightening or sectoral rotation.
📊 Purpose: To reset valuations and build energy for the final Supercycle (V).
🟩 Supercycle Wave (V) (Projected: 2040s – 2050s)
Elliott Context: The final impulsive wave of Oracle’s century-long trend.
Fibonacci Target: 3.618× expansion (~$6,000).
SMC Behavior: Final institutional markup followed by distribution and secular reversal.
Fundamentals: Could coincide with Oracle’s role as a global AI–data infrastructure leader.
🚀 Legacy Wave: The culmination of decades of innovation and expansion.
⚙️ Macro Summary
Accumulation (1980s–1990s) – Smart money foundation.
Expansion (2000s–2020s) – Institutional markup phase.
Distribution (2030s) – Macro correction and rotation.
Re-accumulation (Post-2040s) – Long-term reset for future cycles.
🧠 Technical & Fundamental Alignment
✨ Elliott Structure: Clear impulsive (I–V) sequence with macro rhythm.
✨ Fibonacci Confluence: $400 (2.618× of Wave 1) & $900 (3.618× of Wave 1).
✨ SMC: Institutional control with clean BoS → reaccumulation → continuation.
✨ Price Action: Aggressive bullish order flow with no macro distribution yet.
✨ Fundamentals: Oracle’s AI + Cloud strategy drives sustainable growth.
🌍 Conclusion
Oracle (ORCL) continues to trend within Supercycle (III) — the most powerful long-term wave.
Cycle Wave (3): In progress, targeting $380–$400 by end of 2025 / early 2026.
Cycle Wave (4): Anticipated retracement toward $200–$280 zone.
Cycle Wave (5): Final impulsive run toward $900+ into the early 2030s.
📈 Macro Bias: Long-term bullish — institutional structure intact.
📊 Short-term Outlook: Momentum strong but nearing Cycle 3 completion; prepare for corrective rotation.
💬 Summary: Oracle’s price evolution beautifully mirrors its technological growth story — a near-perfect alignment of Elliott Wave symmetry , Smart Money structure , and fundamental strength . The completion of Cycle 3 near $400 will open the door to an ideal re-entry opportunity for the next macro leg higher.
#ORCL 📈 #Oracle 💼 #ElliottWave 🌊 #WaveAnalysis 🔹 #Supercycle 🚀 #Fibonacci 📊 #SmartMoney 💎 #PriceAction 🕯️ #MarketStructure 🏗️ #LongTermBull 🟢 #StockAnalysis 💹 #TechnicalAnalysis ⚙️ #Investing 💰 #TradingViewIdeas 💡
💬 Respected traders and analysts!
Your insights matter. Share your views, confirmations, or constructive criticism in the comments below. Let’s discuss ORCL’s structural evolution, Elliott Wave setup, and long-term Supercycle potential 🚀📈.
— Team FIBCOS 💎
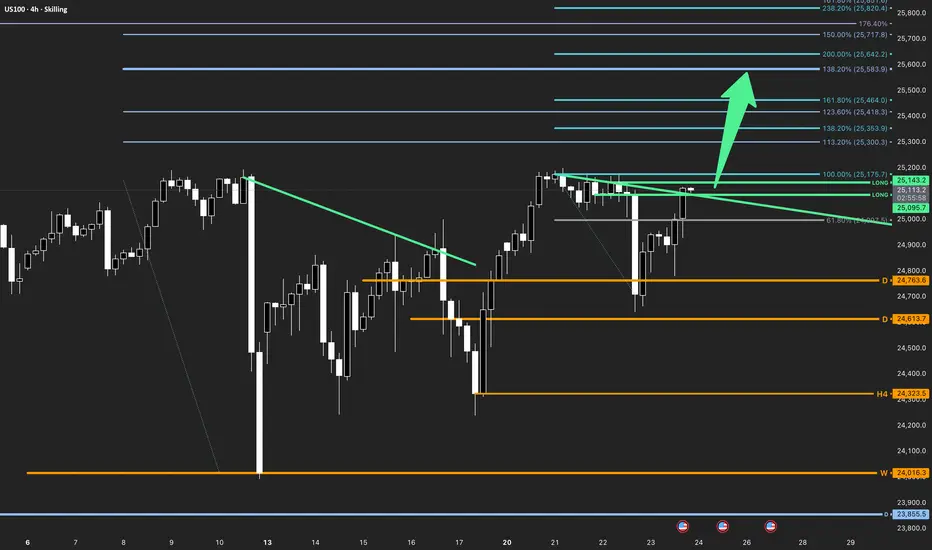
US100 | Expansion Phase Alignment
The Market Flow | Oct 23, 2025
Technical Overview
• Price confirms a breakout above the active countertrend trigger (green).
• All observed timeframes are in bullish alignment — wave structure expanding higher.
• Immediate resistance lies near 25,175 , where the 100% Fibonacci projection aligns.
• Clearing this zone opens continuation toward higher Fibonacci extensions — 25,353 , 25,418 , 25,464 , and 25,583+ .
• Structural pivots remain supportive above 24,763 and 24,613.7 (daily pivot zone).
Trade Structure & Levels
• Bias: Long above 24,613.7
• Trigger = 25,095–25,143 breakout zone
• Primary Invalidation = 24,613.7 (daily pivot)
• Secondary Invalidation = 24,323.5 (H4 pivot)
• Targets → Fibonacci extensions: 25,353 → 25,418 → 25,464 → 25,583
• Phase: Expansion
Risk & Event Context
• Focus remains on U.S. macro data and yield repricing.
• Short-term volatility expected around key data prints; sustained closes above the trigger confirm momentum continuation.
Conclusion
The US100 shows multi-timeframe bullish alignment, initiating an expansion phase above the countertrend trigger. As long as price holds above the daily pivot at 24,613.7, the structure supports progressive upside toward the Fibonacci expansion cluster.
Disclaimer
This analysis is for informational purposes only and does not constitute investment advice, an offer, or a recommendation. Market conditions and price behavior may change without notice. Past performance is not indicative of future results. Always conduct your own research or consult a licensed financial advisor before making investment decisions.
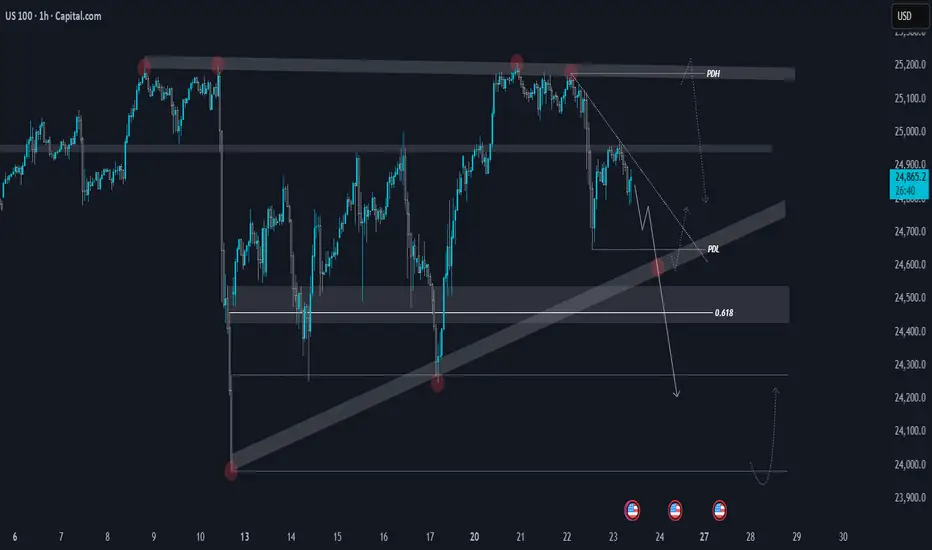
NASDAQ | Daily TF - Bearish Divergence with Double TopCAPITALCOM:US100 NASDAQ continues to hold a bearish tone on the 1-hour chart, with a clear bearish divergence confirming weakness in momentum. Price is respecting lower highs and lower lows, keeping the short-term structure bearish.
On the 4H timeframe, the index is approaching the trendline support around 24,600, which marks the third touch of this level. If this zone fails to hold, we could see an extended move toward the 24,000 area.
From a broader view, the daily chart shows a double top pattern along with a strong bearish divergence — both supporting a deeper pullback. However, a daily close above 25,220 would invalidate this view and could shift momentum back to the upside.
📰 With the ongoing U.S. government shutdown and heightened market uncertainty, sentiment remains mixed. Volatility is expected to stay elevated, so it’s best to wait for clear confirmation around key levels before taking any positions.
USNAS100 | Bearish Momentum After Tesla Earnings MissUSNAS100 | Bearish Momentum After Tesla Earnings Miss ⚠️
The index dropped sharply by 1.5% (~500 points), exactly as projected.
Currently, the bias remains bearish while trading below 24860, with the next downside targets at 24760 → 24510.
Key Levels:
Pivot: 24,860
Resistance: 24,960 · 25,035 · 25,200
Support: 24,760 · 24,510 · 24,350
Trading Plan:
Sell Setup: Shorts remain valid below 24,860, targeting 24,760 / 24,510 / 24,350.
Buy Setup: Longs active only above 24,860, with confirmation toward 25,035 / 25,200.
Premium Takeaway
USNAS100 maintains a bearish bias below 24,860, with room to extend toward 24,510–24,350.
Only a confirmed 1H close above 25,035 would shift momentum bullish, signaling recovery toward 25,200.
previous idea:

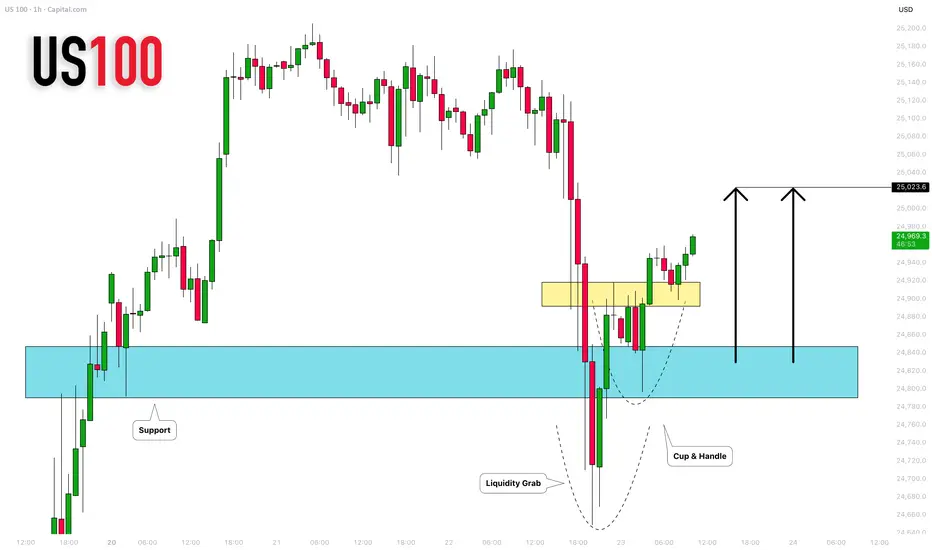
NASDAQ INDEX (US100): Bullish Move After the Trap
I see a confirmed liquidity grab below a key horizontal support
on an hourly time frame.
A formation of a cup & handle pattern and a breakout of its neckline
afterward suggest a strong buygin interest.
The market will rise more and reach at least 25023 level.
❤️Please, support my work with like, thank you!❤️
I am part of Trade Nation's Influencer program and receive a monthly fee for using their TradingView charts in my analysis.
US100 Will Go Down!
HI,Traders !
#US100 has made a retest
Of the horizontal resistance
Of 25169.1 and we are already
Seeing a bearish reaction so
We are bearish biased and
Therefore a local bearish
Pullback is to be expected !
Comment and subscribe to help us grow !

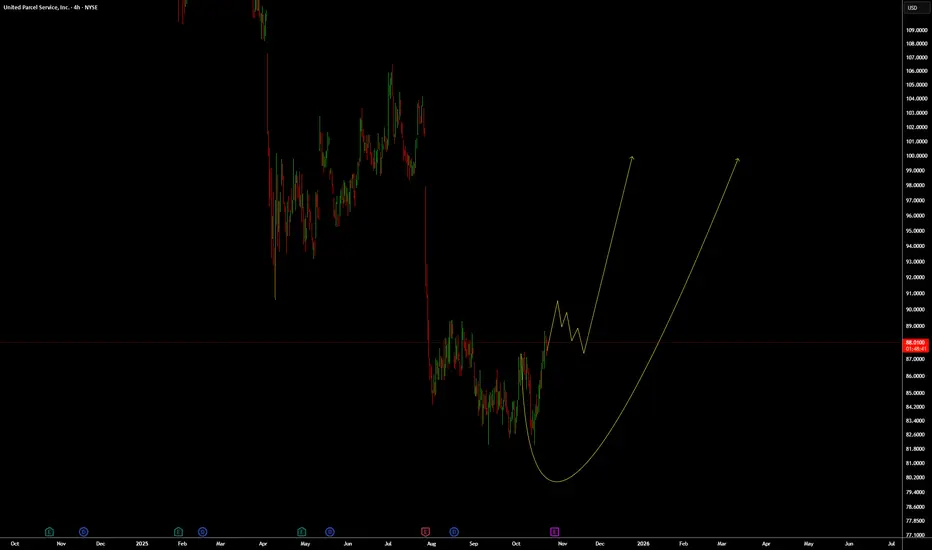
Update for UPS: Should go up to 100 level.This is an updated chart for NYSE:UPS Trade Idea that was posted few days ago.
If you got in the Buy, make sure to manage your trade and lets wait market to go a bit more higher, give us a correction/pullback for another push up towards 100 level.
WTW 4 Golder Rules:
1) Do not jump in
2) Do not over risk/trade
3) Do not trade without Stop Loss
4) Never ever add to a losing position!
Trade with care
We Trade Waves
WTW Team
Disclosure: We are part of Trade Nation's Influencer program and receive a monthly fee for using their TradingView charts in our analysis.
Netflix: Key Support Zone in sightNetflix shares have continued to decline since our last update. We have now provided additional detail on the ongoing turquoise wave 4, which is subdivided into a magenta three-part structure. Within this structure, wave is expected to push price further down into the turquoise Target Zone, between $962.77 and $845.22. The low point of the larger wave 4 is anticipated within this range. Only after reaching this level should wave 5 drive price back above the $1,341 mark. As such, the turquoise Target Zone presents long entry opportunities, which can be protected with a stop set 1% below the lower boundary of the zone. However, if price rises directly above the aforementioned resistance at $1,341, our alternative scenario would be triggered, and we would initially need to prepare for a higher wave alt.3 top (probability: 30%).

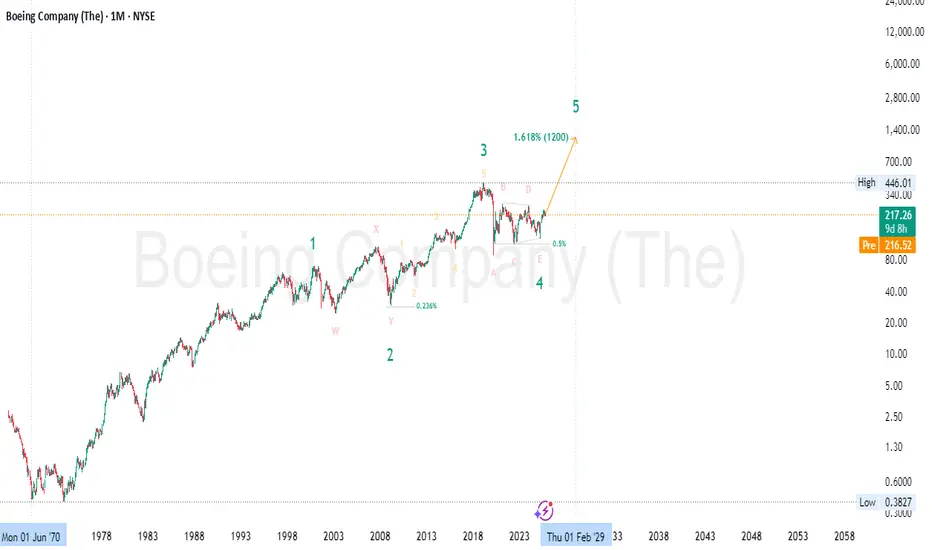
Boeing (BA) – Final Leg of Macro Bull Run✈️ Boeing (BA) – Final Leg of Macro Bull Run | Wave 5 to 1.618 Extension ($1200) 🚀
📅 Timeframe: Monthly (Macro Cycle Outlook)
📍 Current Price: $217
🎯 Wave 5 Target : ~$1200 (1.618 Extension)
🌀 Wave Theory Structure
Boeing appears to be entering Wave 5 of a long-term Elliott Wave cycle:
✅ Wave 1: Multi-decade rise until the early 2000s
✅ Wave 2: Complex correction (W–X–Y) into 2009 lows
✅ Wave 3: Powerful rally through 2019, completed with an extended 5-wave subdivision
✅ Wave 4: A large-scale triangle correction (ABCDE) — now completed, as price has broken structure upward
🚀 Wave 5: Projected move toward the 1.618 Fibonacci extension (~$1200) from the 1–3 wave distance
This is a textbook impulsive wave structure playing out on the monthly macro scale — with a final bullish leg now unfolding.
📐 Fibonacci Confluence
Wave 2 retraced ~0.236 of Wave 1 (shallow, bullish corrective behavior)
Wave 4 retraced ~0.5 of Wave 3 — typical for triangle patterns and expanded flats
Wave 5 target at 1.618 Fib extension measured from Wave 1–3 aligns around $1200 , completing the 5-wave macro cycle 🔺
🧠 Smart Money Concepts (SMC)
🔹 Accumulation Phase (2020–2024): After COVID crash and multi-year consolidation, price has shown strong accumulation characteristics
🔹 Final Sweep of Lows (E leg) flushed out late longs and retail stops before institutional re-entry
🔹 Break of Structure (BOS) confirms transition from reaccumulation to markup phase 📈
🔹 Price is now in a reprice phase — a classic SMC trait where value is rapidly adjusted after institutional positioning completes
📊 Price Action Analysis
Bullish breakout from triangle structure
Monthly higher low established at E-wave base
Strong bullish candle from demand zone — early confirmation of trend continuation
Break above $260 would open clean skies toward the next major resistance at ATH ($446) and beyond 🧭
💼 Fundamental Outlook
Boeing is regaining strength after multiple challenging years:
✈️ Rebound in global aviation demand
📦 Growing defense & aerospace contracts amid rising geopolitical tensions
💰 Expected recovery in cash flows, backlog, and profitability
🌐 Expansion in space and unmanned systems (future growth verticals)
Although regulatory and delivery risks remain, Boeing’s turnaround story is gathering steam — aligning with the technical forecast of Wave 5 acceleration.
🔍 Summary
Boeing is entering what could be the final and most explosive leg (Wave 5) of its macro Elliott Wave cycle. Key confluences include:
✅ Elliott Wave triangle completion
✅ Fibonacci 1.618 extension to ~$1200
✅ Institutional accumulation confirmed
✅ Price Action breakout from multi-year structure
✅ Improving long-term fundamentals
This setup favors long-term swing positions , with pullbacks offering buying opportunities until the final cycle target is approached. 🧠📈
⚠️ Disclaimer: This is not financial advice. For educational purposes only. Always do your own due diligence and manage risk responsibly. 🛡️
#Boeing #BA #ElliottWave #SmartMoney #PriceAction #Fibonacci #Wave5 #TriangleBreakout #TechnicalAnalysis #LongTermInvestment #MacroTrading #StockMarket #BullishOutlook #Aerospace #WaveTheory #SwingTrading #AviationRecovery #FibonacciTargets #TradingStrategy
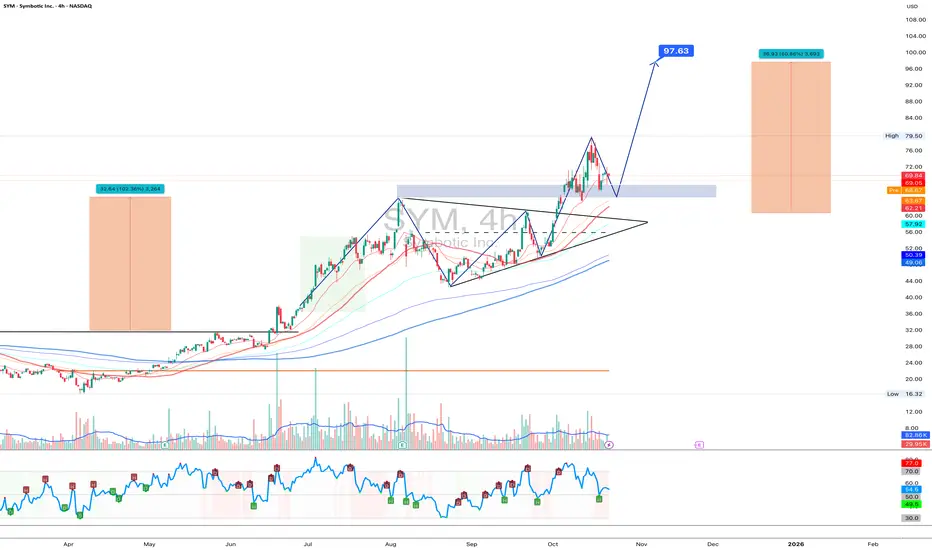
SYM 1D - AI with a real upgrade?Symbotic Inc. shows a clean setup: after a strong rally and breakout from a triangle, the stock is now retesting the $68–70 support zone. The 50-day moving average aligns perfectly here, strengthening the buyers’ defense.
If this level holds, the bullish structure stays intact. The first target sits around $79.50, and the second - at $97.63, matching the prior measured move. A dip below $68 could trigger a deeper pullback toward $62 before buyers regroup.
On the fundamental side, Symbotic keeps expanding its robotic warehouse automation systems - a sector still booming thanks to the AI wave. After a 100%+ rally this year, the stock deserves a coffee break before the next sprint.
Tactical plan: watch $69 carefully - if buyers defend, the uptrend continues; if not, give the robots a reboot and wait for the next entry.
HIMX 1D - eyes back on the screen?Himax Technologies is shaping a strong setup: after breaking above the downtrend line, the stock is now retesting the $8.70–$9.00 support zone, aligning perfectly with previous resistance and short-term EMAs. It’s a textbook breakout + retest situation.
All moving averages (MA/EMA/SMA) are below the price, confirming that buyers are in control. The bullish targets are set at $10.41 and $12.49. As long as the $8.70 level holds, the uptrend scenario stays valid.
On the fundamental side, Himax remains a key player in display driver ICs, particularly for AR/VR and automotive applications. With the growing adoption of smart displays and head-up tech, the stock could light up again.
Tactical plan: watch $8.7–9.0 carefully. If buyers hold the line - it’s showtime. If not - let the chip cool down before the next rally.

NASDAQ Short There is a lot of resistance, as it is at an all-time high and is unable to break this level
There are 2 patterns on M15 and M30 showing a potential reversal zone
This is against the H4 trend; however, it is overbought on H1
RSI is showing strong divergence with a triple top on H1
Stoploss above 21300
First target 24870 or when M15 is oversold

NASDAQ 100 (NQ1!): Wait For Valid Buys! #nasdaq Welcome back to the Weekly Forex Forecast for the week of Oct. 20-24th.
In this video, we will analyze the following FX market: NASDAQ (NQ1!) NAS100
The NASDAQ had ranged last week, but had a bullish end on Friday. I suspect we may see some continuation to the upside this week.
Wait for confirmation before taking valid buys setups.
I don't see a reason to look for sells. A bearish break of market structure would be a good reason.
Enjoy!
May profits be upon you.
Leave any questions or comments in the comment section.
I appreciate any feedback from my viewers!
Like and/or subscribe if you want more accurate analysis.
Thank you so much!
Disclaimer:
I do not provide personal investment advice and I am not a qualified licensed investment advisor.
All information found here, including any ideas, opinions, views, predictions, forecasts, commentaries, suggestions, expressed or implied herein, are for informational, entertainment or educational purposes only and should not be construed as personal investment advice. While the information provided is believed to be accurate, it may include errors or inaccuracies.
I will not and cannot be held liable for any actions you take as a result of anything you read here.
Conduct your own due diligence, or consult a licensed financial advisor or broker before making any and all investment decisions. Any investments, trades, speculations, or decisions made on the basis of any information found on this channel, expressed or implied herein, are committed at your own risk, financial or otherwise.

Will the second scenario come true? |October 17 2025Based on the evidence, price action, and fundamental news, it seems the second scenario is about to play out.
The Nasdaq index turned positive after recovering its losses when Trump responded “No” to a question about whether he would maintain the heavy tariffs on China.
From today, my outlook is bullish until the previous high gets hunted — after that, I’ll reassess whether we’re likely to see further downside or if the bullish outlook should remain.
If market conditions shift and a continuation of the downtrend becomes more likely, we can take a solid short position next week to catch the move.
But for now, my bias is bullish, and the second scenario will likely play out.
If price reaches the second high I marked in blue, we’ll probably see a reaction from that zone.
If I open a trade, I’ll share it with you.

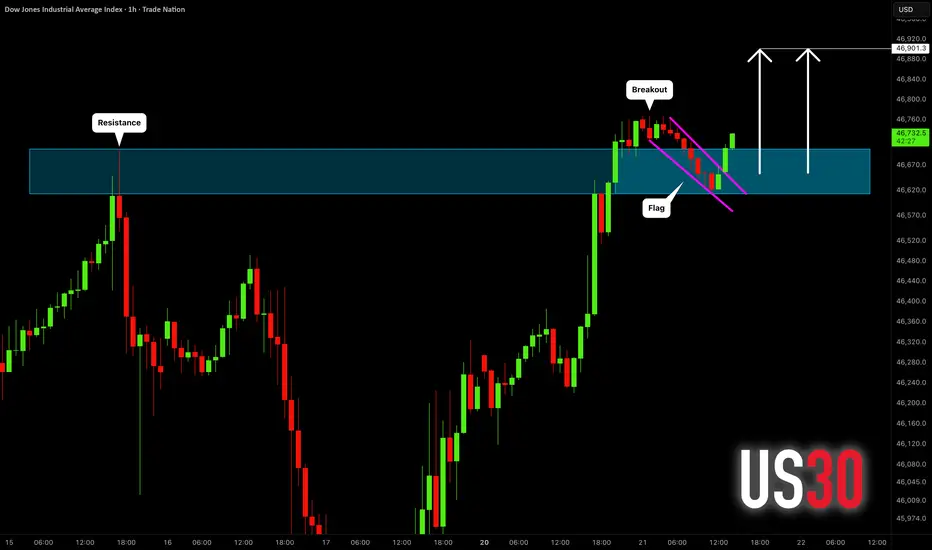
DOW JONES INDEX (US30): Bullish Continuation Confirmed
US30 index violated a major horizontal resistance yesterday.
The price started a correctional movement then, steadily
falling within a bullish flag pattern.
A breakout of its resistance line is a strong bullish signal.
Odds will be high, the index will hit 46900 level soon.
❤️Please, support my work with like, thank you!❤️
I am part of Trade Nation's Influencer program and receive a monthly fee for using their TradingView charts in my analysis.
Tuesday, Oct 21st Weekly Forecast UPDATES!Welcome to the Weekly Forecast Updates!
In this video, we will analyze the following markets: DXY, EURUSD, GBPUSD, NASDAQ, S&P500
Enjoy!
May profits be upon you.
Leave any questions or comments in the comment section.
I appreciate any feedback from my viewers!
Like and/or subscribe if you want more accurate analysis.
Thank you so much
Disclaimer:
I do not provide personal investment advice and I am not a qualified licensed investment advisor.
All information found here, including any ideas, opinions, views, predictions, forecasts, commentaries, suggestions, expressed or implied herein, are for informational, entertainment or educational purposes only and should not be construed as personal investment advice. While the information provided is believed to be accurate, it may include errors or inaccuracies.
I will not and cannot be held liable for any actions you take as a result of anything you read here.
Conduct your own due diligence, or consult a licensed financial advisor or broker before making any and all investment decisions. Any investments, trades, speculations, or decisions made on the basis of any information found on this channel, expressed or implied herein, are committed at your own risk, financial or otherwise.

TSLA – Sideways Accumulation Phase Ahead of Major NewsTesla’s stock is currently showing a stable sideways movement around the 430–445 USD range as the market awaits the company’s Q3 earnings report (on October 22).
Recent news reflects cautious investor sentiment , especially after ISS recommended rejecting Elon Musk’s massive compensation package and amid forecasts suggesting a slight decline in Q3 profits.
On the 4-hour chart, TSLA continues to maintain a medium-term uptrend, with prices oscillating around the EMA34 and EMA89, which act as equilibrium zones.
The 432 USD area remains the main support, while 493 USD stands as a key resistance level.
The chart indicates a high likelihood that the price will continue sideways within this range until the market reacts more clearly after the earnings release.
Summary
Currently, TSLA is in an accumulation phase , reflecting a tug-of-war between expectations of increased production and concerns over profit margin pressures.
In the short term, the trend is expected to remain sideways with a slight bullish bias, awaiting a potential breakout driven by the upcoming earnings announcement.

The 3 KEYS to Trading SUCCESSToday we will discuss about the 3 Keys I believe are required for succeeding in trading.
When you enter into the trading field, you quickly understand that it’s not just about charts and setups — it’s about mastering yourself mentally.
There are 3 keys that separate those who last from those who don’t in Trading:
( 1 ) Psychology
( 2 ) Risk Management
( 3 ) Consistency
Every single one is equally important, but how you balance them determines your long-term outcome when trading.
1 ) Psychology — Master Your Mind Before You Master the Market
Trading, the mental game disguised as a financial one displaying 1s and 0s winners and losers. The market, the charts, the currency, they do not care who you are, what you think, or how badly you want to win.
It simply exposes your strengths and weaknesses in the world of psychology .
Most traders lose, this is not because they lack knowledge, but because they cannot control their emotions, feelings — fear of losing, fear of missing out, greed after a win, hesitation after a loss, anxiety, frustration, impatience.
Every emotional outburst leads to poor decision-making: closing early, revenge trading, over-leveraging, or ignoring your plan, right after you told yourself you were going to lock in and turn $100 into $1000000.
To master psychology:
( 1 ) Detach from the outcomes/end-result. Focus on executing well, not whether a trade wins or loses. Follow your plan.
( 2 ) Think of probability. Every setup, every trade must have an edge — not a guarantee.
( 3 ) Accept losses as part of the process. Losses are tuition fees in this business. Every loss is a win, because there is a lesson to be learned.
( 4 ) Stay grounded. Journaling, mindfulness, and post-trade reflection go a long way. Keep track of trades and review them during down time.
When your mindset stabilizes, when your thoughts are calm, your trading skills become consistent. The charts don’t change — you do.
In terms of training your mindset, see my previous post below which explains the difference between a Trader and Gambler. This is an excellent article for those who want to BECOME a trader.
2. Risk Management — Protect Before You Profit
If psychology keeps your calm, risk management keeps you alive.
This is the part most traders skip — until they learn the hard way and blow their own capital, or 10 fundeds in a row.
Your number one job as a trader is not to make money. It’s to protect capital so you can focus on staying in the game long enough for your strategy and edge to play out well.
Practical risk rules:
( 1 ) Never risk more than 1–2% of your capital on a single trade. (If you do, you increase the emotions of greed)
( 2 ) Always know your max loss before entering — no guessing, if you do not? Your loss, your fault.
( 3 ) Use stop-losses logically, not emotionally. Set them at resistances or supports. Key levels.
( 4 ) Avoid over-leveraging. Leverage magnifies both wins and mistakes. Higher the leverage, higher the risk.
( 5 ) Don’t chase. Missed trades are better than blown accounts. Record them down and log emotions.
Good risk management doesn’t make you rich overnight — but poor risk management will make you broke instantly .
You don’t need huge wins to grow; you just need small, controlled losses and consistent execution throughout your trading journey.
3. Consistency — Discipline Over Drama
Consistency is the glue that holds everything together, risk management to Psychology.
It’s easy to stick to your plan for a week; but it is hard to do it for months without deviation and drifts. But that’s exactly what separates traders who make it from those who burn out.
Consistency means:
( 1 ) Showing up daily, sticking to a fixed plan of study, back testing, assessing.
( 2 ) Following your trading plan with discipline.
( 3 ) Reviewing your trades honestly — both wins and losses. (Are YOU doing THIS?)
( 4 ) Avoiding impulsive changes just because of one bad day. Take a break if the loss affects you badly.
Progress in trading is slow and often invisible. You might not notice improvements week to week but look back after six months of focused consistency — and you’ll realize how far you have come. Remember, slow and steady wins the race. This is a game of Tortoise v Rabbit. Push fast and hard and you will make mistakes – be slow and steady and you will win the race.
Stepping back to view the bigger picture
Trading success isn’t luck — it’s the result of compound discipline, calculated trades and timing.
( 1 ) Psychology gives you control.
( 2 ) Risk management gives you longevity.
( 3 ) Consistency gives you results.
When you align all three, everything starts to click.
You don’t need to master the market — just master your mindset, your risk, and your routine . The profits follow naturally.
Thank you all so much for Reading. I hope this post becomes beneficial to you!

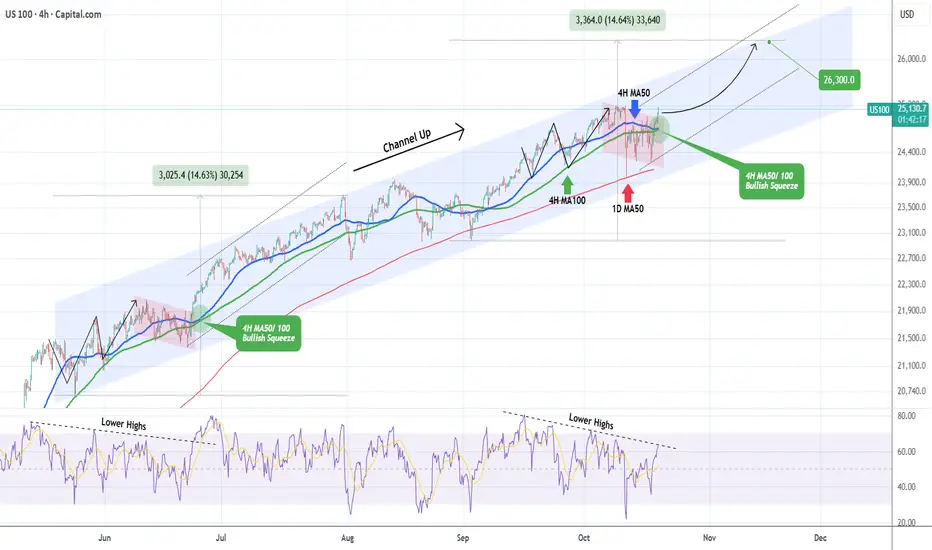
NASDAQ This bullish squeeze can push it to 26300.Nasdaq (NDX) has been trading within a Channel Up since the May 23 Low on its 4H MA100 (green trend-line). It appears that the index is getting out of the red Bearish Leg, which on the whole pattern serves as a Bull Flag for the next rally (Bullish Leg). Once the 4H RSI breaks above its Lower Highs trend-line, it will confirm the new Bullish Leg.
The last such RSI Lower Highs break-out was on June 23 when a similar 4H MA50/ 100 Bullish Squeeze took place. That was almost in the middle of a +14.63% rally in total before the index pulled back to its 1D MA50 (red trend-line).
As a result, once the 4H RSI break-out is finalized, we expect this run to reach at least 26300 (+14.63%).
-------------------------------------------------------------------------------
** Please LIKE 👍, FOLLOW ✅, SHARE 🙌 and COMMENT ✍ if you enjoy this idea! Also share your ideas and charts in the comments section below! This is best way to keep it relevant, support us, keep the content here free and allow the idea to reach as many people as possible. **
-------------------------------------------------------------------------------
💸💸💸💸💸💸
👇 👇 👇 👇 👇 👇
$REPL - Replimune Group - $6.42 Consolidation Re-Entry? $12.50PTNASDAQ:REPL broke out of a long term Descending Wedge it's been trading in since the beginning of Feb 2025, breaking out to $8.36. It wasn't able to find support on the $8.13 and if it can't hold the $7.72, we will be looking for a re-entry into the trade around the $6.42 Levels of Support for a potential $8.13 RT/Break providing a $12.50 PT if we break through the $10.39s.

NASDAQ 100 Resistance Reaction and Countertrend Short SetupThe NASDAQ 100 has rallied strongly and is now trading near the top of its current range 📊. Price is approaching a key resistance level, and I’m expecting a potential reaction from liquidity above the highs, followed by a retracement back to equilibrium — around 50% of the current price swing 📉.|
A countertrend short setup could be considered here, with the option to take partial profits early to reduce risk 💡. Full details of the trade idea and execution are explained clearly in the video.
⚠️ Disclaimer: This is for educational purposes only and not financial advice.

SPX | DAILY ANALYSIS #6Hello and welcome back to DP.
Let’s kick off the weekday together by analyzing the **S&P 500 Index (SPX)**.
🟠 Market Overview
Previous Close: 6692.50
Current Daily Range: 6678.00 – 6705.80
Asia Session High: 6705.80
Asia Session Low: 6678.00
The index has seen significant selling pressure over the past week. She broke below the previous demand zone at 6715–6700, forming a new demand zone between 6680–6665.
This could suggest:
* Sellers are gaining momentum, OR
* Short positions were liquidated to make room for new entries.
🔵 Key Levels to Watch
Resistance Zone (Upside Target):
6711 – A break and hold above this level could lead to a test of 6735 and potentially new highs near 6755.
Support Zone (Blue Box):
6680 – 6665 – This is a critical support zone.
If broken, we may see the index fall toward:
First Support (Yellow Box): 6645
Deeper Support Zone: 6620 – 6605
If the 6680 zone holds and we see bullish confirmation (e.g., strong buying wicks, volume spike, or bullish engulfing candle), buyers may regain control and push the price back up toward the 6710–6730 range.
🧠 Trading Outlook
Bullish Bias Above: 6711
Bearish Bias Below: 6680
Neutral Zone: 6680–6710 (watch for consolidation or fakeouts)
📌 Note: The current structure suggests we are at a decision point. Be patient, wait for confirmation, and manage your risk accordingly.
Take care and have a great trading day!
For informational purposes only – not financial advice. © DIBAPRISM
Amir D. Kohn
