Tesla Correction ahead ? - Levels to be aware Of !In this video I present to you the idea of a Tesla correction into the 340/350USD price zone .
I mark out a potential short setup as well as a strong area for longs/accumulation.
Tools used TPO chart, Fibs, Anchored V wap , Volume Profile, Parallel channels
Good luck with your trading and thanks for your support
Nasdaq

NASDAQ NAS100 Trade Plan: VWAP & Volume Profile StrategyI’m currently watching the NASDAQ #100 (#NDX) 📊. After a strong correction due to geopolitical turmoil 🌍, the market rebounded just as aggressively. Right now, price is trading above VWAP 📈. If it stays above VWAP, I’ll be looking for a long opportunity.
In the video, we zoom into a 30-minute timeframe ⏱️, using VWAP and Volume Profile to plan the trade. If price respects these levels, we can take a long. If it falls below the support level ❌, we abandon this idea.
⚠️ Disclaimer: This is for educational purposes only and not financial advice.

Trader vs Gambler: Why Trading Isn’t GamblingThe Trader vs The Gambler: Why Trading Isn’t Gambling
“Trading is gambling.”
You’ve probably heard it before — from friends, family, or strangers who’ve seen a few flashy headlines, red charts, and crypto hype videos and decided: “It’s all luck.”
To most outsiders, the markets look like chaos — numbers flashing, candles flying, influencers shouting “BUY!” and “SELL!” as emotions run high.
It’s understandable that they think it’s all random chance.
But here’s the truth:
Trading can look like gambling when it’s done like gambling.
When done properly — with education, discipline, and structured risk — trading is a profession built on probability, process, and data.
What Trading Actually Is
Trading is the art and science of buying and selling assets — currencies, commodities, crypto, or stocks — to profit from price movements.
But unlike gambling, trading involves skill, timing, and measurable probabilities.
Professional traders don’t rely on hope — they rely on edges.
An edge is a repeatable setup or condition that statistically produces profits over time.
A real trader studies and uses:
- Price Action & Market Structure: Recognizing higher highs, liquidity zones, supply and demand, and where big players enter or exit.
- Technical Analysis : Tools like moving averages, Fibonacci retracements, volume profiles, VWAP, trendlines, and fair value gaps.
- Fundamental Analysis: Macro data, interest rates, inflation, earnings, tokenomics, project development, and regulatory events.
- Sentiment & Flow: Gauging crowd emotion, open interest, whale activity, and on-chain data.
- Risk Management: Strict position sizing, stop-loss placement, and capital preservation.
- Statistics & Journaling: Tracking setups, win rates, risk-to-reward, and performance over hundreds of trades.
- Discipline & Emotional Control: The ability to not trade when conditions aren’t right.
A trader doesn’t ask, “Will it go up?”
They ask, “If it goes up, what’s my risk? What’s my probability? What’s my plan if I’m wrong?”
That’s not gambling — that’s probability management.
What Gambling Actually Is
Gambling is risking money on an uncertain outcome without any control, edge, or process.
You rely purely on luck — a spin of a wheel, a flip of a card, a random move in a market you don’t understand.
The outcome is fixed against you. In a casino, the house always wins.
A gambler thinks emotionally:
“I have a feeling it’ll go up.”
“My mate said this coin’s going to explode.”
“I’ll double my bet to win it back.”
No analysis. No backtesting. No data. No control.
Just hope — the same force that keeps casinos rich and players broke.
When someone dumps $10,000 into a random altcoin because they saw a tweet or meme, that’s not trading — that’s emotional speculation.
They’re not following a plan; they’re following a crowd.
The Trader’s Mindset vs The Gambler’s Mindset
TRADER:
- Decision Basis: > Data probabilities, confluences
- Goal: > Consistent Long-term growth
- Risk Control: > Defined, Limited, Pre-set
- Emotional State: > Patient, Detached, Focused
- Reaction to loss: > Reviews plan, learns, adjusts
- Education: Studies psychology, risk, analysis
- Funding approach: > Scales up, uses funded accounts
GAMBLER:
- Decision basis:> Emotion, impulse, hype
- Goal: > Quick jackpot
- Risk control: > Undefined, often all-in
- Emotional state: > Fearful, greedy, erratic
- Reaction to loss : > Doubles down or quits
- Education: > Follows noise & influencers
- Funding approach: > Risks personal savings recklessly
A gambler sees “one trade” as the make-or-break moment.
A trader sees “one trade” as part of a thousand trades that define their edge.
Example: The Math of a Trader vs a Gambler
Trader:
Win rate: 55%
Risk-to-reward: 1:2
Risking 1% per trade
After 100 trades, they’re up roughly +55R - 45R = +10R (10% growth).
Their plan, consistency, and edge made it possible.
Gambler:
Win rate: Random, maybe 45%.
Risk-to-reward: 1:1 or worse.
Risking 10–20% per “bet.”
After a handful of losses, they’re wiped out.
There’s no math, no longevity — just emotional chaos.
This is why traders survive, gamblers vanish.
Why Trading Is Not Gambling
1. Trading Has Positive Expected Value (EV)
Gamblers play games with negative EV — odds mathematically stacked against them.
Traders create systems with positive EV by identifying patterns that statistically outperform random chance.
Example:
If your setup wins 55% of the time and earns twice what it risks, your long-term outcome will always be positive.
That’s not luck — that’s math.
2. Trading Has Risk Management
In gambling, you can lose everything on one hand.
In trading, you risk a small percentage per trade.
Professionals risk 0.5–2% of their account per setup.
That’s why they can lose 10 trades in a row and still be in the game.
Gamblers can’t — they blow up because they never manage risk.
3. Trading Uses Control and Data
You can’t “analyze” a roulette spin. You can’t manage risk at a blackjack table.
But in trading, you can backtest, strategize, and control your exposure.
Markets may be uncertain, but traders control their actions within that uncertainty.
Gambling has no such control — it’s fixed odds, rigged in favor of the house.
4. Trading Rewards Skill and Experience
The more you study, journal, and refine your process, the better you get.
No amount of practice makes you better at roulette — the wheel doesn’t care.
But trading rewards time, reflection, and discipline.
Skill matters. Patience matters. Data matters.
5. Trading Has Funding Opportunities
No casino will give you $50,000 to “gamble responsibly.”
But trading firms will give you a $50K, $100K, or $200K funded account — if you prove consistency and discipline.
Funded trading isn’t luck; it’s a business.
You’re rewarded not for profits alone, but for following rules:
- Max daily drawdown
- Overall drawdown limits
- Minimum trading days
- Profit targets
That’s structure — something gambling never has.
Why Use a Funded Account Instead of Your Own $50K?
Because professional trading is not about flexing capital — it’s about proving control.
Funded accounts are training grounds for serious traders:
- You trade with someone else’s capital.
- You’re held accountable to strict limits.
- You’re paid for consistency, not luck.
That’s professionalism.
Gambling is the opposite — no structure, no accountability, and no risk control.
A gambler risks $50K of their own money and hopes for a jackpot.
A trader risks 0.5% of a $50K funded account with a defined plan.
One burns out in a week.
The other builds a track record and earns a living.
The Reality Check: When Trading Does Become Gambling
Trading becomes gambling when:
- You trade without a plan.
- You follow hype or influencers blindly.
- You over-leverage.
- You revenge-trade.
- You skip journaling and analysis.
- You ignore stop losses.
The activity isn’t gambling — the mindset is.
A professional can take the same tool a gambler uses — the same chart, same exchange, same coin — and produce consistent returns, because their intent, process, and control are different.
Real-World Example
Two people open Bitcoin trades at $60,000.
- Trader A: Risks 1%, sets stop at $59,000, target $62,000. Reviews structure, confluences, and volume.
- Trader B: Risks 100% of his savings because “it’ll go up for sure.”
Same entry, same price.
One plays a game of probability, the other a game of hope.
One grows, one disappears.
The chart doesn’t decide who wins — their mindset does.
The Trader’s Mindset
A real trader thinks like a scientist:
- Hypothesis: If price rejects support and volume confirms, it may move up .
- Experiment: Enters small, stops defined.
- Result: Win or loss logged.
- Iteration: Reviews data, improves setup.
Gamblers don’t have hypotheses — they have feelings.
The trader’s mindset is structured:
- Plan before execution.
- Accept losses as data.
- Control risk religiously.
- Focus on consistency over excitement.
Detach emotionally from outcomes.
That’s why traders survive long-term while gamblers chase short-term highs.
“But Crypto Is Just Gambling!”
Crypto can look like gambling — because most people in it treat it like one.
They buy hype, ignore fundamentals, and chase every new shiny coin.
That’s not trading.
Real crypto traders:
- Study tokenomics, development teams, and market sentiment.
- Use technical levels and liquidity maps.
- Manage position sizes and hedge exposure.
- Treat it like a business, not a casino.
The asset class doesn’t make it gambling — your approach does.
Final Thoughts
Yes — both trading and gambling involve risk.
But risk ≠ gambling.
Risk, when managed correctly, equals opportunity .
The difference is control, process, and purpose.
A trader plays the long game with discipline and math.
A gambler plays for emotion and chance.
Anyone can click Buy.
But not everyone can manage risk, follow process, and think in probabilities.
So next time someone says:
“Trading is gambling.”
Show them this:
🎲 Gambling is random.
📊 Trading is calculated.
One depends on luck .
The other depends on discipline .
Thank you all so very much for reading this article, I enjoyed creating it and I hope it becomes of use too you.
If you have any requests on strategies, articles or would like charting done, drop a comment below.
Nasdaq - Clearly heading to $30.000!🎉Nasdaq ( TVC:NDQ ) points much higher:
🔎Analysis summary:
Yes, we witnessed a short term correction over the past couple of days. But no, this does not mean that the bullrun is now entirely over. In fact, looking at the longer term rising channel pattern, the Nasdaq can still rally higher until it will retest the upper trendline.
📝Levels to watch:
$25.000, $30.000
SwingTraderPhil
SwingTrading.Simplified. | Investing.Simplified. | #LONGTERMVISION

Up onlyWe are at the light blue cross.
August 2020 after heavy deleverage, precious metals in ATH while Governments of the world are easing.
Dollar should fall a little more from here.
Tech and crypto will continue higher while commodities go up but underperform.
Cheers.

NASDAQ Did the 1D MA50 just save the day??Nasdaq (NDX) suffered a historically strong daily sell-off on Friday following President Trump's tariff threats and touched (and closed on) its 1D MA50 (blue trend-line).
Last time it hit that trend-line was on September 02 and that was a technical Higher Low on the 5-month Channel Up. Friday's Low was also very close to the bottom of this pattern. At the same time the 1D RSI hit and rebounded on its Lower Lows Support trend-line.
With the market rebounding and opening considerably higher today, it is more likely technically that we have started the pattern's new Bullish Leg. With the last two such sequences rising by at least +11.00%, we expect a new similar uptrend, which as long as the 1D MA50 holds, could hit at least 26000 within a 40 day horizon.
-------------------------------------------------------------------------------
** Please LIKE 👍, FOLLOW ✅, SHARE 🙌 and COMMENT ✍ if you enjoy this idea! Also share your ideas and charts in the comments section below! This is best way to keep it relevant, support us, keep the content here free and allow the idea to reach as many people as possible. **
-------------------------------------------------------------------------------
💸💸💸💸💸💸
👇 👇 👇 👇 👇 👇

BITCOIN BULLISH MOMENTUM CONTINUATION? 125K Still possible?BTC/USDT 1H – Breakout Setup
Cup & Handle forming right under FVG zone, showing early bullish intent.
Recent tariff crash created the swing low and possible reaccumulation zone.
POC: 121K — strong magnet if price breaks higher.
Key Levels:
🔹 115K → Breakout confirmation level
🔹 120K → Mid FVG / Resistance
🔹 121K → POC target
🔹 125K → Next liquidity zone
🔹 110K / 105K / 100K → Downside supports
Bullish case:
Close above 115K = breakout → target 121K–125K (FVG fill + liquidity grab).
Bearish case:
Fail to hold 115K → drop to 110K → 105K → 100K possible.
Summary:
Cup & Handle under FVG + tariff crash low = potential bullish reversal zone.
Watch 115K — that’s the key trigger for direction.

NASDAQ 100 (NQ1!): Still Bullish! Wait For Valid Buys!Welcome back to the Weekly Forex Forecast for the week of Oct. 13 - 17th.
In this video, we will analyze the following FX market: NASDAQ (NQ1!) NAS100
The NASDAQ dumped last Friday with the Trump tariffs on China announcement. His latest tweet seems to have lowered the temperature on the tension. The markets have opened with a gap up.
The plan: look for valid buy setups, and stay with the overall trend. Avoid selling this market.
Simple.
Enjoy!
May profits be upon you.
Leave any questions or comments in the comment section.
I appreciate any feedback from my viewers!
Like and/or subscribe if you want more accurate analysis.
Thank you so much!
Disclaimer:
I do not provide personal investment advice and I am not a qualified licensed investment advisor.
All information found here, including any ideas, opinions, views, predictions, forecasts, commentaries, suggestions, expressed or implied herein, are for informational, entertainment or educational purposes only and should not be construed as personal investment advice. While the information provided is believed to be accurate, it may include errors or inaccuracies.
I will not and cannot be held liable for any actions you take as a result of anything you read here.
Conduct your own due diligence, or consult a licensed financial advisor or broker before making any and all investment decisions. Any investments, trades, speculations, or decisions made on the basis of any information found on this channel, expressed or implied herein, are committed at your own risk, financial or otherwise.

NASDAQ Faces Downside Risk Amid Tariff and Shutdown UncertaintyUSNAS100 – Technical Outlook Aligned with Fundamentals
The Nasdaq 100 fell sharply on Friday, losing nearly 1,200 points within six hours as it retreated from its all-time high.
The drop came amid renewed U.S.–China tariff tensions and growing uncertainty from the ongoing U.S. government shutdown, which has delayed key economic data releases and weighed on sentiment ahead of third-quarter earnings season.
Technically, the index is showing clear bearish pressure, and sellers will likely maintain control while the price remains below 23,930.
A short-term corrective rebound toward 24,160 – 24,350 is possible before renewed downside momentum.
If the price closes a 1H or 4H candle below 23,930, it would confirm a continuation of the bearish trend, opening the way toward 23,700 → 23,500 → 23,350.
Conversely, as long as the index trades above 23,930, limited corrections may occur, but overall bias remains weak under current macro headwinds.
Pivot Line: 23,930
Support Levels: 23,700 / 23,500 / 23,350
Resistance Levels: 24,160 / 24,340 / 24,480
Summary:
Fundamental headwinds — from tariff threats to the shutdown’s data vacuum — are fueling pressure on tech stocks.
Technically, bias stays bearish below 23,930, with a potential correction toward 24,350 before continuation to the downside.

The NQ dumped to a 4 hour order block created Sept 14th 11pm ESTThe NQ dumped to a 4 hour order block that was created Sunday Sept 14th 11pm EST
Could be coincidence and would make sense to reverse (if it does Monday), but this chart looks TOO Perfect .
Insider Trading at the highest level?
Just looks to perfect to be organic.
I will have my longs in at open, see you at open! : )

$MSTR Swing Trade Setup: Layered Short Entries on Breakout📉 MSTR "STRATEGY INC" STOCK – Bearish Thief Plan (Swing/Scalp Setup)
⚡ Trade Setup (Bearish Pending Order Plan)
Asset: NASDAQ:MSTR (MicroStrategy Inc.)
Plan: Bearish (waiting for support breakout confirmation).
Entry Zone:
Pending breakout entry @ 320.00 ⚡
Layered “Thief” Strategy (scaling entries):
Sell Limit Layers: 340.00 / 330.00 / 320.00
You may add or adjust layers based on your own risk tolerance.
🔔 Set TradingView alerts at breakout levels to track price action.
Stop Loss (Thief Style):
Protective SL @ 360.00 (after breakout confirmation).
Adjust per your strategy & risk management.
Target Zone (Exit):
Police barricade support @ 290.00
Note: Take profit is discretionary — escape with profits at your own chosen level 🚪💰.
🔑 Why This Plan? (Thief Strategy Context)
The Thief Plan = using multiple layered limit entries after a breakout for better risk/reward.
Scaling entries gives flexibility while reducing FOMO and chasing.
Exit early at support barricades or oversold traps.
📊 MicroStrategy (MSTR) Market Data Report
As of September 7, 2025
1. Retail & Institutional Sentiment 🤝
Retail: Mixed / cautious (crypto exposure volatility).
Institutional: Neutral → slightly bearish (Bitcoin correlation + regulatory risk).
Estimated Sentiment: 55% Neutral / 30% Bearish / 15% Bullish.
2. Fear & Greed Index 😨😋
Current level: Neutral ~50/100
Suggests balanced emotions → no extreme greed or fear.
3. Fundamental & Macro Scores 📈📉
Fundamental ~60/100: MSTR tied to Bitcoin trends, highly volatile.
Macro ~55/100: Pressures include crypto regulation, tech volatility, interest rates.
Bitcoin remains the key driver.
4. Market Outlook 🐂🐻
Bull Case: BTC rally → MSTR boost, institutional adoption helps.
Bear Case: Regulatory clampdowns, BTC volatility → downside pressure.
Overall: Neutral → Slightly Bearish (short-term caution).
🚀 Key Takeaways
NASDAQ:MSTR moves in sync with Bitcoin → monitor BTC charts closely.
Sentiment is not strongly bullish → short setups have edge here.
Thief layering strategy aligns with volatility.
Always respect SL & manage risk 🔐.
🔗 Related Pairs to Watch
BITSTAMP:BTCUSD
NASDAQ:COIN (Coinbase)
NASDAQ:RIOT (Riot Platforms)
NASDAQ:MARA (Marathon Digital)
SP:SPX / NASDAQ:NDX (macro impact on tech/crypto plays)
✨ “If you find value in my analysis, a 👍 and 🚀 boost is much appreciated — it helps me share more setups with the community!”
#MSTR #MicroStrategy #Stocks #SwingTrade #Scalping #BearishSetup #CryptoStocks #LayeredStrategy #ThiefPlan #BitcoinCorrelation #TradingViewIdea

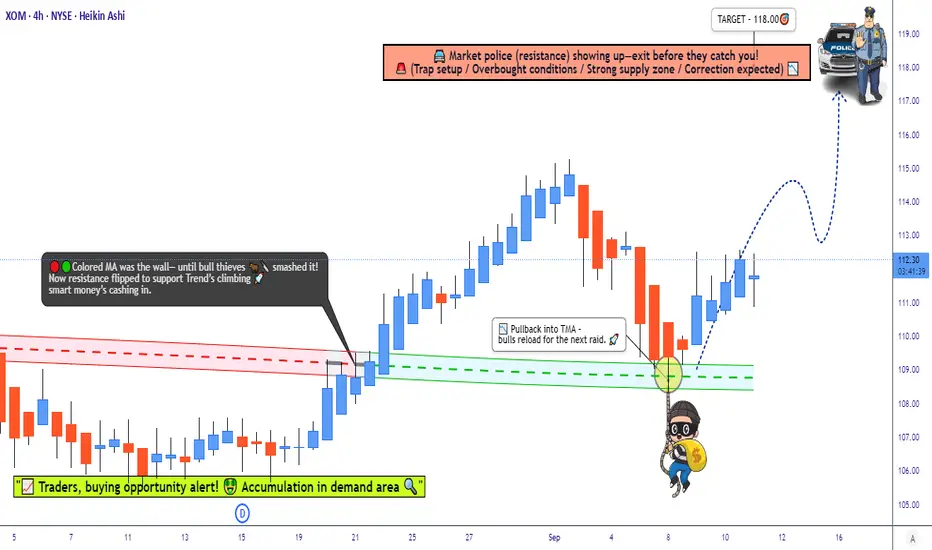
Exxon Mobil Stock Outlook: Fundamentals + Technicals Aligned📌 Exxon Mobil Corporation (XOM) — Bullish Master Plan (Swing / Scalping Trade)
🛠️ Plan Setup (Thief Strategy)
Bias: Bullish — Triangular Moving Average Pullback 📈
Entry: Multiple layered limit orders at 🔹 $110.00 🔹 $111.00 🔹 $112.00 (You can adjust layers based on your own strategy).
Stop Loss (Protective Layer): $108.00 (adjust to your own risk preference).
Target Zone: Around $118.00 (key resistance area).
⚠️ Note: These levels are not financial advice. Manage risk carefully and adjust according to your own strategy.
❓ Why This Plan?
This Thief Plan Strategy uses layered limit orders for flexible entries. It combines technical pullback signals with fundamental, macro, sentiment, and fear/greed insights to build a confluence-based trade idea.
📊 Stock Price Overview
Daily Change: -0.20% (from $112.50 previous close)
1-Month Trend: +5.66% (from $106.27 on Aug 12)
1-Year Trend: -4.21% (from $117.22 in Sep 2024)
Year-to-Date: +2.26% (from $109.57 in 2024)
😊 Investor Sentiment
Retail Investors: 50.76% bullish 😄
Institutional Investors: 47.25% bearish 😕
Overall Mood: Mixed ⚖️
😨 Fear & Greed Index
Current Level: 39 (Fear)
Interpretation: Cautious tone, may signal undervaluation.
📈 Fundamental Score (7.55/10) ✅
Strong revenue: $340.57B in 2024 (+1.16% YoY) 💰
Stable dividend: $0.99/share quarterly 🎉
Weaknesses: Net profit -6.47% in 2024, higher operating costs 📉
🌍 Macro Score (6.8/10) 🌎
Oil demand projected to rise 20% by 2050 🛢️
Geopolitical risks support oil prices 🔥
OPEC+ output hike could moderate momentum 📉
🐂🐻 Market Outlook
Consensus: Neutral → Mildly Bullish ⚖️
Analyst Ratings: Moderate Buy (12 Buy, 7 Hold, 0 Sell)
Key Drivers: Stable fundamentals + oil price volatility = balanced setup.
🔑 Takeaway
Exxon Mobil (XOM) offers a layered-entry bullish opportunity with mixed sentiment but strong long-term fundamentals.
Fear-dominated mood may provide contrarian opportunities.
Keep an eye on oil prices & geopolitics for momentum triggers.
Layering strategy provides flexibility across multiple levels. 🚀
🔗 Related Pairs to Watch (in USD)
Chevron Corporation (CVX): Another oil major with similar exposure to crude prices. 🛢️
United States Oil Fund (USO): Tracks WTI crude oil prices, a key driver for XOM. 📈
Energy Select Sector SPDR Fund (XLE): Broad energy sector ETF for context. 💡
✨ “If you find value in my analysis, a 👍 and 🚀 boost is much appreciated — it helps me share more setups with the community!”
#XOM #ExxonMobil #EnergyStocks #SwingTrade #Scalping #StockMarket #Oil #Fundamentals #TechnicalAnalysis #Macro #FearGreedIndex #TradingStrategy #LayeredEntry #StockIdeas
QQQ Resistance - Big pullback or breakout comingAs you can see from the trend lines, we are about to touch resistance. The last two times this happened we got a sizable pullback. During COVID, it was a breakout. QQQ just keeps pushing higher on the AI trade as the bubble just continues to grow. The AI trade is still strong. Right now companies are making massive "deals" (okay, promises) and stocks just keep exploding. It will be interesting to see how this plays out in the next few weeks.

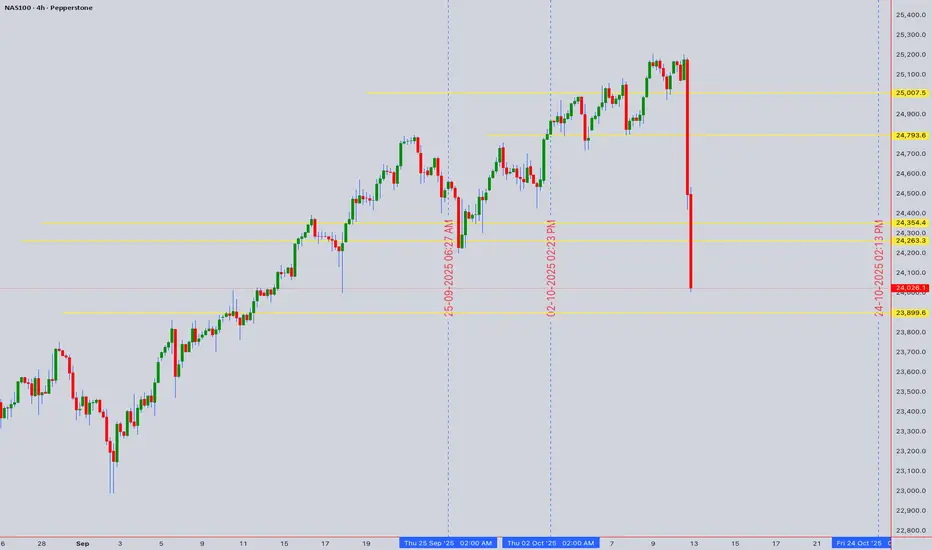
NAS100 Decision Point at All-Time HighsNAS100 Decision Point at All-Time Highs
Asset: NAS100 (NASDAQ 100) 11th Oct 2025 UTC+4
Closing Price: 24,026.1 | Bias: Neutral, awaiting breakout confirmation.
1. Multi-Timeframe Market Structure
Daily Chart Context: The index is in a powerful, sustained uptrend, trading near all-time highs. The recent consolidation suggests a pause within the broader bullish structure.
Critical Resistance: 24,200 - 24,300. A confluence of the recent swing high and a psychological barrier. A decisive daily close above 24,300 is the key bullish trigger.
Key Support Levels:
Immediate: 23,900 (Recent swing low & 4H consolidation base).
Primary: 23,650 - 23,750 (Previous resistance, now key support & 50 EMA area).
Major: 23,400 (Would signal a deeper correction).
2. Chart Pattern & Wyckoff/Elliott Wave Context
Pattern: The price action from the September low exhibits characteristics of a Wyckoff Accumulation phase, followed by a strong markup. The current pause could be a re-accumulation before the next leg up, or a distribution.
Elliott Wave Count: The rally from the ~23,400 low is impulsive. We are likely in a Wave 4 (corrective) consolidation. A break above 24,200 would confirm the start of Wave 5 towards new highs. A break below 23,650 would invalidate this count.
3. Indicator Confluence & Momentum
Ichimoku Cloud (Daily): Price is well above the Senkou Span (Cloud), confirming the strong bullish trend. The cloud itself is thick and rising, providing strong dynamic support.
RSI (14): On the daily, RSI is neutral (~60), not yet overbought, leaving room for further upside.
Bollinger Bands (4H): Price is hugging the upper band, indicating strength. A move to the middle band (~23,950) would be a healthy pullback.
Moving Averages: The 50 EMA (23,850) and 200 EMA (23,500) are bullishly aligned, acting as dynamic support layers.
Actionable Trading Plan
Intraday Trading (Based on 1H/15M Charts)
Bullish Breakout Setup:
Trigger: Sustained price action above 24,150 with rising volume.
Buy Entry: On a pullback to 24,100-24,130, or a break of 24,200.
Stop Loss: Below 24,000.
Targets: 24,300 (TP1), 24,450 (TP2).
Bearish Rejection Setup:
Trigger: Bearish reversal candle (e.g., Shooting Star, Bearish Engulfing) at 24,150-24,200.
Sell Entry: On the confirmation of the rejection.
Stop Loss: Above 24,250.
Targets: 23,950 (TP1), 23,850 (TP2).
Swing Trading (Based on 4H/Daily Charts)
Long Swing Entry:
Condition: Wait for a daily close above 24,300.
Entry: On the next pullback towards 24,200 (new support).
Stop Loss: Below 23,900.
Target: 24,600 - 24,800.
Short Swing Entry (Counter-Trend):
Condition: A clear break and close below 23,900.
Entry: On a retest of 23,900 as resistance.
Stop Loss: Above 24,100.
Target: 23,750, then 23,650.
Risk & Trade Management Note
The current setup is a high-probability bull trap if price fails at the 24,200 resistance. Conversely, a breakout opens significant upside. Do not chase price in the middle of the range. Patience for a confirmed trigger is key. Always use a stop-loss and manage position size accordingly.
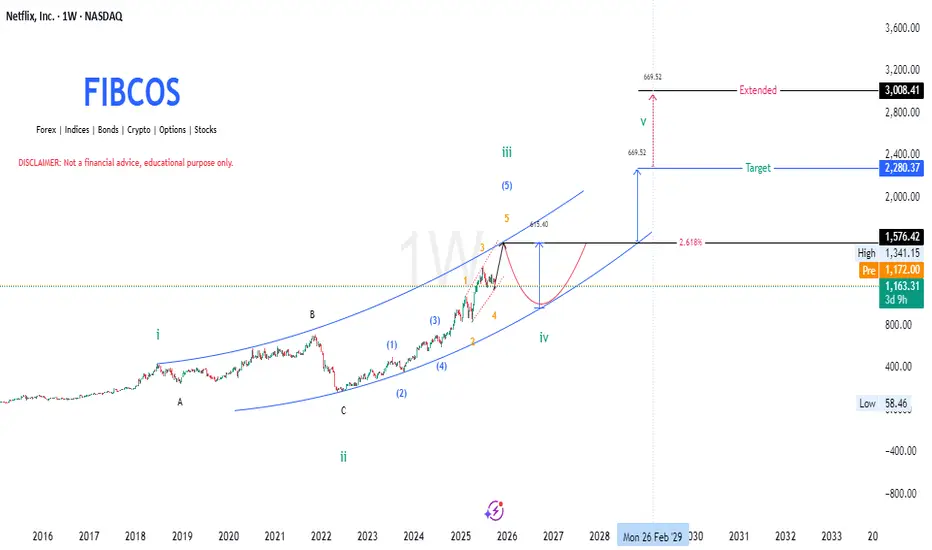
Netflix (NFLX) - Descriptive Analysis by FIBCOS📘 NFLX 2009–2029 Descriptive Analysis
This is a detailed Elliott Wave Theory -based outlook for Netflix (NFLX) stock from around 2009 to the projected future of 2029, and it incorporates Fibonacci retracement & extensions, Smart Money Concepts (SMC) , and Price Action structure within a channel.
Let’s break this down chronologically and structurally:
🌀 Wave Theory Confluence (Elliott Wave Structure)
The long-term structure of Netflix (NFLX) from 2009 to the projected 2029 period follows a classic Elliott Wave cycle, now realigned with the cycle top in mid-2018 and the macro correction ending in mid-2022.
1. Cycle Wave i (2009–2018):
NFLX entered a powerful multi-year rally, forming five sub-waves within this first major impulse. This long rally ended in mid-2018 , marking the top of Cycle Wave i .
2. Cycle Wave ii – ABC Correction (2018–2022):
From the 2018 top, the price entered a prolonged and complex 4-year correction, unfolding as a classic A-B-C corrective structure.
Wave A began the decline with a sharp markdown.
Wave B was a fake recovery, leading to Wave C, a deeper liquidation into mid-2022 , completing the correction.
This phase aligns with a major redistribution cycle where smart money exited positions, and retail investors were caught in hope rallies.
3. Cycle Wave iii (2022–2025):
After finding a bottom in mid-2022, the stock launched a new impulsive rally , forming five sub-waves (1–5) of a powerful Wave iii
Momentum accelerated in wave 3 of iii (typical in Elliott Wave), and the structure is now peaking as of late 2025, around $1,576.42.
This marks the expected completion of Wave iii, with signals pointing toward a correction.
4. Cycle Wave iv (Expected 2025–2027):
A corrective wave iv is expected to unfold, possibly returning toward the lower bound of the long-term ascending channel.
According to the principle of alternation , since wave ii was deep and complex, wave iv may be shallower or more sideways.
5. Cycle Wave v (Expected 2027–2029):
After the wave iv correction, a final impulsive leg — Wave v — is expected to push the price higher, targeting around $2,280.37 , with a potential extended move to $3,008.41 .
This will complete the macro 5-wave cycle that began in 2009.
📐 Fibonacci Confluence
The Fibonacci structure supports these wave formations:
The 2.618 extension of the previous impulse wave (measured from the 2022 bottom) projects a price target near $2,280.37 , aligning with historical extension zones.
The extended target at $3,008.41 aligns with the upper boundary of the long-term channel — often reached during euphoric final waves.
Prior retracements during wave ii and the anticipated retracement in wave iv fall into common Fibonacci pullback zones (0.382–0.618).
Fibonacci tools confirm that price has behaved symmetrically within the wave cycles, and provide high-probability zones for both correction and expansion.
🧠 Smart Money Concept (SMC)
From a Smart Money perspective, the chart reflects a complete institutional cycle:
Distribution Zone (2017–2018):
Smart money exited during the late stages of Cycle Wave i. This aligns with the cycle top in mid-2018 , often accompanied by overvaluation and high optimism.
Re-Accumulation Phase (2018–2022):
The 4-year correction allowed institutional players to accumulate at discounted prices during wave C. Retail was largely shaken out, and liquidity was swept multiple times.
Expansion Phase (2022–2025):
From the 2022 bottom, price moved sharply upward in a clean impulse (Wave iii), confirming institutional interest. Gaps, strong breakouts, and efficient trends reflected low-resistance expansion driven by smart money.
Future Distribution (2029?):
Around the projected $2,280–$3,008 range (Wave v), expect distribution signs —including deviation from trend, order block mitigation, and liquidity grabs. These are typical before a larger market reset.
Smart Money Concepts help explain the why behind each wave: fear and euphoria don’t happen randomly — they are often orchestrated phases of value transfer.
📊 Price Action Structure
The long-term price action of NFLX reinforces the wave count and market psychology:
2009–2018 (Wave i):
Price action showed a steady trend of higher highs and higher lows , with smooth breakouts and momentum-driven runs.
2018–2022 (Wave ii correction):
A breakdown in structure occurred. Lower highs and a wide, overlapping correction defined this multi-year distribution. Key support levels were breached and retested as resistance — a classic bearish shift in structure.
2022–2025 (Wave iii):
Clean, impulsive movement resumed. Breakouts, bullish flags, and retests marked key continuation zones. Market structure flipped back bullish with efficient rallies.
2025–2027 (Wave iv expected):
A retracement is likely toward previous demand zones , possibly aligning with wave 4 of the lower-degree impulse, respecting Elliott’s guideline of wave 4 often retracing to the territory of wave 4 of the previous degree.
2027–2029 (Wave v projection):
Anticipate price pushing into new highs, with potential overextension . However, bearish divergence and slowing momentum could foreshadow the macro top.
This structure shows how technical behavior mirrors emotional and fundamental phases — from greed to fear, and back again.
📆 Timeline Summary (2009–2029)
2009–2018:
Powerful multi-year impulse forms Cycle Wave i , ending in mid-2018.
2018–2022:
A deep, multi-legged ABC correction forms Cycle Wave ii , ending in mid-2022.
2022–2025:
Explosive impulsive rally forms Cycle Wave iii , currently completing around $1,576.42.
2025–2027 (Expected):
A corrective pullback forms Cycle Wave iv , likely more sideways or shallow in structure.
2027–2029 (Expected):
Final rally completes Cycle Wave v , with price targets between $2,280.37 and $3,008.41 , ending the macro Elliott structure.
🔚 Conclusion
With the cycle top revised to mid-2018 and the correction ending mid-2022 , the chart structure becomes even more aligned with classic Elliott Wave theory and Smart Money behavior.
Netflix’s long-term chart is a perfect confluence of:
Elliott Wave structure (impulse → correction → impulse),
Fibonacci precision,
Institutional manipulation (SMC), and
Clear price action behavior.
The roadmap to 2029 shows exciting bullish potential, but also highlights the need for caution near projected macro top zones — where institutional distribution may quietly unfold again.
📘 DISCLAIMER: This is a structural, educational market outlook. Not financial advice. Please do your own due diligence and risk management.
#Netflix, #NFLX, #Nasdaq #WaveTheory, #Fibonacci, #SmartMoney, #PriceAction
Bitcoin vs. NASDAQNASDAQ still has some steam left until it tops. That may take Bitcoin a but further from the current than $126K but not by a lot. From here on, Bitcoin will probably correct a lot and then make a comeback once NASDAQ picks up. It will probably top at around ~$130K at the end of Q42025 / Q12026.

$Solana $250+ or DOWN 216?In our recent post, we perfectly predicted the touch of 250 and 190.
Price has now reversed off the supply zone and is making its way back up, lets see what the potential out come for the next two weeks are!
Solana (SOL/USDT) 1H Chart Analysis
Current Price: ~$232
Trend : Price is was inside a clear ascending channel, respecting support and resistance lines - however has now breached resistance.
Key Levels
Support Zones:
$225 → Psychological support + 4H FVG.
$216 → Deeper 4H FVG and strong volume node. ( + 4 Hour Fib GP )
$200 → Major psychological level + prior supply zone flip.
Resistance Zones:
$250 → Psychological resistance + demand zone.
$275 → Next major resistance if $250 breaks.
Bullish Scenario
If SOL holds above $225 and consolidates within the trend channel, price could retest $250.
Break and close above $250 may extend rally toward $275.
Bearish Scenario
Failure to hold $225 could drag SOL to the $216 FVG or even $208.
A breakdown of $208 increases risk of revisiting $200.
Summary
Market structure remains bullish as long as price respects the rising trendline.
$225 is the key short-term pivot: holding above favors $250+, losing it opens downside risk toward $216–200.
Let me know what you think!

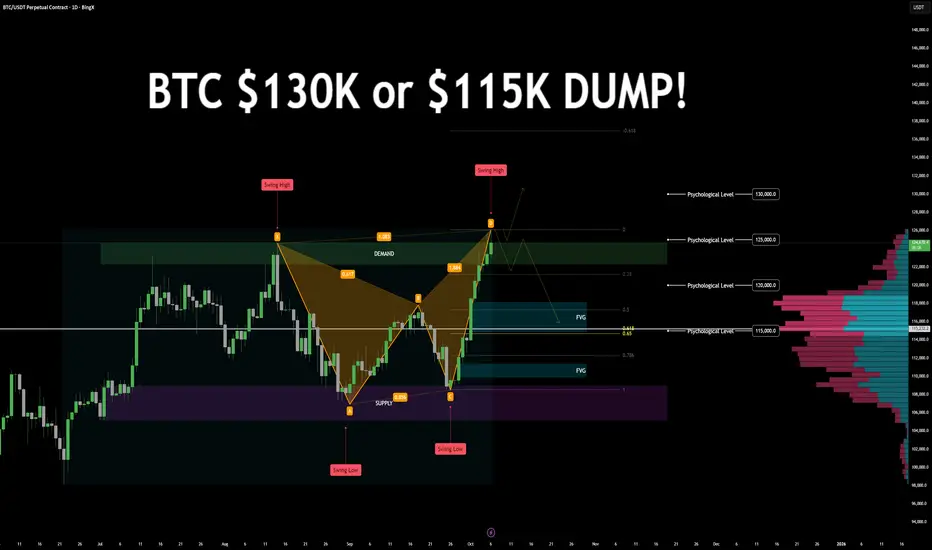
$BTC Daily chart $130K! or $115k DUMPBTC/USDT – Bearish Harmonic Formation | Key Levels & Scenarios
Technical Overview:
Price is currently forming a bearish harmonic pattern, approaching a key decision zone. The next few daily candles will determine whether BTC continues its bullish trend or initiates a corrective phase.
Key Zones
Demand: 122.2K – 124.7K
Supply: 105.1K – 108.9K
Psychological Levels: 130K · 125K · 120K · 115K
Golden Pocket: Around 115K (0.618–0.65 retracement)
Fair Value Gaps (FVGs):
115K–118K
110K (secondary FVG)
Swing Points:
Previous Swing Low: 108K
Previous Swing High: 126K
High Volume Nodes: 118K and 115K
Market Structure
BTC is respecting a consistent bullish leg with limited pullbacks. Price recently swept the 125K psychological level, aligning with harmonic completion and demand resistance.
Scenario Outlook
🔼 Bullish Continuation:
A daily close above the 124.7K demand zone could invalidate the bearish harmonic and signal continuation toward 130K+ targets.
🔽 Bearish Reversal:
A close below the previous day’s candle low may confirm the start of a bearish correction, targeting 118K → 115K, and potentially 110K.
Bearish Confluences
Bearish Harmonic Pattern completion near key resistance.
Golden Pocket + FVG + Psychological + Volume confluence at 115K.
Extended bullish leg with no significant retracement, followed by 125K liquidity sweep.
LET me know your thoughts below!
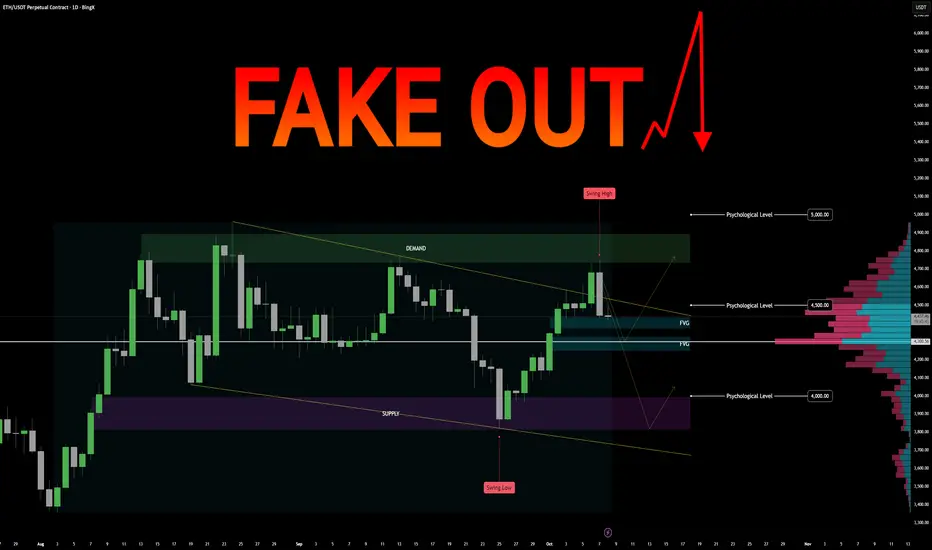
$ETH Market Assessment Incoming FAKEOUT? ETH/USD Perpetual – Market Assessment
Key Zones
Demand: 4737 – 4895
Supply: 3818 – 3994
Fair Value Gaps (FVGs): 4433, 4326
Anchored Volume Node: 4300 (significant liquidity cluster)
Psychological Levels : 4000, 4500, 5000
Recent Swing Points: High 4753, Low 3821
Technical Structure
High-Time Frame (HTF) Analysis:
Pattern: Bullish flag
Interpretation: Indicates potential continuation to the upside if price breaks above the flag resistance.
Daily-Time Frame (DTF) Analysis:
Pattern: Bearish channel
Interpretation: Suggests a slightly bearish pressure on the daily trend; caution required for long positions.
Volume and Liquidity:
Anchored volume node at 4300 aligns closely with FVGs at 4326 and 4433 – this area may act as strong support on pullbacks.
Scenario Planning
Bullish Scenario:
Price holds above demand zone (4737–4895).
Break above recent swing high at 4753 confirms bullish momentum.
Potential targets: 4895, 5000 psychological resistance.
Pullbacks likely to find support at FVGs (4433, 4326) or volume node (4300).
Bearish Scenario:
Price fails to hold demand zone and breaks below recent swing low 3821.
Next support: supply zone 3818–3994, then psychological level at 4000.
FVGs and volume node may temporarily slow the downside movement.
Summary / Notes
HTF indicates bullish continuation potential; daily trend shows bearish pressure.
Demand and supply zones, FVGs, and volume nodes are key levels for trade planning.
Monitor price reactions at swing points, psychological levels, and liquidity clusters to confirm trade setups.
Trade management should consider both bullish and bearish contingencies, with SLs placed near key FVGs or volume nodes.
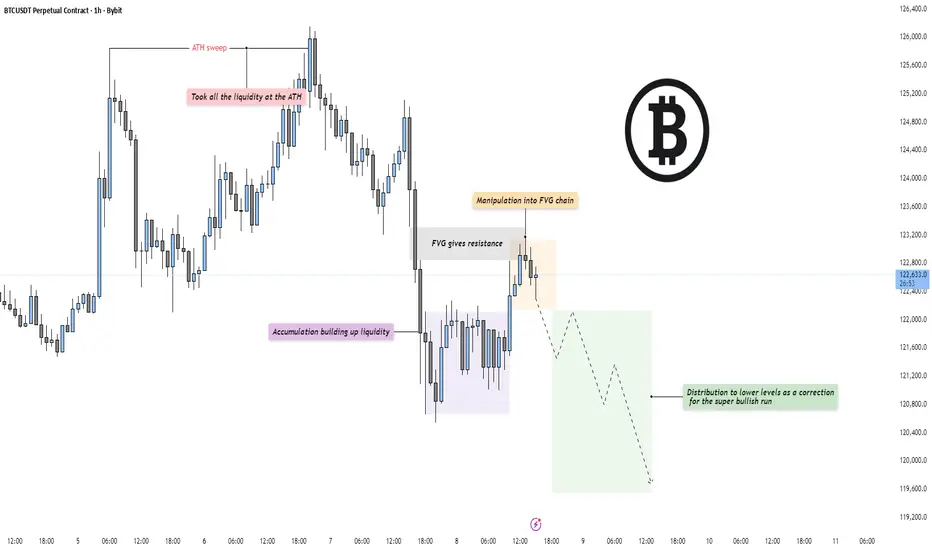
BTC - Distribution after ATH sweepMarket Context
Bitcoin has completed a clear liquidity sweep at the all-time high (ATH) and is now transitioning into a corrective phase. After taking all the liquidity above the prior high, price aggressively rejected and shifted structure to the downside, signaling that smart money may now be engineering a retracement. The move lower has found a temporary pause within a lower accumulation zone where liquidity is rebuilding.
Fair Value Gaps & Manipulation
Following the ATH sweep, price manipulated back into a fair value gap (FVG) chain, where it met resistance. This area acted as a precise reaction point, rejecting further bullish attempts and confirming the FVG as an active supply zone. Each touch into this chain has resulted in lower highs, supporting the idea that distribution is underway. The fair value gaps below are likely to be targeted next as price seeks efficiency.
Liquidity Dynamics
Liquidity above has already been collected — the current draw now lies beneath. The accumulation zone below current price holds resting sell-side liquidity, and the market could aim to fill those inefficiencies before finding new demand. A retracement into these lower levels would act as a healthy correction to the prior bullish impulse, maintaining structural balance.
Final Thoughts
The market has shifted from an aggressive expansion phase to a potential distribution stage. With liquidity taken at the highs and FVGs now providing resistance, the bias leans toward a corrective move lower before any renewed bullish continuation. A break below the local accumulation floor would confirm deeper targets.
If this breakdown helped clarify the current BTC structure, a like is always appreciated — and let me know: are you positioning for the correction, or waiting for the next bullish leg to form?
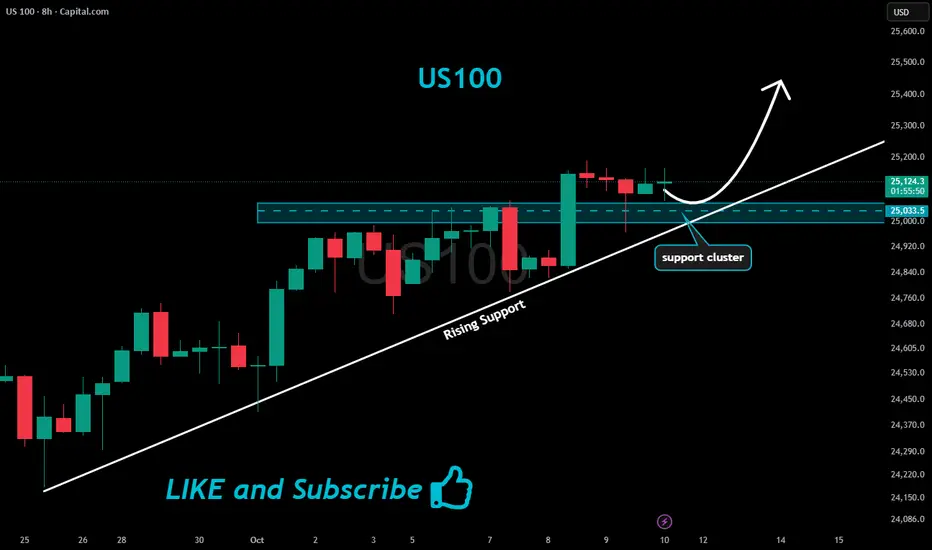
US100 Will Keep Growing!
HI,Traders !
#US100 is trading in an
Uptrend and broke
The key horizontal level
Of 25033.5 and the breakout
Is confirmed so after a potential
Retest of the support cluster
Of the rising and horizontal
Support lines below we will
Be expecting a bullish continuation !
Comment and subscribe to help us grow !
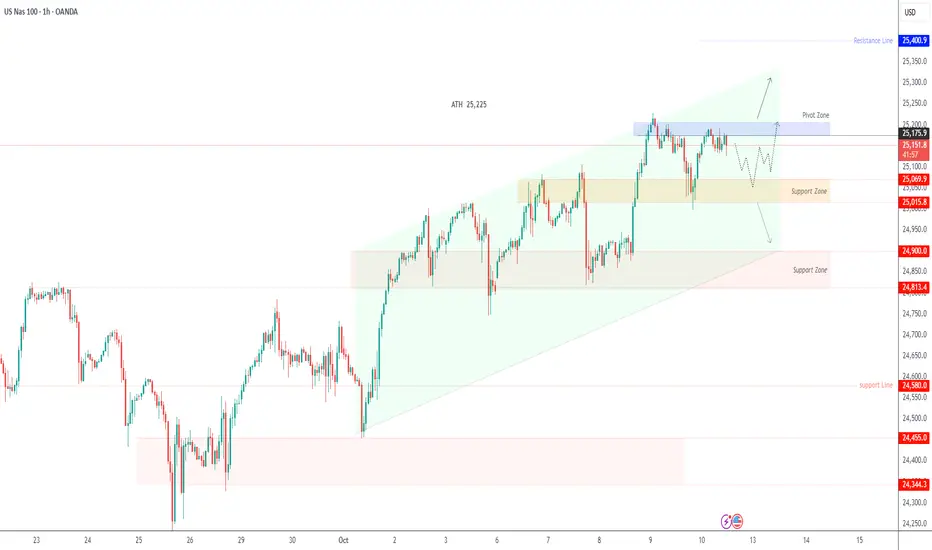
USNAS100 – Range Consolidation Before Breakout, Key Zone: 25,175USNAS100 – Overview | Range-Bound Ahead of Key Market Events
The NASDAQ 100 rebounded from the support zone highlighted earlier, though market sentiment remains cautious ahead of upcoming U.S. data releases and the prolonged government shutdown.
Price action shows consolidation near the upper range, with short-term traders watching for a breakout to define direction.
Technical Outlook
The index is currently capped below the 25,175 – 25,225 zone.
As long as price trades beneath this resistance band, momentum favors a bearish correction toward 25,070 → 25,015, and a sustained move below 25015 could extend losses to 24900.
Conversely, a 1-hour close above 25,220 would confirm a bullish breakout and open the path toward 25,300 → 25,390, with further upside potential if buyers remain in control.
Pivot Line: 25 175
Resistance: 25 300 · 25 390 · 25 450
Support: 25 070 · 25 015 · 24 900
Summary:
USNAS100 remains range-bound, trading between 25,070 and 25,225.
A breakout on either side of this range will define the next intraday move—above 25,220 favors continuation toward 25,390, while below 25,015 signals deeper correction toward 24,900.
$NKE Inverse Head and Shoulder $117 to gap fillThe chart is currently forming a classic Inverse Head and Shoulders pattern, which is a bullish reversal setup. The left shoulder and head have already been established, and the right shoulder is in development, suggesting a potential breakout to the upside. The neckline resistance appears to be around the $73-$85 range. A confirmed breakout above this level could trigger a measured move toward the $117 gap fill, which aligns with a previous price gap and serves as a logical target for bullish momentum.
Key technical highlights:
Target Price: ~$117 (gap fill zone)
If volume confirms the breakout above the neckline, this setup could offer a strong risk/reward opportunity for traders. Keep an eye on RSI and MACD for confirmation of bullish momentum.
