NASDAQ 100 Technical Analysis & ForecastNASDAQ 100 (NAS100) Technical Analysis & Forecast
Current Price: 24,781.00 | Date: October 4, 2025, 12:54 AM UTC+4
📊 EXECUTIVE SUMMARY
The NASDAQ 100 is currently trading at 24,781.00, showing resilience near all-time highs. This comprehensive analysis integrates multiple technical frameworks to provide actionable insights for both intraday and swing traders navigating the tech-heavy index.
Key Takeaway: NAS100 exhibits a cautious bullish bias with critical support at 24,650 and resistance at 25,100. Traders should monitor for potential consolidation before the next directional move.
🔍 MULTI-TIMEFRAME TECHNICAL ANALYSIS
Monthly & Weekly Outlook (Swing Trading Perspective)
Long-term Trend Assessment:
Primary Trend: Bullish structure remains intact with higher highs and higher lows established since Q4 2024
Elliott Wave Count: The index appears to be in Wave 5 of a larger impulse structure from the 2022 lows, suggesting a mature bull cycle
Ichimoku Cloud (Weekly): Price trading above the cloud with Tenkan-sen (9-period) above Kijun-sen (26-period), confirming bullish momentum
Key Weekly Levels:
Major Resistance: 25,200 - 25,350 (psychological level and prior consolidation zone)
Major Support: 24,200 - 24,350 (former resistance turned support, 20-week EMA)
Critical Support: 23,500 (50-week EMA, must hold for bull trend continuation)
Gann Analysis:
Square of 9 calculation from recent lows suggests the next significant price target at 25,088 (45° angle)
Time cycle analysis indicates potential volatility window October 8-12, 2025
Price-time squaring suggests equilibrium at current levels, with break expected by mid-October
Daily Chart Analysis (Swing & Position Trading)
Trend & Momentum:
50-day SMA: 24,420 (acting as dynamic support)
200-day SMA: 23,680 (long-term trend anchor)
RSI (14): Currently at 64, showing bullish momentum without overbought conditions
MACD: Positive histogram with signal line above zero, indicating upward momentum
Chart Patterns Identified:
Ascending Triangle Formation: Consolidation between 24,650 support and 25,100 resistance suggests a bullish continuation pattern
Wyckoff Analysis: Signs of re-accumulation phase (Trading Range) after the spring rally, indicating smart money positioning
Harmonic Patterns:
Potential Bullish Bat pattern completing near 24,650, with PRZ (Potential Reversal Zone) offering strong support
Fibonacci retracement from recent swing shows 61.8% level at 24,580, aligning with multiple support factors
Volume Profile:
VWAP (Anchored from Sept 1): 24,695 - price maintaining above VWAP indicates institutional buying
Volume Analysis: Above-average volume on up days suggests strong bullish participation
High Volume Node (HVN): 24,750-24,800 represents fair value area
4-Hour Chart (Transitional Timeframe)
Technical Indicators:
Bollinger Bands: Price trading in upper band (24,950), suggesting near-term overbought conditions but strong trend
RSI (14): 68 - approaching overbought but no bearish divergence yet
Stochastic Oscillator: %K at 82, %D at 76 - overbought territory, watch for crossover
Ichimoku System:
Price above cloud (bullish)
Lagging span above price (confirming bullish sentiment)
Cloud ahead is thin, suggesting potential resistance at 25,050-25,100
Support & Resistance:
Immediate Resistance: 24,950 → 25,100 (psychological and technical confluence)
Immediate Support: 24,650 → 24,500 (previous consolidation and EMA cluster)
1-Hour Chart (Intraday Swing Reference)
Short-term Momentum:
20 EMA: 24,745
50 EMA: 24,680
100 EMA: 24,620
Price trading above all key EMAs indicates short-term bullish control
Candlestick Patterns:
Recent formation of bullish engulfing patterns on hourly suggests buying pressure
No immediate reversal patterns detected
Warning Signs:
Potential Bear Trap: If price briefly breaks below 24,650 with low volume, expect quick recovery (trap for shorts)
Bull Trap Risk: Break above 25,100 without volume confirmation could reverse quickly
📈 INTRADAY TRADING STRATEGY (Week of October 4-11, 2025)
15-Minute & 30-Minute Chart Focus
Monday-Tuesday Bias: Consolidation expected between 24,650-24,950
Long Entry Strategies:
Setup 1: Support Bounce Play
Entry Zone: 24,650-24,700
Stop Loss: 24,580 (below harmonic PRZ)
Target 1: 24,850 (Risk:Reward 1:2)
Target 2: 24,950 (Risk:Reward 1:3.5)
Confirmation: RSI (15-min) oversold below 30, bullish candlestick reversal pattern
Setup 2: Breakout Play
Entry: Break and retest of 24,950 with volume
Stop Loss: 24,870
Target 1: 25,050
Target 2: 25,150 (ascending triangle measured move)
Confirmation: Volume 20% above average, 15-min candle close above 24,950
Setup 3: VWAP Reversion
Entry: Price touches VWAP (currently ~24,695) from above on 5-min chart
Stop Loss: 24,650
Target: 24,800-24,850
Confirmation: Volume spike on touch, bullish divergence on 5-min RSI
Short Entry Strategies:
Setup 1: Resistance Rejection
Entry Zone: 25,050-25,100
Stop Loss: 25,150
Target 1: 24,850
Target 2: 24,700
Confirmation: Bearish engulfing or shooting star on 15-min chart, RSI divergence
Setup 2: Failed Breakout (Bull Trap)
Entry: Price breaks 25,100 but closes back below within 2 candles (15-min)
Stop Loss: 25,130
Target: 24,800
Confirmation: High volume on breakout but no follow-through
🎯 SWING TRADING STRATEGY (October-November 2025)
Bullish Scenario (60% Probability)
Primary Strategy: Ascending Triangle Breakout
Entry Plan:
Aggressive Entry: Current levels (24,780) with tight risk management
Conservative Entry: Pullback to 24,500-24,650 support zone
Breakout Entry: Confirmed break above 25,100 with volume
Position Sizing:
Risk 1-2% of capital per trade
Scale in: 50% at first entry, 30% on confirmation, 20% on continuation
Price Targets:
Target 1: 25,350 (measured move from triangle)
Target 2: 25,800 (Fibonacci extension 1.618)
Target 3: 26,200 (psychological and Gann Square of 9 target)
Stop Loss Management:
Initial Stop: Below 24,500
Trail Stop: Move to breakeven once Target 1 is reached
Final Stop: Trail with 4-hour 20 EMA
Time Horizon: 3-6 weeks
Bearish Scenario (40% Probability)
Invalidation Triggers:
Break below 24,500 on daily close
Head and Shoulders pattern develops (left shoulder at 25,200, head forming now, right shoulder anticipated)
MACD bearish crossover on daily chart
Short Strategy (Swing):
Entry Conditions:
Daily close below 24,500
RSI breaks below 50 on daily
Death cross forming (50 SMA crossing below 200 SMA - currently not present)
Targets:
Target 1: 24,200 (weekly support)
Target 2: 23,850 (50-day SMA)
Target 3: 23,500 (major support and 50-week EMA)
Stop Loss: Above 24,800
📉 RISK FACTORS & MARKET CONTEXT
Technical Risk Factors:
Overextension: Weekly RSI approaching 70 suggests limited upside without consolidation
Volume Divergence: If breakout occurs with declining volume, suspect false move
Elliott Wave: If in Wave 5, expect exhaustion and correction before new highs
External Market Considerations:
Macroeconomic Factors to Monitor:
Federal Reserve policy statements (October FOMC meeting expectations)
Q3 2025 earnings season for mega-cap tech (starting mid-October)
Geopolitical tensions and their impact on risk sentiment
US Dollar strength affecting multinational tech companies
Sector-Specific Catalysts:
AI technology developments and adoption rates
Semiconductor supply chain updates
Regulatory environment for big tech
Interest rate trajectory impacts on growth stocks
🛡️ RISK MANAGEMENT RULES
For All Trading Timeframes:
Position Sizing: Never risk more than 2% of capital on single trade
Stop Loss: Mandatory on every trade, no exceptions
Take Profits: Scale out at predetermined levels (50% at T1, 30% at T2, 20% at T3)
Maximum Daily Loss: Stop trading if down 4% in single day
Correlation Risk: NAS100 correlates with QQQ, SPX, and major tech stocks - monitor for divergences
Trading Journal Requirements:
Document all entries with screenshots
Record reasoning and technical setup
Track hit rate and average risk:reward
Weekly performance review and strategy adjustment
📅 WEEKLY INTRADAY ROADMAP
Monday, October 7:
Bias: Neutral to slightly bullish
Key Level: 24,750 (Friday's close area)
Strategy: Wait for direction after Asian/European session
Action: If holds above 24,700, look for longs on 15-min pullbacks
Tuesday, October 8:
Bias: Testing resistance at 24,950
Gann Time Cycle: Potential volatility day
Strategy: Breakout or rejection trades
Action: High-probability setups at extremes
Wednesday, October 9:
Bias: Continuation or reversal confirmation day
Strategy: Follow Tuesday's direction with momentum
Action: Trail stops on profitable positions
Thursday, October 10:
Bias: Mid-week profit-taking possible
Strategy: Mean reversion trades if overextended
Action: Watch for VWAP reversion setups
Friday, October 11:
Bias: Week-end positioning, reduced size
Strategy: Close most intraday positions before weekend
Action: Only high-conviction swing trades held over weekend
🎓 INDICATOR CONFLUENCE SUMMARY
Bullish Signals (Current):
✅ Price above 50-day, 100-day, and 200-day SMAs
✅ Ichimoku cloud bullish on daily and weekly
✅ MACD positive on multiple timeframes
✅ Volume profile shows accumulation
✅ Ascending triangle continuation pattern
✅ Gann angles supporting upward trajectory
Bearish Warnings:
⚠️ RSI approaching overbought on 4-hour
⚠️ Potential Elliott Wave 5 exhaustion
⚠️ Bollinger Bands showing overextension
⚠️ Stochastic overbought on shorter timeframes
Neutral/Watch:
🔍 Volume needs to increase on breakout attempts
🔍 Wyckoff accumulation phase requires confirmation
🔍 Head and Shoulders pattern could develop if resistance holds
🎯 FINAL TRADING RECOMMENDATIONS
For Intraday Traders:
Focus on the 24,650-25,100 range for the next week. Best opportunities exist at range extremes with clear risk management. Favor long setups given the broader bullish context, but remain nimble and respect stop losses.
Best Intraday Timeframes: 5-min for entries, 15-min for trend confirmation, 1-hour for bias
For Swing Traders:
The ascending triangle offers an excellent risk:reward setup. Consider building positions on pullbacks to 24,500-24,650 with stops below 24,450. Target the 25,350-25,800 zone over the next 4-6 weeks. Monitor daily candle closes for trend confirmation.
Best Swing Timeframes: Daily for entries, 4-hour for momentum, weekly for trend validation
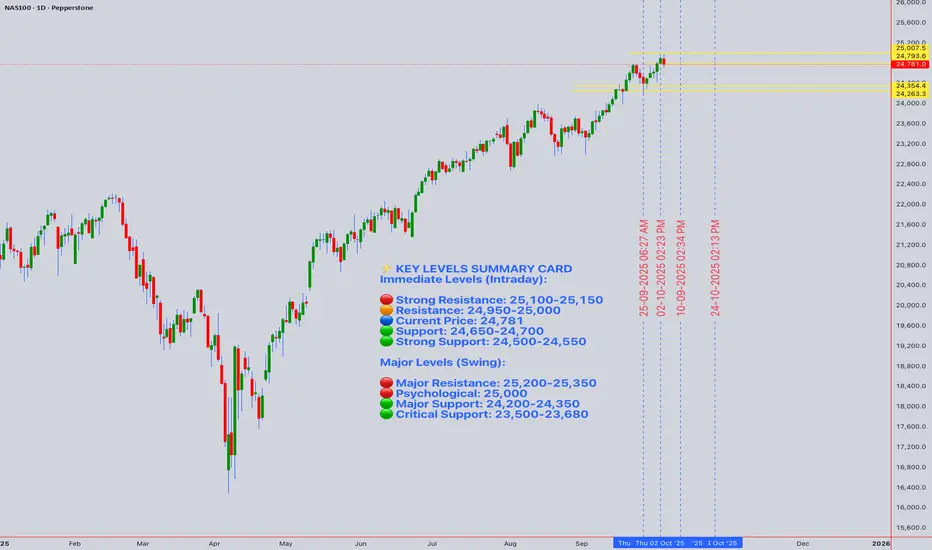
⚡ KEY LEVELS SUMMARY CARD
Immediate Levels (Intraday):
🔴 Strong Resistance: 25,100-25,150
🟠 Resistance: 24,950-25,000
🔵 Current Price: 24,781
🟢 Support: 24,650-24,700
🟢 Strong Support: 24,500-24,550
Major Levels (Swing):
🔴 Major Resistance: 25,200-25,350
🔴 Psychological: 25,000
🟢 Major Support: 24,200-24,350
🟢 Critical Support: 23,500-23,680
📝 DISCLAIMER
This analysis is for educational and informational purposes only. Trading financial instruments carries substantial risk and may not be suitable for all investors. Past performance does not guarantee future results. Always conduct your own research and consult with licensed financial advisors before making trading decisions. The author is not responsible for any trading losses incurred based on this analysis.
Next Update: October 11, 2025
Analysis Valid Through: October 18, 2025
Prepared using advanced technical analysis incorporating Wyckoff, Elliott Wave, Gann, Harmonic Patterns, Ichimoku, and modern momentum indicators.RetryClaude can make mistakes. Please double-check responses.
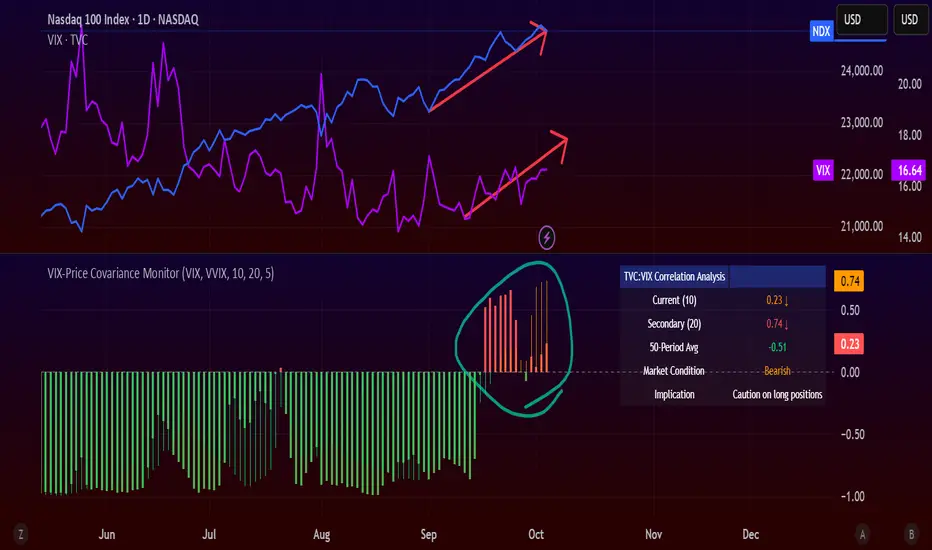
Nasdaq
ALERT: VIX-NDX COVARIANCE HITS DANGER ZONEA few days ago, my custom VIX–Price Covariance Monitor started flashing red... and it hasn’t cooled off since.
Here’s what that means 👇
- The TVC:VIX (volatility index) and NASDAQ:NDX (Nasdaq 100) are now moving in the same direction.
That’s not normal.
Usually, when stocks rise, volatility falls.
But when both start climbing together — it means something under the surface is fracturing.
Half the times this correlation flips positive, the market corrects or worse, it crashes.
I’m not panic‑selling, but I’m definitely not buying either for now.
No new longs unless it’s a screaming opportunity.
In the meantime? Stacking cash and sitting tight.
This is time to play close attention to the market,
ES continuing with my short stratStructure is key when identifying direction. Overall trend isnt as important as you think. When trading reversals I look for large moves in one direction that allows for large moves back, I capitalize off of finding the structure shift and I enter only on discount. Watch your win rate increase when entering deeper into discount.
Trade for Christ

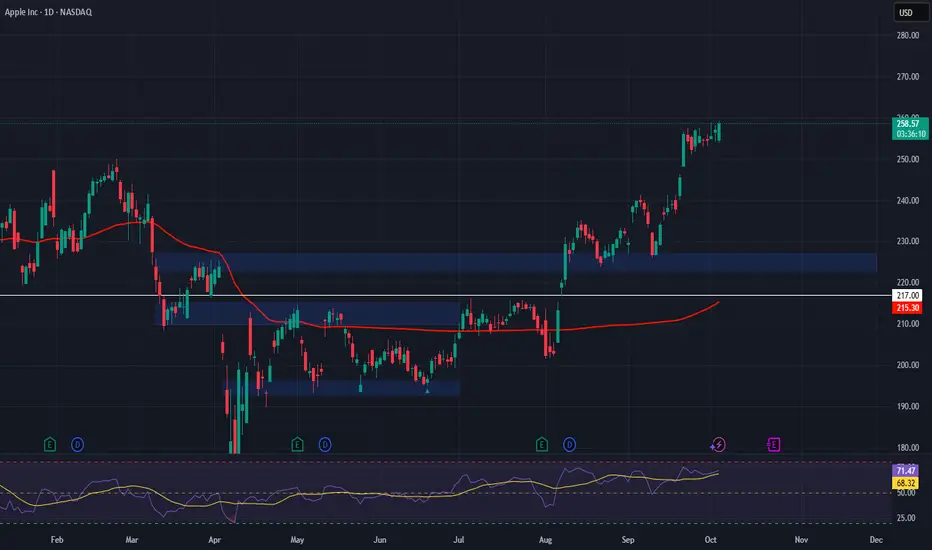
AAPL – Ready to Break Out Despite Macro NoiseMarkets are holding strong near all-time highs even amid the backdrop of a potential U.S. government shutdown. One standout name is Apple Inc. NASDAQ:AAPL , which has surged 32% since our last analysis. This rally confirms renewed momentum and continued investor confidence in large-cap tech.
Apple is in a strong uptrend, currently consolidating just below resistance. The structure is bullish, and a breakout seems likely. Any pullback toward support could offer a high-probability entry for trend followers.
🟩 Trade Setup
Entry Zone: $223 – $227 (support area)
Target Range: $237 – $259
Stop Loss: Close below $217
Watch price action near these levels and manage risk accordingly.
BUY NASDAQOn the Nasdaq Futures, we went long on the market since it grabbed the minor sellside liquidity and gave us a FVG to ride, our target is the buyside liquidity.
Follow for more!

Nasdaq to 25,300? | Long Idea 10/3I believe Nasdaq still has room to climb, with the 25,300 range in sight to finish off the week. The price action closely mirrors the pattern from September 5th–9th, 2025, and I wouldn’t be surprised to see history repeat itself here.
I’m planning to go long from the 25,105 imbalance, holding through all-time highs and into the void through 25,300. Once ATHs are broken, I’ll trail my stop closely to lock in profits.

USNAS100 – Bullish Above 24,900, Fed Easing Hopes Drive MomentumUSNAS100 – Overview
Global markets climbed higher as speculation of further Fed easing supported risk sentiment, with European stocks hitting records.
Despite the ongoing U.S. government shutdown, optimism over AI, trade themes, and expectations of up to 50bps in Fed cuts by year-end continue to drive indices higher.
Technical Outlook
Price has already reached and stabilized above the 24,900 pivot, confirming bullish continuation.
As long as price holds above this zone, upside targets are 25,040 → 25,180.
A further push above 25,040 would strengthen the bullish trend toward 25,180.
On the downside, a confirmed 1H close below 24,810 would shift momentum bearish, exposing 24,580 as the next key support.
Pivot: 24,900
Resistance: 25,045 – 25,180
Support: 24,810 – 24,580
previous idea:

JD 1D: Bulls taking the lead?On the daily chart, JD.com broke out of a falling wedge, moving above both MA50 and MA200. That’s a strong technical signal hinting at a potential mid-term trend reversal.
Upside targets are mapped at $39.8 and $46, with Fibonacci levels suggesting a possible extension toward $52 if momentum holds. Support remains around $33–35, and as long as the price stays above it, buyers are in control.
From a fundamental perspective, JD continues to reshape its business, expand online services, and benefit from China’s economic recovery. Competition with Pinduoduo and Alibaba is tough, but technically bulls seem to have the upper hand.
Tactical outlook: watch the MA200 - staying above it keeps the growth scenario intact.

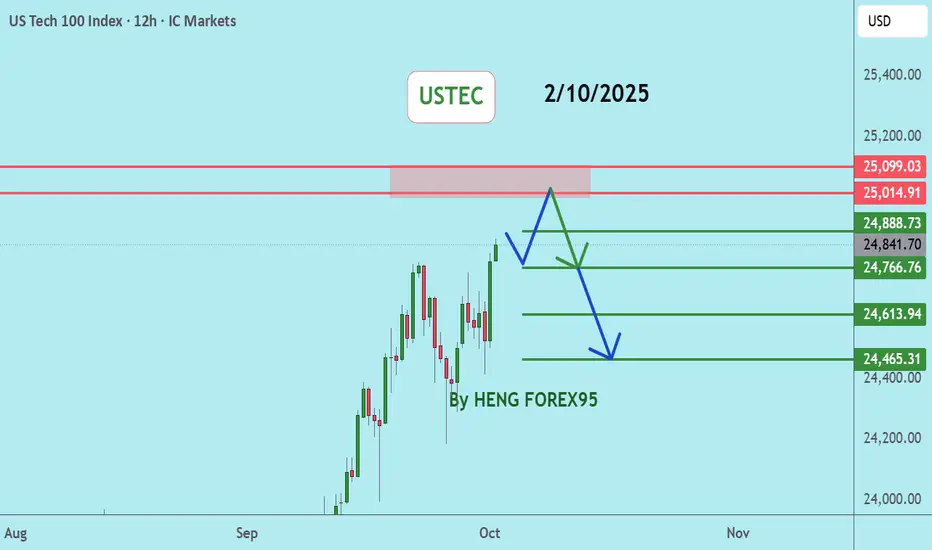
USTEC, NASDAQNasdaq price is still in a strong uptrend, there is a chance to test the 25014-25124 level. If the price cannot break through the 25124 level, it is expected that the price will have a chance to go down. Consider selling in the red zone.
🔥Trading futures, forex, CFDs and stocks carries a risk of loss.
Please consider carefully whether such trading is suitable for you.
>>GooD Luck 😊
❤️ Like and subscribe to never miss a new idea!
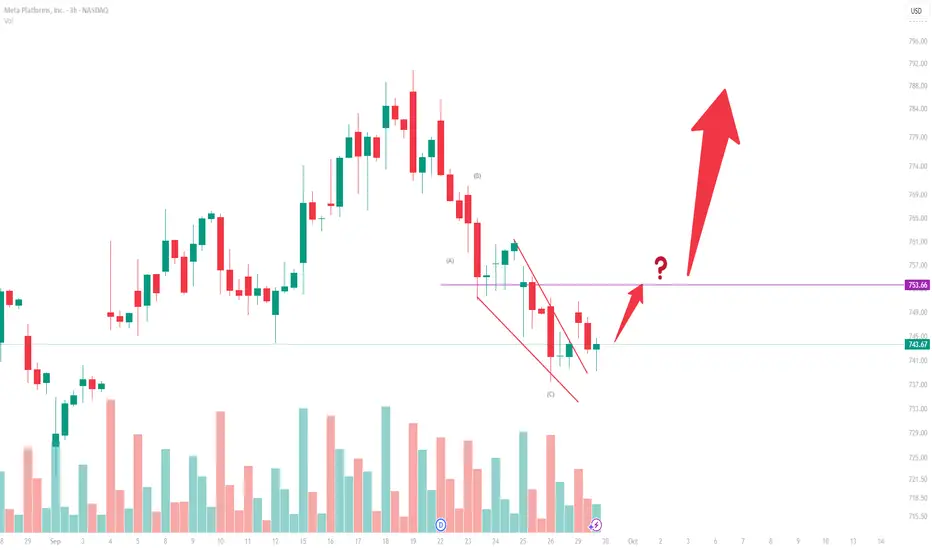
META (3H) — Elliott Wave AnalysisStructure
The chart displays a zigzag corrective pattern labeled (A) → (B) → (C).
Wave (C) unfolds inside a falling wedge (ending diagonal), a common terminal structure at the end of corrections.
The breakout attempt from this wedge suggests that Wave (C) may be complete.
Wave (A)
A sharp, impulsive decline in five subwaves.
Defines the start of the correction.
Wave (B)
A three-wave upward retracement.
Retraces roughly 0.38–0.50 of Wave (A), consistent with zigzag proportions.
Wave (C)
A five-wave structure contained within a converging wedge.
Subwave (v) shows diminishing momentum, typical of an ending diagonal.
The upward break through the wedge top signals the potential termination of Wave (C).
Key Level
753.66 is the critical resistance.
A confirmed move above 753.66 validates that the (A)–(B)–(C) correction has ended and a new impulsive sequence may be starting.
Failure to reclaim 753.66 leaves the risk that the bounce is only a temporary rally within a larger correction.
Alternate Scenario
A new low beneath the Wave (C) termination point would invalidate the completion view, implying the correction is extending.
Short Trade Idea for 9/30 | NQI’m anticipating price to either push into the 1H bearish imbalance at 24,894 or reject from the NWOG around the 24,856 range before turning lower toward the 24,640.00 range. My bias is firmly short for now — but I’ll reassess as we approach the open.

NASDAQ – Decision Point is Now: Breakout or Breakdown?📈🔍 NASDAQ at Key Inflection – Momentum or Meltdown? ⚠️💥
Hey Traders,
The NASDAQ 100 is now standing right at the make-or-break zone: 22,655. This level marks a critical retest of the recent breakout, and what happens here could define the next major move.
🔵 The Setup:
After a strong bounce and sharp rally from below 18K, we've climbed back into the tight ascending structure. But momentum is slowing…
This zone could produce either a bullish continuation to new highs — or a brutal rejection that unwinds the entire move.
📍 Structure Speaks:
Holding above 22,655 = likely continuation
Breakdown = deeper pullback toward 20,000 and lower channel support
Momentum names like NVIDIA are doing the heavy lifting again — but can they sustain the market alone?
📊 What I'm Watching:
Bullish path = measured target ~25,000+
Bearish path = test of the broader trendline near 20,000 or even the 18,200 region
Macro signals still mixed — stay nimble, not married to one bias
⚠️ Stay Sharp:
Just like in crypto, the Nasdaq can punish both bulls and bears when it enters chop mode. Structure and discipline remain your best defense.
I’ve updated the chart — fresh out the oven 🍞 — and more market ideas are following, including BTC, ETH, and BTC Dominance.
One Love,
The FXPROFESSOR 💙
Disclosure: I am happy to be part of the Trade Nation's Influencer program and receive a monthly fee for using their TradingView charts in my analysis. Awesome broker, where the trader really comes first! 🌟🤝📈

Futu Holdings a New ath or time for a correctionIn this video I go over the previous price action and develop a plan of where to look for a future entry if you are accumulating Futu .
I demonstrate using a standard fib pull how price may gravitate back to .786/.886 fib levels over time as well as what to look for in the event we push up for a new Ath .
20 Nov we have earnings and despite the past track record of earnings have surprised the market with positive results I question if the upcoming does the same or will it be the catalyst for the correction .

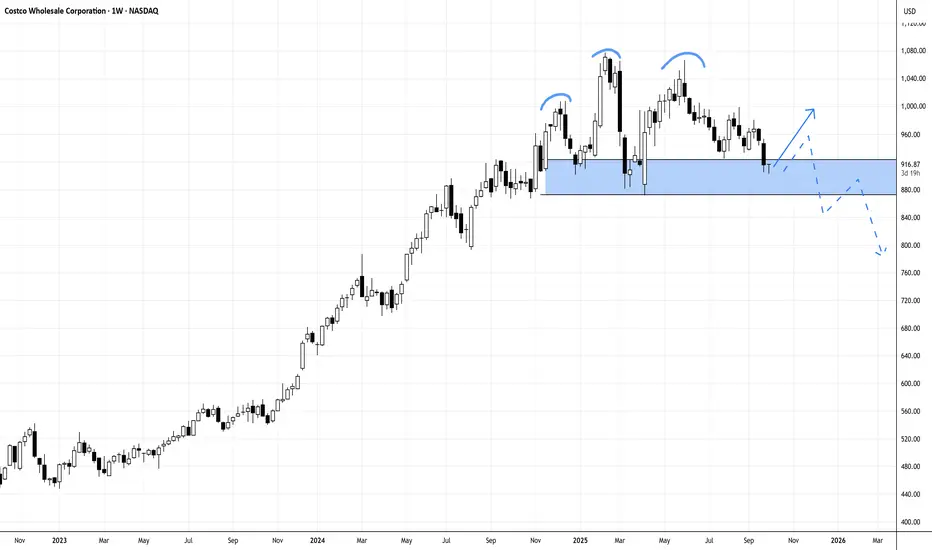
COSTCO NEEDS TO AVOID BREAKING H-n-S TO CONTINUE ITS UPSIDE RALLCostco (COST) has posted another strong fiscal year, with revenue climbing to $86.2B and net income up to $5.49B. However, the weekly chart is showing a developing head-and-shoulders pattern threatens the upside momentum, and price must hold above 871 with a rejection candle this week to avoid a deeper breakdown. A close below that level could confirm bearish continuation, despite Costco’s solid fundamentals.
N.B!
- COST price might not follow the drawn lines . Actual price movements may likely differ from the forecast.
- Let emotions and sentiments work for you
- ALWAYS Use Proper Risk Management In Your Trades
#cost
#nasdaq
#nyse
NQ Shorts re entryAfter the recent win I saw a new clear break above my set levels. And a perfect textbook reversal formed. Entere more shorts.
Setting alerts and waiting patiently is how consistency starts, once you form those small habits over time it becomes simple repition and then profitability flows from there.
I didnt find this consistency until I aligned my trading with Christ.

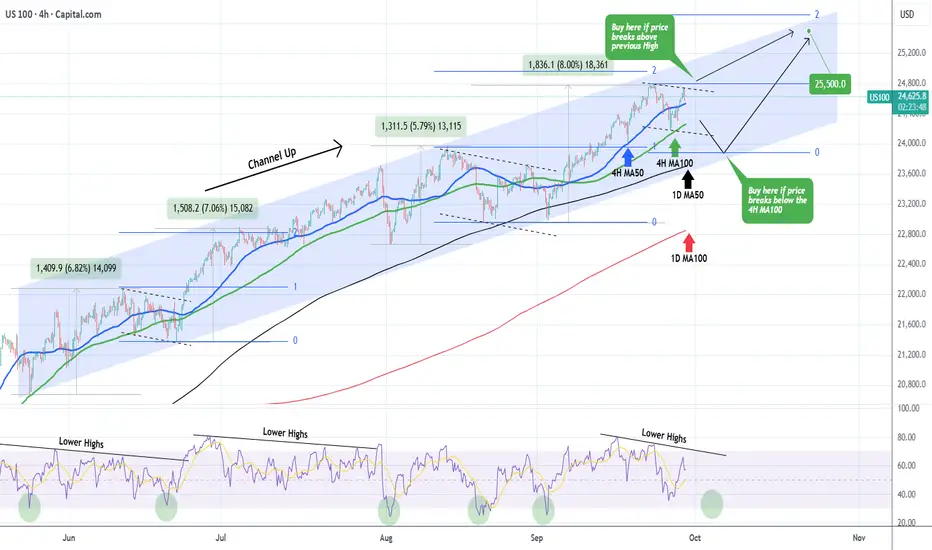
NASDAQ in no action zone. Buy break-out or pull-back.Nasdaq (NDX) has been trading within a 4-month Channel Up and its most recent low has been on its 4H MA100 (green trend-line) 2 days ago.
As long as it holds, it maintains the short-term bullish trend but a confirmed buy signal would be after the price breaks above its previous 24800 High.
Until it does, it might be within a technical Bearish Leg similar to late August's and mid June's that both broke below the 4H MA100 before bottoming on the Higher Lows trend-line of the Channel Up and rebounded. The 4H RSI Lower Highs structure shows that we might be on such a pull-back sequence, which turns into a buy below 33.00 (RSI).
As a result, we will either wait for a 24800 break-out or a 1D MA50 (black trend-line) pull-back before initiating a buy again. In both cases, our Target is 25500 (just below the 2.0 Fibonacci extension).
-------------------------------------------------------------------------------
** Please LIKE 👍, FOLLOW ✅, SHARE 🙌 and COMMENT ✍ if you enjoy this idea! Also share your ideas and charts in the comments section below! This is best way to keep it relevant, support us, keep the content here free and allow the idea to reach as many people as possible. **
-------------------------------------------------------------------------------
💸💸💸💸💸💸
👇 👇 👇 👇 👇 👇
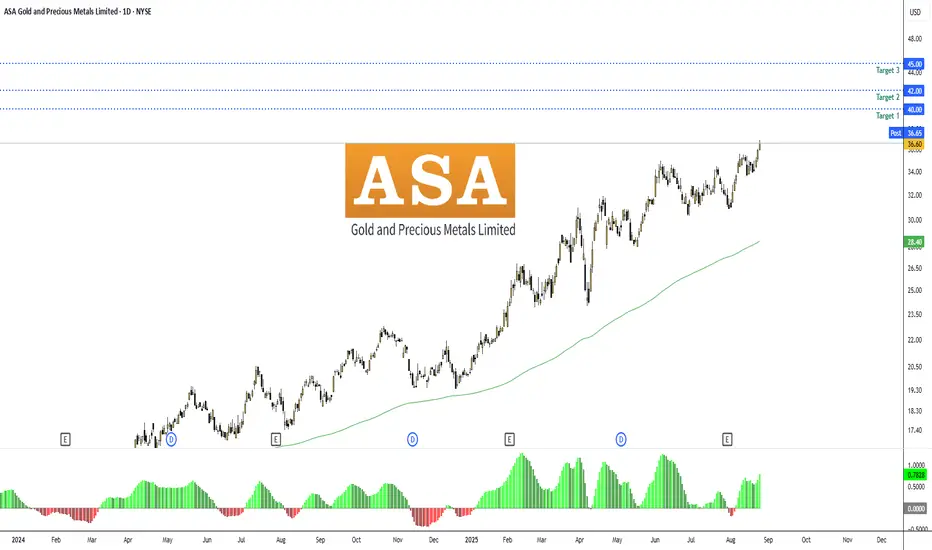
Insider: ASA Gold and Precious Metals LimitedNYSE:ASA #ASA — ASA Gold and Precious Metals Ltd | Financial | Closed-End Fund - Equity | USA | NYSE | August 25, 2025.
Insider Purchase and Company Overview
Recent insider filings for ASA Gold and Precious Metals Limited (NYSE: ASA), a closed-end investment fund focused on companies engaged in the exploration, mining, or processing of gold and other precious metals, reveal aggressive accumulation by major shareholder Saba Capital Management, L.P. As a 10% owner, Saba executed two notable purchases in late August 2025: on August 21, 2025, acquiring 6,710 shares at $35.05 per share for a total value of $231,380, and on August 22, 2025, adding 4,632 shares at $35.97 per share for $166,181.
These transactions, disclosed via SEC Form 4 on August 25, 2025, boosted Saba's total holdings to 4,077,634 shares, representing a significant stake in the fund. This activity is part of a broader pattern of buying by Saba throughout August 2025, including larger acquisitions such as 9,943 shares on August 19 at $33.99, 18,310 shares on August 15 at $34.24, 8,310 shares on August 14 at $33.89, 1,836 shares on August 13 at $35.11, 354,169 shares on August 12 at $35.39, and a substantial buy on August 11 valued at approximately $11.4 million at $35.00 per share.
Saba Capital, led by activist investor Boaz Weinstein, has been increasing its position amid an ongoing proxy battle and governance disputes with ASA's board, signaling strong conviction in the fund's undervaluation relative to its net asset value (NAV) and the bullish outlook for precious metals. No other significant insider purchases from executives or directors were reported in August 2025, but institutional interest is evident, with Sprott Inc. maintaining a $8.45 million stake as of recent filings.
➖ www.nasdaq.com
➖ www.marketbeat.com
News Analysis
August 2025 news for ASA has been dominated by governance changes and activist developments. On August 22, 2025, the company announced the resignation of directors William Donovan and Mary Joan Hoene, alongside the appointment of Karen Caldwell to the board—a move that may reflect ongoing pressure from Saba Capital to refresh leadership and address the fund's persistent discount to NAV (historically trading at 10-20% below its underlying assets).
Earlier in the month, ASA filed an 8-K on August 7, 2025, likely related to operational updates, and released its August Gold Chart Book on August 1, highlighting positive trends in gold mining equities amid rising metal prices. Saba's activism, which includes a dropped lawsuit in July 2025 over expired anti-takeover measures (poison pills) and ongoing proxy proposals to expand the board, underscores their push for value unlocking, such as potential conversions or mergers.
No other major insiders or traders reported buys in August, but Saba's consistent accumulation (totaling over $20 million in value across the month) positions them as the dominant force, with holdings now exceeding 4 million shares. This activist involvement could catalyze premium narrowing or strategic actions, boosting shareholder value.
Charts:
• (1D)
• (3D)
SEC From 4:
www.sec.gov
Forecast:
Replicating Saba's recent buys at an average entry of ~$35.50 (blending the August 21-22 transactions), the setup offers solid upside potential in a precious metals bull market, supported by technical strength and activist catalysts. I estimate a 15-30% growth potential over the next 3-6 months, assuming gold prices remain elevated above $3,364/oz and Saba's activism yields positive outcomes like board expansions or discount-narrowing measures.
Entry Price: $35.50. (current/insider level).
Recommended Exit Targets:
➖ Conservative Target 1: $40.00 (13% profit, +$4.50/share)
➖ Moderate Target 2: $42.00 (18% profit, +$6.50/share)
➖ Aggressive Target 3: $45.00 (27% profit, +$9.50/share)
Stop-Loss: $32.00 (10% downside risk, -$3.50/share) – Below 20-day SMA to guard against pullbacks.
Overall Potential: 15-30% growth, with a risk-reward ratio of ~1:2 at the moderate target.
Risks include gold price volatility, failed activism (e.g., prolonged proxy fights), or broader market corrections in commodities. Position sizing should be 1-3% of portfolio given the fund's sensitivity to metal prices.
NASDAQ-NAS100 4H Analysis: Buy OpportunityHello Guys,
I’ve prepared a 4-hour NAS100 analysis for you.
I’ll be entering a buy position from 24,500.00 with a target set at 24,748.00.
Set your stop level according to your own margin.
Once the markets open, I’ll definitely take my shot on the buy side of NAS100.
Let’s see how this analysis plays out together.
Every like is my biggest motivation to keep sharing these analyses.
Thanks to everyone supporting me!

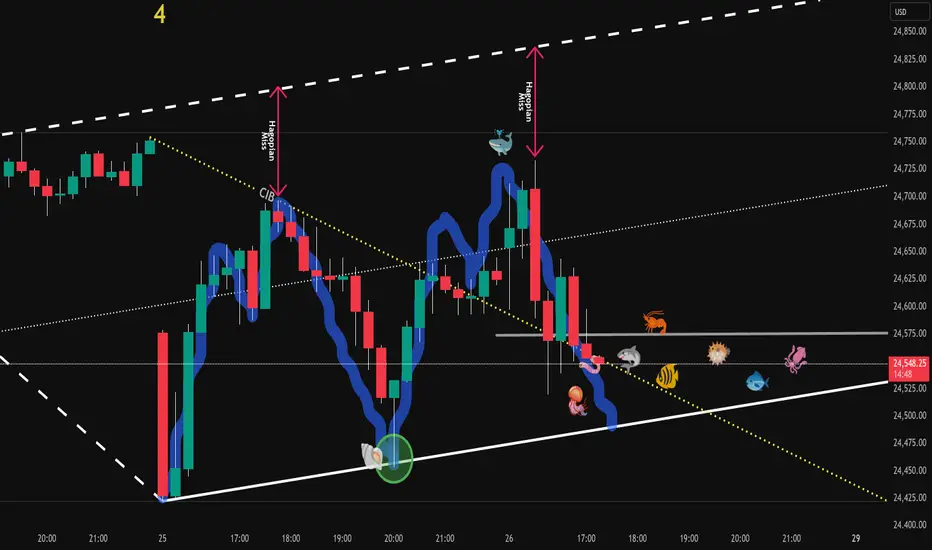
NQ is twitching the worm - Don't take the bait🎣 Don’t take the bait! 🎣
Just sitting here, watching my pre-market setup.
Now I can see them twitching the worm, trying to lure me in.
NOPE!
This price action’s way too twitchy for me. §8-)
This Chart is a RTH with "Gap-Attached" and gives a perfect catch of the first drop.
So, just casually watching...maybe I can learn even more...
🐟🐠🐡🐟🐠🐡🐟🐠🐡🐟🐠🐡🐟🐠🐡🐟🐠🐡🐟🐠🐡
NASDAQ H1 OUTLOOKLets Nasdaq Sell
Reasons
Bearish Order Block
Who Is With Me Comment Your Opinion
Good Luck Guys
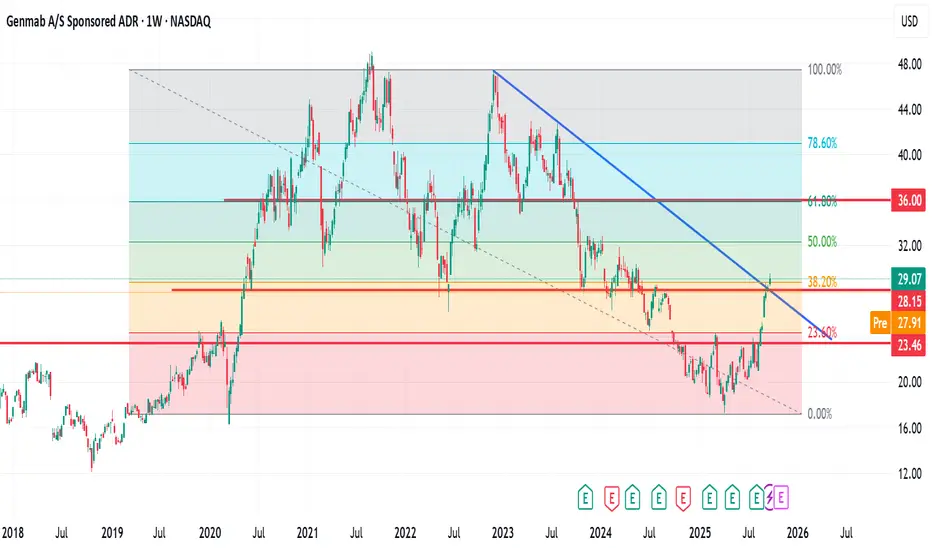
GMAB at a Critical Confluence Zone – Potential UP or down?GMAB at a Critical Confluence Zone – Potential Breakout or Reversal?
GMAB has shown strong recovery momentum since its April 7th, 2025, low. The price is currently testing a significant confluence area formed by a descending trendline and the Fib 38.2% support level.
If price action holds above this zone, there is potential for a continuation move toward the Fib 61.8% level, which would represent an estimated upside of around 28%.
My Trade Plan:
Initial entry at the current market cap.
Second entry after a confirmed breakout above this confluence zone.
As always, apply proper risk management—trade cautiously and according to your strategy.
🔹 Like, comment, and follow for more trade ideas.
🔹 Let’s connect here on TradingView.
NASDAQ | Diagonal resistance | GTradingmethodGood morning Traders,
I hope everyone has had a winning week so far :)
The US100 is sitting at a pivotal point. Price is currently at all-time highs but also testing two key diagonal resistance levels — one medium-term and one short-term. These resistance lines are intersecting right now, which adds extra weight to this resistance zone.
The big question:
👉 Will the US100 break through resistance and push higher into uncharted territory, or are we about to see a short-term correction from here?
📊 Trade Plan:
Not entering a trade just yet — waiting for confirmation of either a breakout with retest or rejection and reversal.
Very keen to hear what everyone thinks, let me know please :)
Peace
G

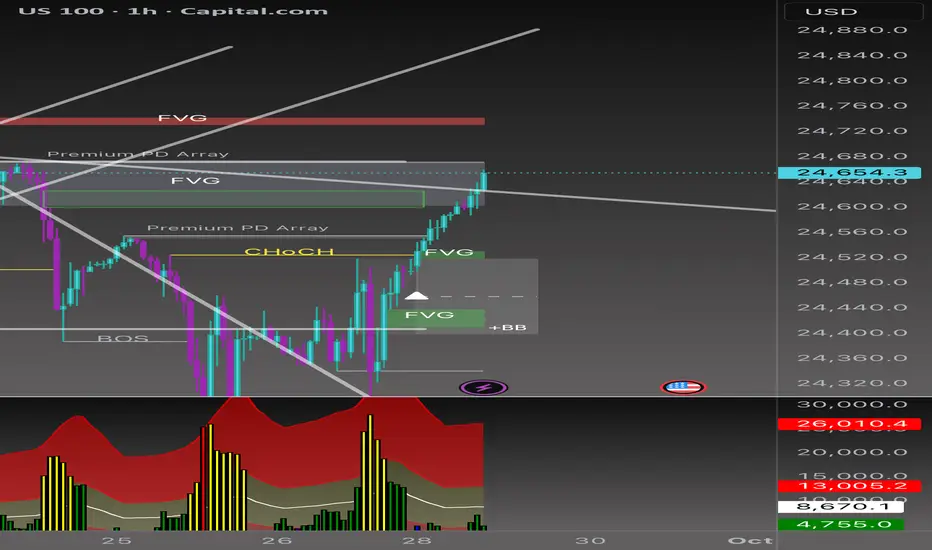
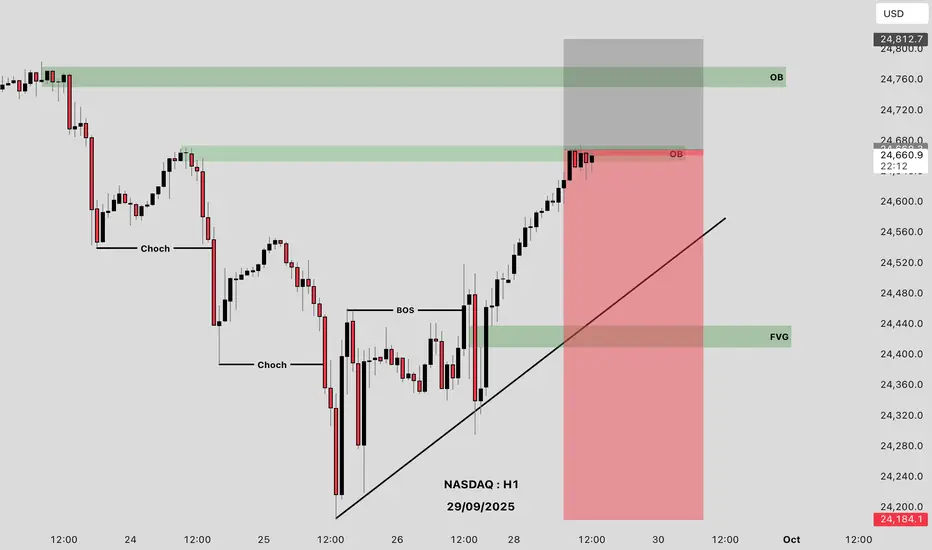
Beyond the Chart - NAS100 Through Technicals & FundamentalsThe trendline I drew last week played out perfectly. Price has carved out a fresh trend on the lower timeframe and is breaking to the upside. But the real confirmation comes only if the FVG is fully filled and we get a strong bullish close above 24,700.
NASDAQ Daily Analysis 📊
👉Hold above 24,500 – 24,520 → BUY targeting 24,700 (upper FVG). Break & hourly close above 24,700 → room to push toward 24,850 – 24,900.
👉24,700 – 24,750 → strong SELL zone (Premium PD Array + FVG overlap). First downside target: 24,400 – 24,350.
⚡️Bottom line:
• Bullish case→ If inflation comes in lower and the Fed takes a softer tone → buyers could step in and push levels higher.
• Bearish case → If data runs hot and the Fed signals more tightening → selling pressure kicks in, and your short levels become key.