Stock market pullback aheadIt’s an incredible time for retail investors: the market is pumping non-stop, and it seems like it could continue indefinitely.
However, the charts are signaling a different scenario as we approach October.
MACD is at the top of its range
RSI is at the top of its range
Stochastic is at the top of its range
While liquidity remains high and rate cuts appear increasingly likely, history shows that when these indicators reach such extremes on the 1-week timeframe, a market correction often occurs. This reset can pave the way for further growth.
In short, we may see a correction, sideways movement, or a pause, most likely starting in October.
Anything is possible, but the charts don’t lie—even if sentiment can be misleading.
Monitor the situation closely: a market correction can also be a great opportunity to buy at lower prices.
DYOR.
Nasdaq

NAS100 Technical Forecast: Key Levels & Traps🚀 NAS100 Technical Forecast: Key Levels & Traps 🐻
*Analysis as of Sept 20, 2025 (12:50 AM UTC+4)*
📊 Overall Market Context:
Price: 24,610. Geopolitical events remain a key volatility driver. Current price action suggests a cautious market seeking direction after recent moves.
🔍 Key Technical Indicators:
• RSI (14): Neutral zone (~50). No strong overbought/oversold signal.
• Bollinger Bands (20): Price near the middle band, indicating balanced volatility.
• Moving Averages: Watching for a potential bearish crossover on the 4H chart. Key resistance at the 50-EMA.
• VWAP: Current price trading around the session's VWAP; a break above signals intraday bullish bias.
🎯 Critical Support & Resistance:
• Immediate Resistance: 24,800 -> 25,000 (Psychological)
• Strong Resistance: 25,250 (Previous High)
• Immediate Support: 24,500 -> 24,300
• Strong Support: 24,000 (Key Level)
⚠️ Pattern Watch:
• Bull Trap Risk: A false breakout above 24,800 could lure buyers before a drop.
• Bear Trap Risk: A sharp rejection from 24,300 could trap sellers before a rally.
• No clear Harmonic or Elliott Wave pattern on lower timeframes; monitoring for setup.
📈 Intraday Trading (5M-1H Charts):
• BUY (Long): Above 24,650, targeting 24,800. Stop Loss: 24,550.
• SELL (Short): Below 24,500, targeting 24,300. Stop Loss: 24,650.
*Confirmation: Use 5-min RSI divergence and volume spikes.*
📉 Swing Trading (4H-Daily Charts):
• BUY Swing: On a bullish reversal candle at 24,300 support, target 25,000+. SL below 24,000.
• SELL Swing: On a rejection at 24,800 resistance, target 24,000. SL above 25,100.
*Wait for a 4H close above/below key levels for confirmation.*
🎲 Risk Management:
Always use a 1:2 Risk/Reward ratio. Protect your capital.
For individuals seeking to enhance their trading abilities based on the analyses provided, I recommend exploring the mentoring program offered by Shunya Trade. (Website: shunya dot trade)
I would appreciate your feedback on this analysis, as it will serve as a valuable resource for future endeavors.
Sincerely,
Shunya.Trade
Website: shunya dot trade
📝 TRADING CHECKLIST
Before entering any position:
- ✅ Confirm volume supports move
- ✅ Check RSI for divergences
- ✅ Verify multiple timeframe alignment
- ✅ Set stop loss before entry
- ✅ Calculate position size
- ✅ Review correlation with DXY/SPX
- ✅ Check economic calendar
- ✅ Assess market sentiment
⚠️Disclaimer: This post is intended solely for educational purposes and does not constitute investment advice, financial advice, or trading recommendations. The views expressed herein are derived from technical analysis and are shared for informational purposes only. The stock market inherently carries risks, including the potential for capital loss. Therefore, readers are strongly advised to exercise prudent judgment before making any investment decisions. We assume no liability for any actions taken based on this content. For personalized guidance, it is recommended to consult a certified financial advisor.

NASDAQ 100 (NQ1!): Bullish! Buy The Dip!Welcome back to the Weekly Forex Forecast for the week of Sept 15 - 19th.
In this video, we will analyze the following FX market: NASDAQ (NQ1!) NAS100
The NASDAQ is bullish. No reason in the world to start looking for shorts! Let the market pullback to Internal Range Liquidity (IRL), a +FVG or +OB, and look for valid long setups on the lower timeframes.
Enjoy!
May profits be upon you.
Leave any questions or comments in the comment section.
I appreciate any feedback from my viewers!
Like and/or subscribe if you want more accurate analysis.
Thank you so much!
Disclaimer:
I do not provide personal investment advice and I am not a qualified licensed investment advisor.
All information found here, including any ideas, opinions, views, predictions, forecasts, commentaries, suggestions, expressed or implied herein, are for informational, entertainment or educational purposes only and should not be construed as personal investment advice. While the information provided is believed to be accurate, it may include errors or inaccuracies.
I will not and cannot be held liable for any actions you take as a result of anything you read here.
Conduct your own due diligence, or consult a licensed financial advisor or broker before making any and all investment decisions. Any investments, trades, speculations, or decisions made on the basis of any information found on this channel, expressed or implied herein, are committed at your own risk, financial or otherwise.

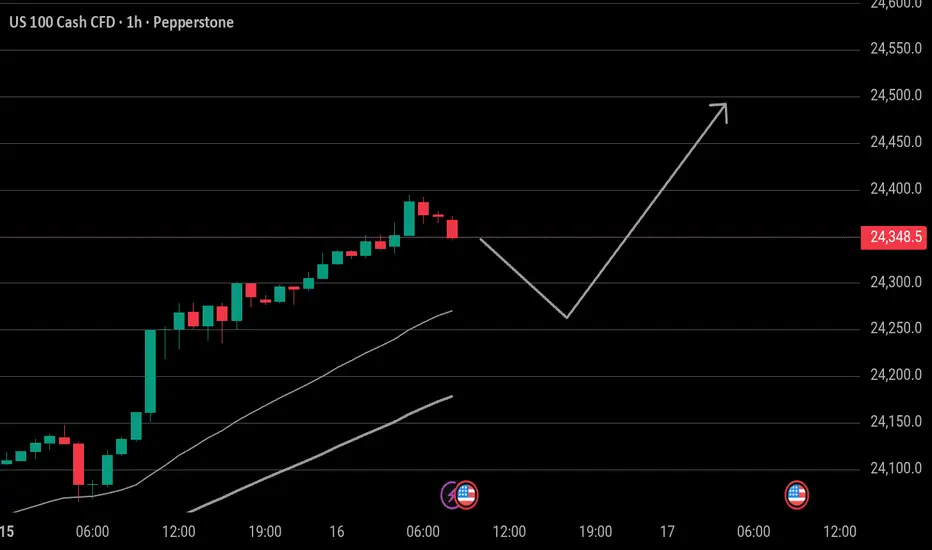
NasdaqNasdaq After breaking through 24500, it broke through 24550 with a pullback confirming consolidated support. Buying pressure continues; we can wait for the resistance at 24600 to break and reach 24750.

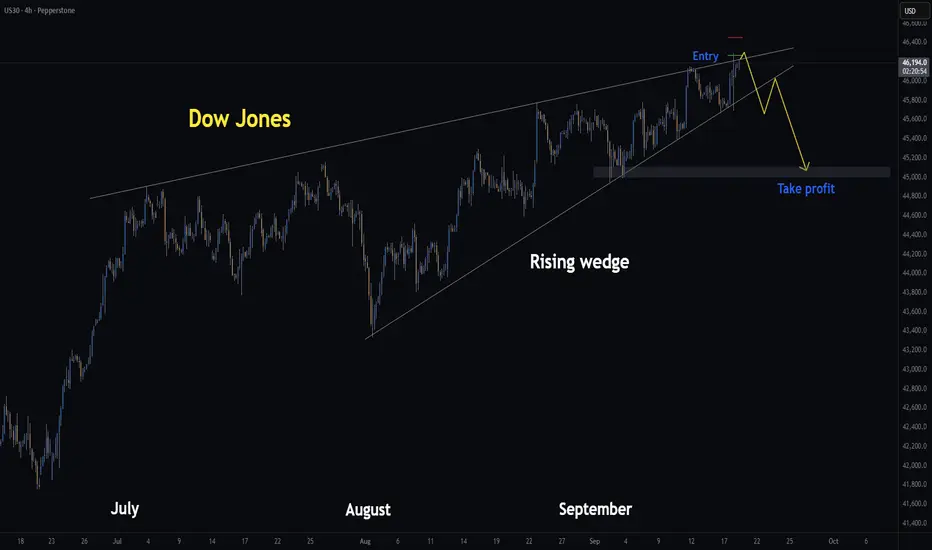
DowJones | H4 Rising Wedge | GTradingMethodHello Traders,
Yesterday I shared a short setup on the Dow Jones using the rising wedge pattern. I entered at 46,267 and exited with a small profit at 46,179. I exited because I did not like the reaction at that level and anticipating a better entry.
Today, I’m looking to re-enter if price reaches 46,343, which could form a potential double top on the chart.
🧐 Market Overview:
Rising wedges generally act as bearish reversal patterns, that said, the broader market remains bullish following the FOMC, so I’ll be risking less and proceeding with caution.
However, the VIX has been sitting near multi-month lows, which often precedes sharp moves. If volatility picks up post-FOMC, rising wedge patterns could act as early warning signs of a pullback.
So I am willing to risk a small amount and potentially be rewarded BIG!
📊 Trade Plan:
Risk/Reward: 6.7
Entry: 46,343
Stop Loss: 46,539
Take Profit 1 (50%): 45,000
Take Profit 2 (50%): 45,000
Also, if this plays out, I expect NAS and S&P to fall too which will likely drag crypto with it.
Thanks for checking out my post!
I would love to hear if you have any rising wedge trading tips? And if you are trading the Dow Jones or S&P today?
Please note: This is not financial advice. This content is to track my trading journey and for educational purposes only.
$SOLANA 250+ or bearish trend to 225/200With the recent solana pump, major profits have been taking place.
However, SOL stopped out at 249. Just under the Psychological level of 250.
On this chart we can see the following:
- Supply & Demand
- Anchored Volume
- Pattern: BF / BC /SR
- Two 4 hour FVG's below price, with HTF GP on the second FVG.
- One swing high & swing low
- OBV tool in place forming a bearish channel
- Psychological levels of 250, 225, 200
With these in place, we can see solana is looking pretty bearish now.
What comes up, must come down.
Solana is making a retest on the demand zone, which is also the resistance and golden pocket.
If price wicks and successfully rejects. We will definitely see 225.
A long with the Volume Anchor acting as a magnet for price to come back down as there has not yet been a retest.
But if it closes above the resistance, there is a greater chance of it breaking above the demand zone.
We will begin looking for shorting opportunities once solana fails to break above.
We will begin looking for long opportunities if solana succeeds in it's break above.
Right now, keep your eyes peeled.
We have movement incoming.

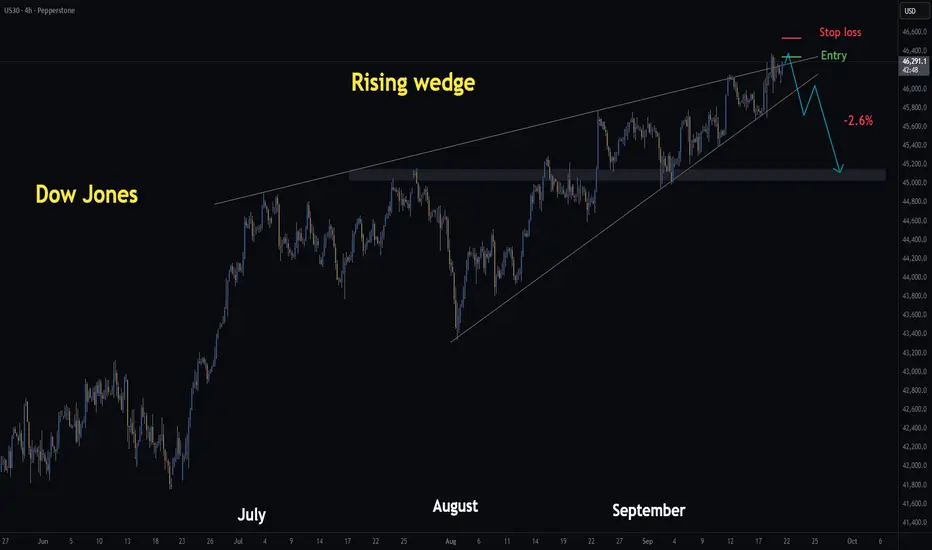
Dow Jones | H4 Rising Wedge | GTRadingMethod👋 Hello Traders.
Yesterday I mentioned I’d be watching for a breakout and retest setup — that plan still stands. However, I’ve also taken a short position off the diagonal resistance line.
🧐 Market Overview:
I’m currently seeing rising wedge structures across Nasdaq, S&P, Russell 2000, and Dow Jones. These patterns typically lean bearish, and I can’t ignore the confluence. That said, wedges can fail, and with the market leaning bullish after of the FOMC announcement, I’m aware this is swimming against the trend.
📊 Trade Plan:
Risk/Reward: 6.7
Entry: 46 267
Stop Loss: 46 450
Take Profit 1 (50%): 45 000
Take Profit 2 (50%): 45 000
(I’m already short from 46 267 and will look to add if price retests that level.)
💡 GTradingMethod Tip:
Bearish patterns like rising wedges can offer high R/R setups, but always remember — strong bullish backdrops (like major data events) can cause them to fail. Risk management is everything.
🙏 Thanks for checking out my post!
Make sure to follow me to catch the next idea and share your thoughts on what you think the markets will do today and how you would trade rising wedges :)
📌 Please note:
This is not financial advice. This content is to track my trading journey and for educational purposes only.
Tesla on Track – Golden Zone Respect Leading to $867 TargetAs we discussed in the earlier setup, Tesla retraced beautifully into the golden zone (62–79% retracement area) after sweeping sell-side liquidity. This zone aligned with a higher-timeframe order block, providing strong confluence for a bullish reaction.
The price has since respected that golden zone, confirming buyers stepped in aggressively and validating the bullish bias. From here, the market structure points toward continuation to the upside, with immediate targets at prior buy-side liquidity pools, eventually extending toward the $867 region, a level that aligns with the 100% Fibonacci projection and liquidity resting above previous highs.
This setup illustrates a textbook ICT/SMC play:
Liquidity Sweep ✅
Golden Zone Respect ✅
Strong Bullish Reaction ✅
Clear Buy-side Targets Ahead ✅
If momentum holds, Tesla remains positioned for a multi-month expansion leg toward the $867 target zone.
⚠️ DYOR: Not financial advice. Always confirm setups with your own framework and risk management.

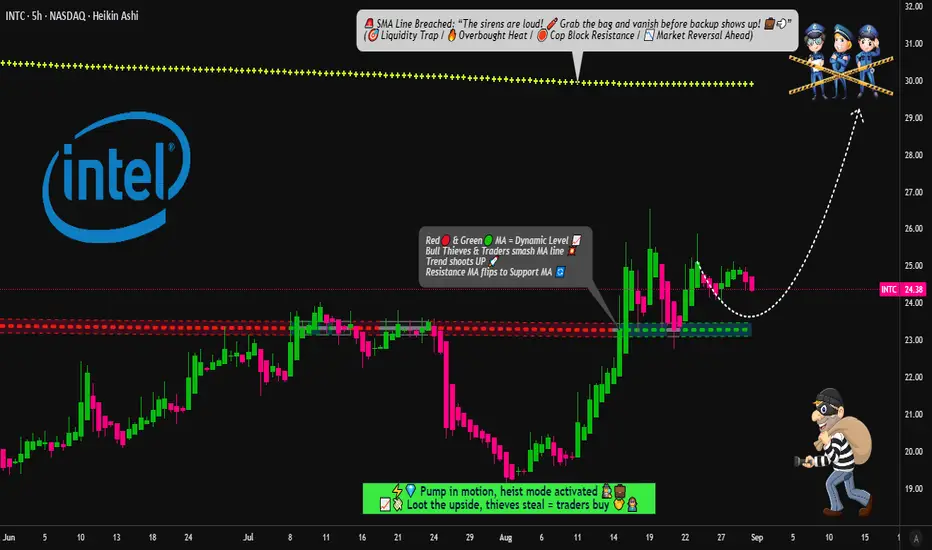
INTEL Heist Playbook: Buy the Dips, Escape Before the Sirens🔓💻 INTEL CORPORATION "Chip Heist" Stock Raid 💻🔓
🎯 Plan: Bullish Robbery | Targeting $30.00 | Stop Loss: $21.00
💰 Layered Limit Entries | Silicon Valley Loot | Calculated Takedown
🚨⚠️ Attention TRADERS, Tech Pirates & Market Mercenaries! ⚠️🚨
The INTC data vault is cracked, and the Thief Trader squad is executing a multi-layer LIMIT ENTRY HEIST – stacking shares like we're loading the getaway van. 🚐💾⚡
👀 We ain't chasing price – we're ambushing it with precision. Every discount? A planned acquisition.
💥 ENTRY: Any Price Level is a Gift 💥
"Bullish on Silicon" – we're collecting shares on any dip into value town!
Deploy buy limits at key psychological support layers: $25.00, $24.00, $23.00 (Add more layers based on your own capital).
Thief-style: We don't buy the hype; we steal the undervalued chips.
🛑 STOP LOSS: This is a Thief SL @ $21.00 🔐
Dear Ladies & Gentleman (Thief OG's), this is set at the breakdown panic zone – where the weak hands get shaken out.
Adjust your final SL based on your own risk appetite and strategy. Size wisely.
🎯 TARGET: $30.00 💸
The police barricade is there, so kindly escape with your stolen money before arrival.
We're targeting the next major resistance vault. Take profits and live to trade another day.
🧠 Swing Traders? Load the boat. Day Traders? Snatch the quick flips. Investors? Stack and hold. 💵☕
Use a trailing stop loss to protect your capital as the trend accelerates.
🕵️♂️ THIEF TRADER INSIGHTS:
📊 Backed by tech sector momentum, oversold bounces, and order block analysis.
🗞️ Earnings? Chip news? = increased volatility = adjust your layers accordingly.
⚠️ HEIST PROTOCOL:
✅ Avoid over-leveraging – this is a layering strategy, not a casino bet. 📉
✅ Use risk-adjusted position sizing on every limit order.
✅ Discipline is key. The market will deliver the discounts; you just need to be patient.
❤️🔥 Hit that 💥 LIKE & FOLLOW 💥 if you're riding with the Thief Squad!
Support the strategy. Respect the plan. Stack your gains like a true Market Outlaw.
🔔 Follow for the next HEIST. Big bags only. 💼🚀📈
“The market is a river of money—flowing from the impatient to the patient.” – Thief Trader
#INTC #Intel #StocksToWatch #TradingPlan #SwingTrading #StockMarket #Investing #LayeredEntries #ThiefTrader #ChipHeist
NASDAQ100 HIGH PROBABILITY SETUP SOON!!!🚨 NAS100 HIGH PROBABILITY SELL SETUP 🚨
* Here We Can See Clearly The Next Potential Move For US100 Coming Hours/Days.
* Keep Your Eyes Close On Your Trading Positions.
* Happy PIP Hunting Traders.
FXKILLA.

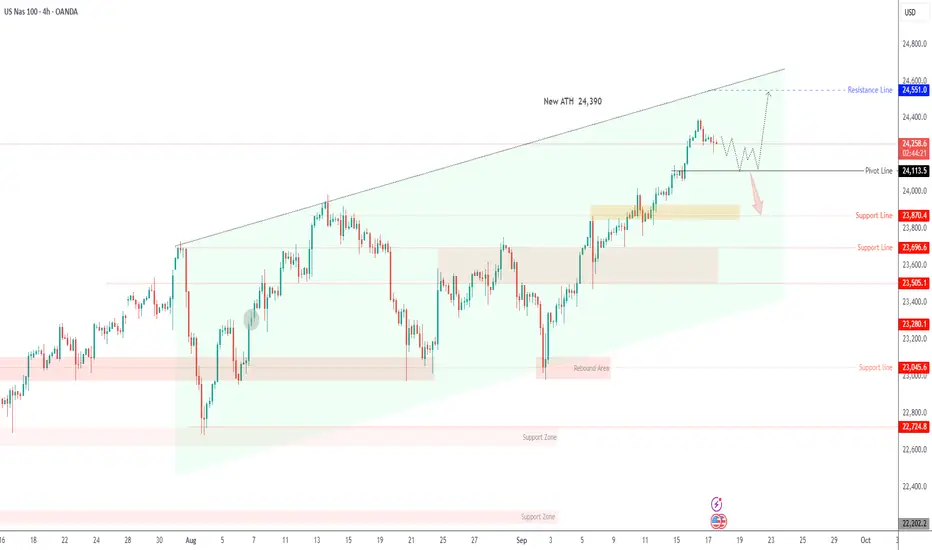
Nasdaq 100 Eyes 24,550–25,050 if Fed Signals Dovish ToneUSNAS100 – Technical Overview
The Nasdaq remains in focus as traders await the Federal Reserve’s rate decision later this week.
Markets largely expect a 25 bps cut, but the key driver will be Chair Powell’s tone on inflation, labor-market weakness, and tariff risks.
Earlier record highs across U.S. indexes were fueled by tech strength and optimism over U.S.–China trade talks, while gold’s surge to new highs underscores strong safe-haven demand.
Technical Outlook
📉 Correction phase
Price is expected to retest 24,240 → 24,115 before attempting another bullish leg.
A sustained drop below 24,110 would expose deeper support at 23,870.
📈 Bullish continuation
Holding above 24,240 – 24,115 keeps the broader uptrend intact.
Once consolidation is complete, a renewed rally targets 24,550 → 24,800, with a potential extension to 25,050 if the Fed delivers a more dovish message.
Key Levels
Pivot: 24,380
Resistance: 24,550 – 24,800 – 25,050
Support: 24,240 – 24,115 – 23,870
📌 Market Context:
A 25 bps Fed cut may offer moderate support for tech-heavy indices, while a more aggressive 50 bps cut could accelerate the next breakout toward fresh ATHs. Conversely, a hawkish tone from Powell could trigger a deeper correction before the next leg higher.

ARM Holdings — reversal pattern signals growth potentialOn the ARM chart an inverted head and shoulders pattern is taking shape with price approaching the neckline around 144–145 and a confirmed breakout above this level could trigger an upward move toward 220 with extended targets at 310–330. In case of a pullback the 128 zone remains key support to preserve the bullish structure. Fundamentally ARM continues to strengthen its role in chip architecture while growing demand in artificial intelligence and mobile technologies drives institutional interest. As long as the pattern holds the bullish scenario stays in play.

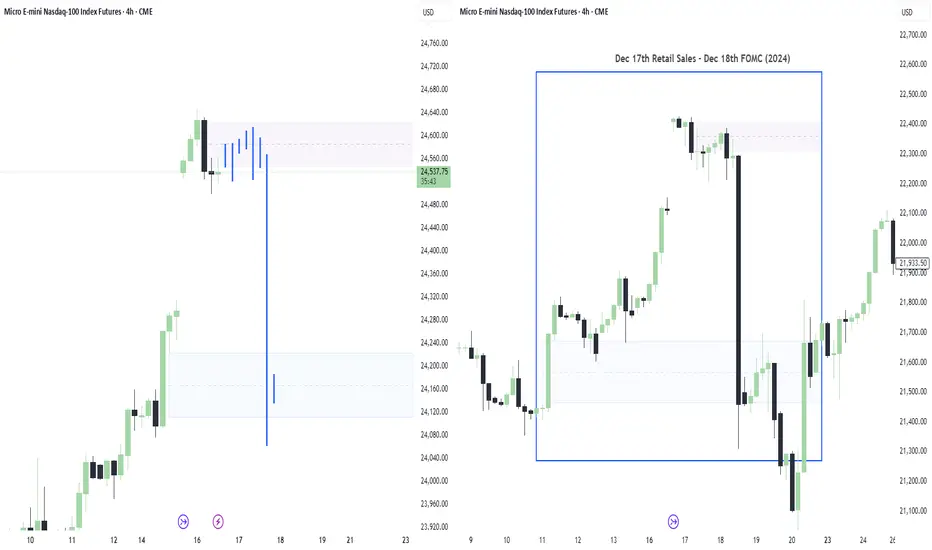
Nasdaq Echoing December FOMC| NQ1 Short SetupAfter spotting the new day opening gap, I immediately analyzed the charts for a comparable All-Time High NDOG scenario. Sure enough, I found nearly identical price action — unfolding on the same days and with the exact same news catalysts.
I’m planning to short from around 24,600.00, with the expectation that 24,200.00 will get taken out.
Let's see how this plays out⚡
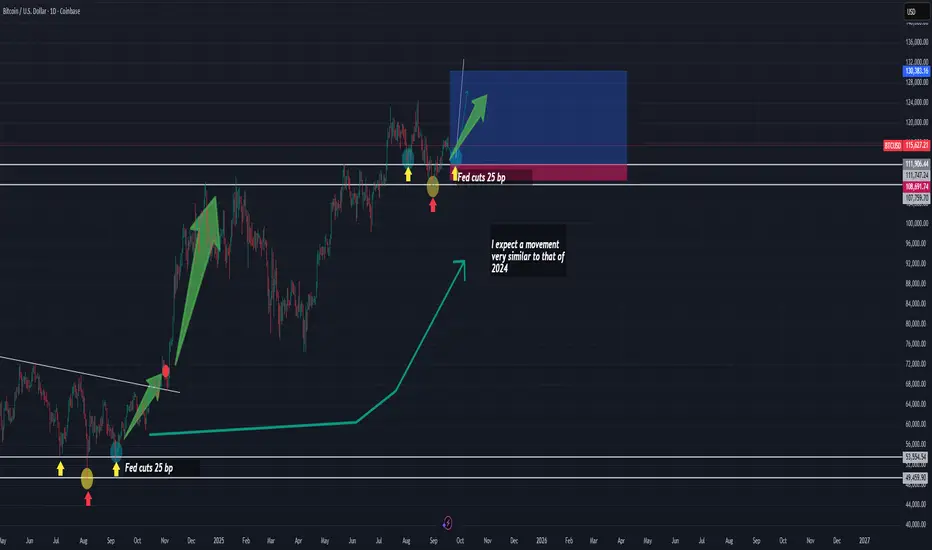
Bitcoin Trade of the Week: Liquidity Rules the MarketOne of the most decisive factors for markets right now is the expansion of liquidity. The growth of global M2 remains evident, particularly in China, where the economy faces a deflationary backdrop that forces authorities to maintain – and even expand – both monetary and fiscal stimulus. Ultimately, these flows permeate global financial markets and, as I’ve explained on several occasions, liquidity is the fuel that drives asset prices.
A Parallel with 2024
What we are observing today shows remarkable similarities with what happened in 2024. Back then, the start of Federal Reserve rate cuts marked a turning point. Even a moderate 25-basis-point cut triggered a rebound that coincided with a technical consolidation phase in Bitcoin, shaped as a descending channel.
Later, in November 2024, when the Fed accelerated the move with a 50-basis-point cut, the result was a much more aggressive bullish impulse.
Today, we find ourselves in an environment with rising probabilities of further cuts in upcoming Fed meetings, which could once again act as a catalyst.
Correlation Context with the Nasdaq 100
Meanwhile, the Nasdaq 100 is printing all-time highs, reflecting the strong risk appetite in tech assets. Bitcoin, in contrast, remains slightly behind its own highs. This divergence can be interpreted as a window of opportunity: if additional liquidity is confirmed through another rate cut, the momentum could spill over into Bitcoin and provide the strength needed to form a technical reversal structure—very similar to the inverted Head and Shoulders (H&S) pattern observed in 2024.
Trading Strategy
Entry Zone: 111,906.44
Stop Loss (SL): 108,607.83
Take Profit (TP): 130,383.16
SHORT ON NASNAS has created a nice rising channel (bearish reversal pattern) and is starting to push outside of the channel to the downside.
I will be selling nas to the previous low looking to catch 800-900 points.

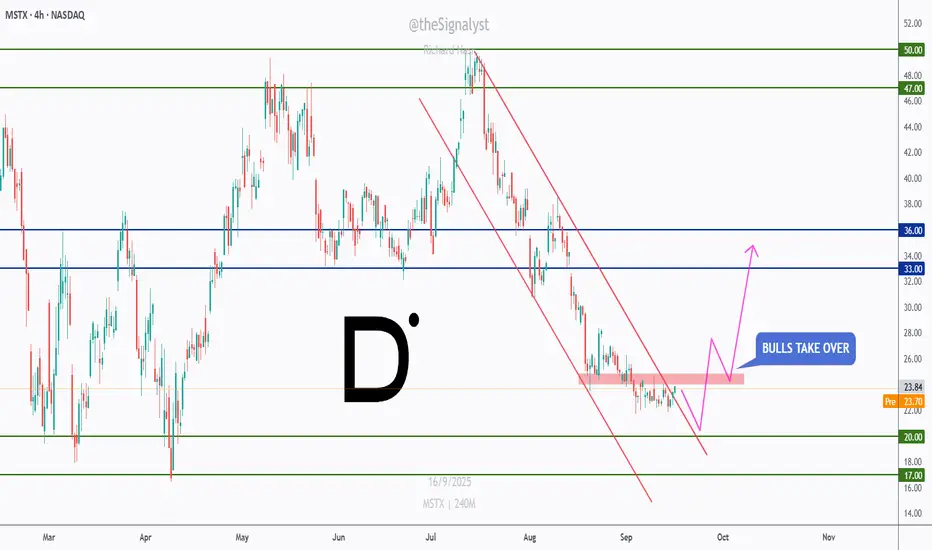
MSTX – Bulls Preparing a Reversal Move!MSTX has been overall bearish 📉, trading inside a well-defined descending channel.
Recently, price approached the $23 – $24 support area, where buyers started showing signs of activity. This zone could act as a potential turning point if momentum continues.
🟢 Support at $23 – $24: A critical level where bulls may step in.
📈 Upside targets: If buyers take over, the first resistance sits around $33, followed by $36 and higher toward $47 – $50.
As long as $23 support holds, bulls 🐂 could drive a short-term reversal that turns into a bigger recovery move.
Patience ⏳ is key — waiting for confirmation before entering can provide a higher-probability setup.
⚠️ Disclaimer: This is not financial advice. Always do your own research and manage risk properly.
📚 Stick to your trading plan regarding entries, risk, and management.
Good luck!
All Strategies Are Good; If Managed Properly!
~Richard Nasr
USNAS100 Braces for Fed Decision – Key Pivot at 24,300USNAS100 – Overview
The Nasdaq is set for a highly volatile session as markets await the Federal Reserve’s rate decision later today.
Traders widely expect a 25 bps cut, but a surprise 50 bps cut—though less likely—would signal stronger confidence in stable inflation and U.S. economic health, fueling a strong bullish rally.
Even if the Fed delivers the expected 25 bps cut, the key market mover will be Chair Powell’s press conference and the updated dot plot, which could reshape expectations for future easing.
Technical Outlook
📉 Bearish scenario
While trading below 24,300, price shows potential for a pullback toward 24,115.
A confirmed break below 24,115 would extend the bearish move toward 23,870 → 23,700.
📈 Bullish scenario
Stabilization above 24,115 keeps the broader uptrend intact.
A breakout above 24,300 would confirm bullish momentum, targeting 24,550 → 24,700 → 24,850.
📌 Market Context:
50 bps cut + dovish Powell → strong bullish breakout above 24,300 toward 24,550+.
25 bps cut + cautious guidance → moderate moves; price may remain range-bound or retest 24,115 before resuming higher.
Hawkish tone → deeper correction toward 23,870 or lower.
S&P500 | H1 Head and Shoulders | GTradingMethod👋 Hello again fellow Traders,
I already have a short open from 6 633.7, but I’d love to see a Head & Shoulders pattern develop so I can scale into more shorts.
So far, the build-up looks promising — volume has picked up significantly on this drop, which is a bearish signal. That said, I’m still waiting on confirmation before committing further.
📊 Trade Plan:
Risk/Reward: 3.1
Entry: 6 614.3
Stop Loss: 6 625.4
Take Profit 1 (50%): 6 586.9
Take Profit 2 (50%): 6 570.2
🔎 What I Need to See First:
A 30m candle to reach and close in range
Lower volume on the candle that closes in range vs. the left shoulder
More candles forming the right shoulder
💡 GTradingMethod Tip:
Patience is key. The best trades usually come when all conditions align — not just some of them.
🙏 Thanks for checking out my post! Make sure to follow me for updates, and keen to hear what your prediction is.
📌 Please note: This is not financial advice. This content is to track my trading journey and for educational purposes only.

Is NASDAQ going for a correction or Stop Hunt?Are we on the right track? If I missed anything please let me know in the comments 🙏🏾

I am bullish on TSLAI have not changed my buy bias for this baby.
II will continue adding TSLA to my portfolio with $360 and $400 as my medium-term take profits.
Share your thought.
If you found this helpful, like, follow and share

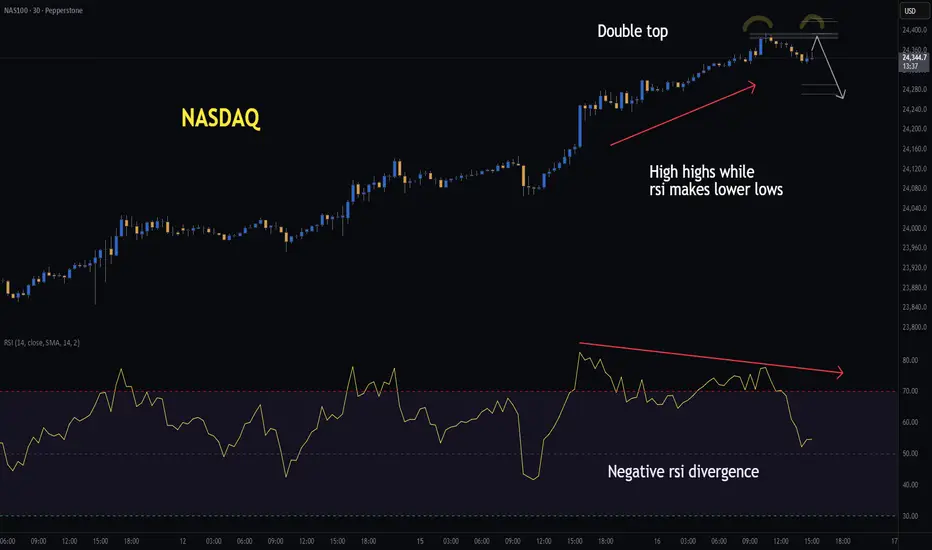
NASDAQ | H1 Double Top | GTradingMethodHello Traders,
I’m watching the Cash100 for a potential double top that could set up a short opportunity. Price is currently making higher highs while RSI is making lower lows — a clear sign of weakening buying momentum, also known as negative RSI divergence.
As further confluence, we have the FOMC tomorrow, and markets often prefer to de-risk ahead of such events. Also, there is a rising wedge on the S&P500 on the hourly chart and the chance that there is also a potential double top on the 30min timeframe.
✅ Conditions before entry:
- 30min candle must close within the range and at the correct level
- The closing candle must meet my required closure rate
- Ideally, volume should be lower (though I’ll allow an exception given it will be the U.S open)
- RSI should confirm with another divergence
📊 Trade Plan:
Risk/Reward: 2.9
Entry: 24,385.1
Stop Loss: 24,418.6
Take Profit 1 (50%): 24,290
Take Profit 2 (50%): 24,271
💡 GTradingMethod Tip:
Patterns like double tops are powerful, but they’re strongest when combined with momentum divergence. Always confirm multiple factors before entering.
🙏 Thanks for checking out my post!
Follow me for the next update and feel free to share your thoughts below — I’d love to hear them.
📌 Please note: This is not financial advice. This content is to track my trading journey and for educational purposes only.
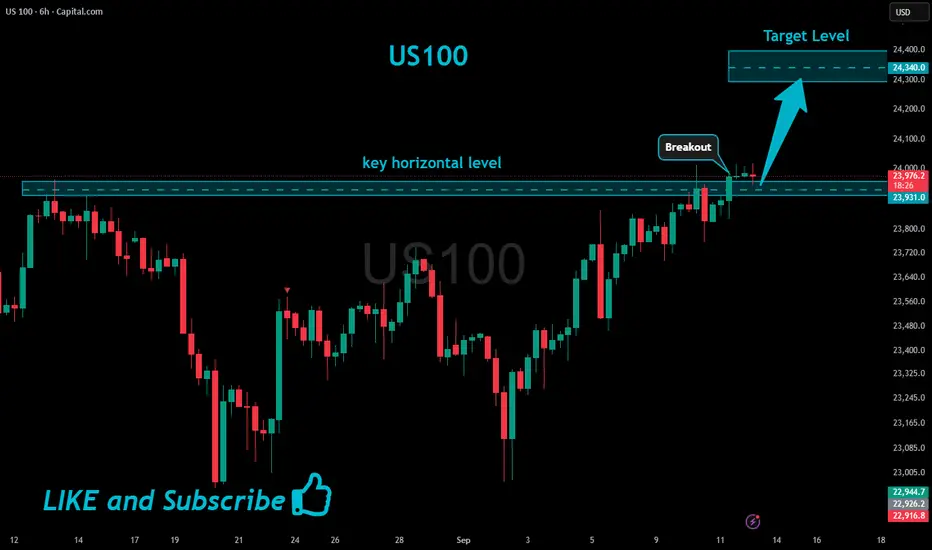
US100 Will Keep Growing!
HI,Traders !
#US100 is trading in an
Uptrend and the index broke
The key horizontal level
Around 23931.0 and the
Breakout is confirmed so
We are bullish biased
And we will be expecting a
Further bullish move up !
Comment and subscribe to help us grow !
NasdaqNasdaq continued to renew highs overnight. This overbought region is likely to trigger a pullback with profit-taking to the 24250 range. Today we'll see the Retail Sails economic data, which could be favorable for the technology sector and lead to 24500.