NQ100 Intraday Outlook – Sept 8, 2025🧠 NQ100 Intraday Outlook – Sept 8, 2025
Bias: Intraday Bearish after NY Open
Price is currently trading within a well-defined premium zone, between the Sunday-Monday Order Block and the BPR M30 area.
🧩 Key Observations:
Price tapped into a minor M5 Order Block (OB) right after the 8:30 NY macro event.
We're seeing a reaction to a short-term OB, with a small push up likely to grab liquidity above the London session high.
Expecting liquidity run + rejection from the upper OB zone (23,810–23,830).
🔽 Bearish Scenario:
After the sweep of local highs, I anticipate a sell-off toward the Imbalance zone below (23,710 area).
Main targets are:
Imbalance fill
Possibly further down toward Weekly Open near 23,680
🔧 Confluence:
Midnight Open has already been reclaimed.
NY AM session is about to open – expecting expansion to provide confirmation.
Potential divergence between NQ (stronger) and ES (weaker) gives context for relative weakness later in the session.
📌 Idea Summary:
I expect one final push into the premium zone to grab liquidity before reversing down toward the Imbalance and possibly into the Weekly Open.
Nasdaq

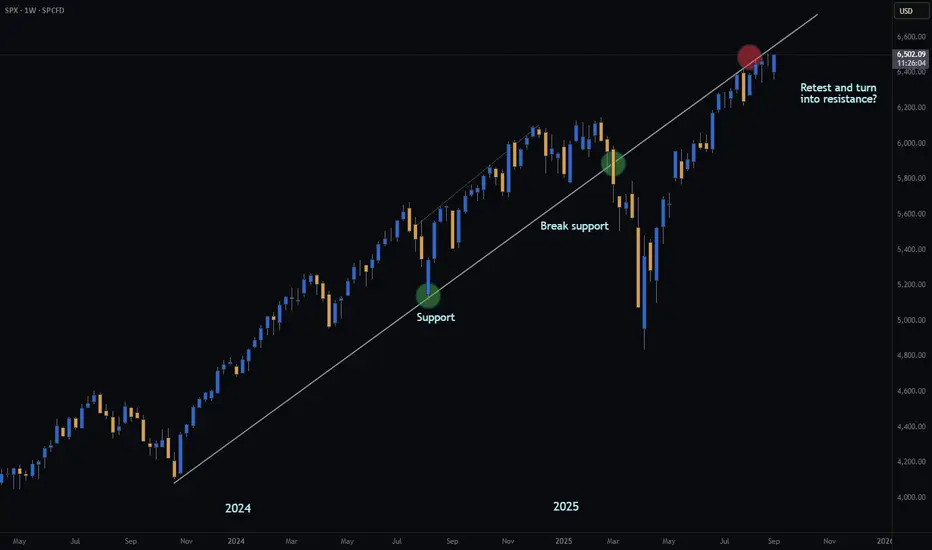
S&P500 | 100 year bullish channel | GTradingMethodHello Traders - Happy Monday!
I thought this was a very interesting perspective on S&P500.
What they don’t want you to see... 👀
The S&P has been moving inside a bullish channel for nearly 100 years (since 1925).
Right now, price is breaking out of that channel but is it fakeout?
If it’s a fakeout, the implications are huge: we could be looking at a 70% drop back to the bottom of the channel.
⚠️ Chart is on the monthly timeframe with a logarithmic scale.
What do you think — breakout or fakeout? Very keen to hear all your thoughts
#TradingLife

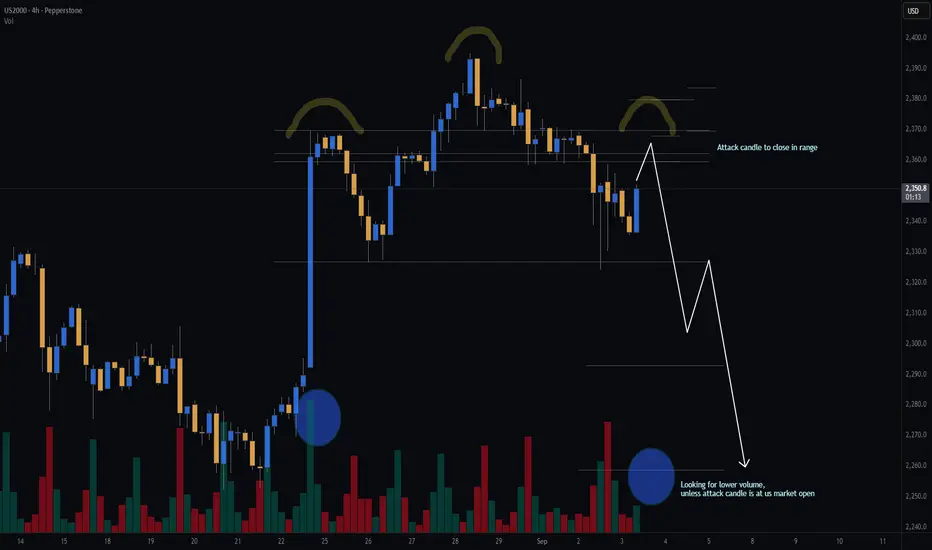
Silver | H4 Double Top | GTradingMethod
🧐 Market Overview:
All my variables have been met.
Some of the variables I look for are as follows:
- RSI divergence
- Lower volume on top 2 (In this case JOLTS came out, which causes an exception to the volume rule)
- Attack candle closes in range
Opened a short position on Silver.
📊 Trade Plan:
Risk/Reward: 3.9
🎯 Entry: 41.29
🛑 Stop Loss: 41.67
💰 Take Profit 1 (50%): 39.93
💰 Take Profit 2 (50%): 39.34
💡 GTradingMethod Tip:
Sometimes news events (like JOLTS) can disrupt normal volume behavior. That’s why it’s key to use multiple variables together, not rely on just one signal.
🙏 Thanks for checking out my post!
Make sure to follow me to catch the next idea and please share your thoughts — I’d love to hear them.
📌 Please note:
This is not financial advice. This content is to track my trading journey and for educational purposes only.

NAS100 - Stock Market, Waiting for Inflation Index?!The index is above EMA200 and EMA50 on the one-hour timeframe and is in its long-term ascending channel. If the drawn upward trend line is maintained, we can expect Nasdaq to reach its previous ATH. In case of its valid breakdown, its downward path will be smoothed to the specified demand zone, where it can be bought with appropriate risk-reward.
U.S. equities closed lower on Friday after a volatile session, capping off a turbulent week in negative territory. Initially, weaker-than-expected employment data fueled optimism that the Federal Reserve would move toward further rate cuts. However, growing fears of an economic recession quickly overshadowed that optimism and pushed the indexes into the red.
Following the labor market report, expectations for a 25-basis-point rate cut at the Fed’s September meeting are now virtually certain. The main question, however, is how fast subsequent cuts might unfold. Some analysts have even floated the possibility of a surprise 50-basis-point cut on September 17. Fed Chair Jerome Powell, speaking at the Jackson Hole symposium, stressed that risks stemming from labor market weakness may now outweigh inflation risks—a factor that could justify a shift in the central bank’s policy approach.
Nick Timiraos, a prominent Wall Street Journal reporter closely tracking Fed policy, noted that the sharp slowdown in job growth over the summer has likely cemented the Fed’s decision to cut rates by 25 basis points in the upcoming meeting.
Still, he made no explicit mention of a 50-basis-point move. While markets have raised the probability of that scenario to 14%, Timiraos believes the main focus remains on a more moderate reduction. He also observed that the latest jobs report has deepened uncertainty over the pace and scope of cuts beyond September—a challenge that policymakers and markets will grapple with in the months ahead.
Barclays Bank now projects the Fed will lower rates three times in 2025—each time by 25 basis points in September, October, and December. This is an upward revision from its earlier forecast of just two cuts in September and December.
President Donald Trump once again lashed out at Fed policy in a post on his social media platform, writing: “Jerome Powell should have cut rates long ago. But as usual, he has acted too late.”
Meanwhile, mounting concerns over ballooning fiscal deficits—not only in the U.S. but also in countries like Japan, France, and the U.K.—have placed added pressure on long-dated bonds. The yield on the 30-year U.S. Treasury briefly climbed to a one-and-a-half-month high last week. At the same time, the Treasury Department plans to issue new three-year, ten-year, and thirty-year securities next week, an event that could further fuel volatility in the bond market.
The coming week will be light in terms of data volume, yet the few scheduled releases will carry significant weight as inflation once again takes center stage. On Wednesday, the Producer Price Index (PPI) for August will be published. Forecasts suggest both the headline and core readings will show sharp declines compared to July.
On Thursday, the European Central Bank (ECB) will hold its policy meeting, where markets currently expect the deposit rate to remain unchanged at 2.15%. Shortly afterward, traders will turn their attention to the U.S. Consumer Price Index (CPI) for August, along with weekly jobless claims data—closely monitored for signs of potential weakness in the U.S. labor market.
Finally, on Friday, the preliminary University of Michigan Consumer Sentiment Index will be released. This survey has been a particularly important gauge of inflation expectations this year, offering deeper insights into how U.S. households perceive price trends.
The PPI, which reflects changes in goods prices at the factory gate, often provides more forward-looking signals than the CPI. As shown in July’s data, any unexpected surge in August’s numbers could temper investors’ optimism about the pace of rate cuts. For now, the impact of tariffs on goods prices appears limited, while the Fed’s main concern remains the risk of renewed inflationary pressures in the services sector. According to the Cleveland Fed’s Nowcast model, headline inflation rose 0.1% in August to reach an annualized rate of 2.8%, while core inflation held steady at 3.1%.

Will Fed rate cut expectations continue to fuel US equity gains?
US August job growth missed expectations, highlighting labor market weakness, while rising Fed rate cut odds kept equities higher. Broadcom (AVGO) delivered strong 3Q earnings with robust AI-driven growth and issued an upbeat 4Q revenue forecast. Despite valuation concerns, Morgan Stanley (MS) expects multiple Fed cuts to sustain equity gains and views September dips as buying opportunities.
US500 extended its uptrend, briefly setting a new high. The index remains within the ascending channel and above both EMAs, signaling the potential extension of bullish momentum. If US500 holds above EMA21, the index may breach the 6530 high. Conversely, if US500 breaks below EMA21 and the channel’s lower bound, the index could retreat toward the support at 6340.

NASDAQ (NQ1!): Buy It Until The Market Notifies Us Otherwise!Welcome back to the Weekly Forex Forecast for the week of Sept 8 - 12.
In this video, we will analyze the following FX market: NASDAQ (NQ1!) NAS100
The NASDAQ looks poised to move higher. There is potential for it to make a new ATH.
Wait for pullbacks to poi's for valid long setups.
I do not see a reason to sell this market. Until there is a bearish break of market structure, buys are the ticket.
Enjoy!
May profits be upon you.
Leave any questions or comments in the comment section.
I appreciate any feedback from my viewers!
Like and/or subscribe if you want more accurate analysis.
Thank you so much!
Disclaimer:
I do not provide personal investment advice and I am not a qualified licensed investment advisor.
All information found here, including any ideas, opinions, views, predictions, forecasts, commentaries, suggestions, expressed or implied herein, are for informational, entertainment or educational purposes only and should not be construed as personal investment advice. While the information provided is believed to be accurate, it may include errors or inaccuracies.
I will not and cannot be held liable for any actions you take as a result of anything you read here.
Conduct your own due diligence, or consult a licensed financial advisor or broker before making any and all investment decisions. Any investments, trades, speculations, or decisions made on the basis of any information found on this channel, expressed or implied herein, are committed at your own risk, financial or otherwise.

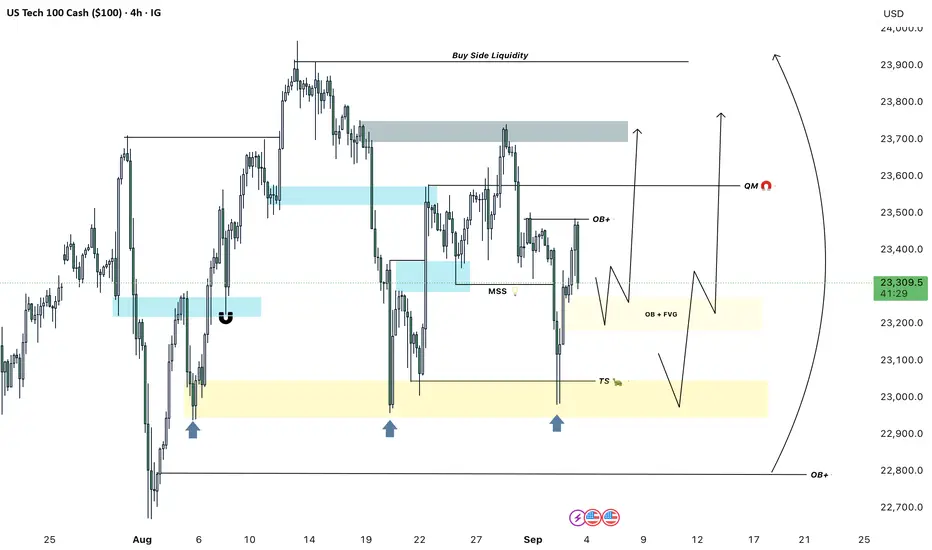
BTC - Bullish continuation in the makingMarket Context
BTC has recently broken out of a long-standing descending trendline, marking a significant shift in sentiment. This breakout signals the end of the controlled downtrend and sets the stage for a possible bullish continuation. At the same time, the chart shows a clear sweep of sell-side liquidity at the lows, which often serves as the fuel for a reversal.
Trendline Breakout & Liquidity Sweep
The bullish breakout of the old upper trendline is an important technical event. Combined with the earlier sell-side liquidity sweep, this suggests that downside liquidity has been cleared and that the path of least resistance could now be higher. Such a combination often marks the start of a new leg in the trend.
Market Structure Shift Retest
Following the breakout, price has pushed higher and printed a market structure shift (MSS). The current retest of this MSS zone will be key — if it holds, it provides the ideal spot for bulls to reload positions. This retest acts as confirmation that the breakout is valid, not just a short-lived deviation.
Next Liquidity Grab & Upside Targets
Above the current range sits a clear buy-side liquidity pool. The next logical move would be a grab of that liquidity, which could extend into a more aggressive bullish expansion toward higher levels. The structure suggests a stair-step move higher: liquidity grab, retest, and then continuation toward 115k–117k zones.
Final Thoughts
The sell-side liquidity sweep, trendline breakout, and market structure shift all point to a bullish shift in momentum. The key lies in how price reacts to the retest — hold it, and the next liquidity levels are likely to be taken.
If this breakdown helped clarify the setup, a like is much appreciated — and let me know in the comments: are you playing the retest, or waiting for the liquidity grab above?

Understanding Consolidation & Trading itWhat Consolidation Is
Consolidation is a market phase where price moves sideways within a defined range, showing indecision or balance between buyers (bulls) and sellers (bears).
Characterized by low volatility, overlapping candles, and no clear trend direction.
Often occurs after strong moves (as the market pauses) or before breakouts (accumulation/distribution).
Impact on Bulls & Bears
Bulls: View consolidation near highs as accumulation (buyers building positions before a breakout upward).
Bears: View consolidation near lows as distribution (sellers unloading before a breakdown).
Both sides place stop orders outside the range → creating liquidity pools that smart money hunts.
How Traders Can Take Advantage
Range Trading – Buy near support of the range, sell near resistance, until breakout occurs.
Liquidity Strategy – Wait for fakeouts beyond consolidation, then trade in the opposite direction (stop hunt setup).
Consolidation Across Timeframes
Lower Timeframes (1m–15m):
Looks like noise but is often where scalpers range trade.
Breakouts can give small but quick moves.
Mid Timeframes (1H–4H):
Shows clear accumulation/distribution phases.
Useful for intraday & swing traders.
Higher Timeframes (Daily–Weekly):
Represents major market indecision.
Breakouts from these zones often fuel massive trend moves.
✅ Summary:
Consolidation = sideways range = balance of bulls & bears.
Inside range → fade the extremes.
Outside range → trade support & resistance or liquidity sweep.
On different timeframes → the same consolidation can be noise on 5M, but a critical accumulation on the Daily chart.

Weekly insighta EUR/USD S&P500 NVDA METAThis video is a weekly insights report from a financial trader on TradingView. I amdiscussing my analysis and predictions for several financial instruments based on technical and fundamental indicators.
Key Points:
Market Overview: The speaker talks about the impact of recent US unemployment data on the market, which led to a "parabolic" rise in the Euro dollar.
Euro Dollar: Based on a technical analysis of an "expanding diagonal" and an old trend line, the speaker believes a false breakout is likely. They plan to avoid trading USD pairs for the next 11 days, waiting for the Fed's interest rate decision.
S&P 500: The speaker notes a five-wave Elliot wave pattern with an expanding diagonal. They are waiting for the price to break below a trend line and a red confirmation line before considering a short position. They anticipate a "choppy" market for the coming week.
Nvidia: The speaker received "hate comments" for their previous analysis of Nvidia. They stand by their short position, citing a break below the exponential moving average, a "huge" divergence on the monthly chart, and a "shooting star" candle pattern. They note that Nvidia is the heaviest stock in the S&P 500, representing 7.5% of the index.
Bitcoin: The speaker points out that Bitcoin's price has crossed and retested two moving averages, which they see as a bearish sign. They will consider a short position if the price breaks below the previous low. They also expect Bitcoin to be stagnant in the coming week while the market waits for the Fed's decision.
Call to Action : The video concludes with a plea for viewers to subscribe to the speaker's TradingView channel for more trading insights and short-trade opportunities.

NAS100 At Major Resistance - Breakout or Reversal?NAS100 Technical Analysis: 🚀 At Major Resistance - Breakout or Reversal? 📉
Asset: NAS100 (NASDAQ 100 CFD)
Analysis Date: September 5, 2025
Current Closing Price: 23,639.8 (as of 12:59 AM UTC+4)
Timeframes Analyzed: 1H, 4H, D, W
Executive Summary & Market Outlook 🧐
The NAS100 is at a critical technical juncture, testing a formidable resistance zone between 23,600 and 23,800. 📊 The index is in a clear long-term bullish trend but shows signs of short-term exhaustion after a powerful rally. This is a classic "make-or-break" level. A decisive breakout above 23,800 could ignite a new leg up towards 24,500, while a rejection here may trigger a significant corrective pullback towards 22,800. This analysis provides a roadmap for both intraday traders 🎯 and swing traders 📈.
Multi-Timeframe Technical Analysis 🔍
1. Trend Analysis (Daily & 4-Hour Chart):
Primary Trend: 🟢 Bullish. Price is above all major Daily Moving Averages (200, 100, 50 EMA), which are aligned bullishly.
Short-Term Trend: 🟡 Bullish but Overextended. The rally has been near-vertical, suggesting the market is ripe for a pause or pullback.
2. Key Chart Patterns & Theories:
Resistance Confluence Zone 🧱: The current price is battling a massive resistance cluster. This zone includes:
A prior major swing high (Price Action Resistance).
The 127.2% and 161.8% Fibonacci extension levels from the last significant correction.
A potential Bullish Cypher pattern's Potential Reversal Zone (PRZ).
Elliott Wave Theory 🌊: The rally from the last major low is best counted as a powerful Impulse Wave. We are likely in the final stages of Wave 5 or a complex Wave 3 extension. This implies that while the trend is up, a larger Wave (4) correction is increasingly probable. Typical retracement targets for a Wave 4 are the 38.2% Fib level near 22,800.
Ichimoku Cloud (H4/D1) ☁️: Price is trading high above the Cloud on daily charts, confirming the strong bullish trend. The Lagging Span (Chikou Span) is also well above price, indicating sustained buying pressure. However, such extreme extensions often precede consolidation.
Gann Theory ⏳: The 23,600-23,800 area represents a key mathematical resistance zone. A daily close above this could open the path to the next Gann angle target.
3. Critical Support & Resistance Levels:
Resistance (R1): 23,800 - 24,000 (Key Psychological & Technical Ceiling) 🚨
Resistance (R2): 24,500 (Projected Target)
Current Closing Price: ~23,640
Support (S1): 23,200 - 23,400 (Immediate Support & 21-period EMA) ✅
Support (S2): 22,800 - 23,000 (Major Support - 38.2% Fib & Prior Breakout Zone) 🛡️
Support (S3): 22,200 (200-Day EMA & 50% Fib)
4. Indicator Consensus:
RSI (14-period on 4H/D): Reading is above 70 on both timeframes, signaling severely overbought conditions. 📛 This is a warning against chasing longs at these highs. A bearish divergence is forming on the 4H chart, hinting at weakening momentum.
Bollinger Bands (4H) 📏: Price is consistently riding the upper band, a sign of a strong trend. However, a move back towards the middle band (20-period SMA) is a common next step after such extensions.
Moving Averages: The bullish alignment (EMA8 > EMA21 > EMA50) is intact. The EMA 21 on the 4H chart (~23,400) is critical immediate support.
Volume & VWAP: Volume has been declining on the most recent push higher, a potential bearish divergence 📉 suggesting a lack of conviction at these highs.
Trading Strategy & Forecast 🎯
A. Intraday Trading Strategy (5M - 1H Charts):
Bearish Scenario (Rejection Play) ⬇️: This is the preferred setup given overbought conditions. Look for bearish reversal candlestick patterns (e.g., Bearish Engulfing, Evening Star 🌟) at or near the 23,800 resistance.
Entry: On confirmation of rejection.
Stop Loss: Tight, above 23,850.
Target: 23,400 (TP1), 23,200 (TP2).
Bullish Scenario (Breakout Play) ⬆️: If buyers overpower and we get a strong 1H close above 23,850, a momentum long could be viable.
Entry: On a small pullback to ~23,780 (re-test as support) or on the breakout.
Stop Loss: Below 23,650.
Target: 24,200 (TP1), 24,500 (TP2).
B. Swing Trading Strategy (4H - D Charts):
Strategy: WAIT FOR A PULLBACK. The risk/reward for new long entries at this resistance is poor. 🚫 The optimal strategy is to wait for a healthy correction to key support zones to add long positions.
Ideal Long Zones: 23,200 (shallow pullback) or 22,800 (deeper correction). ✅
Bearish Risk: A daily close below 22,800 would signal a much deeper correction is likely underway, potentially targeting 22,200.
Risk Management & Conclusion ⚠️
Key Risk Events: High-impact US economic data (e.g., NFP, CPI) and Fed policy announcements are paramount. 🔥 Any hawkish surprises could be the catalyst for a sharp tech-led selloff.
Position Sizing: The potential for increased volatility demands conservative risk management. Never risk more than 1-2% of your account on a single trade.
Conclusion: The NAS100 is bullish but exhausted. 🥴 The current resistance zone is a high-risk area for new longs and a high-probability area for a pullback. 🎯 Swing traders should be patient for a better entry. Intraday traders can play the range between 23,200 and 23,800 until a decisive break occurs. The overall trend remains up, but a period of consolidation or correction is the most probable outcome in the near term.
Overall Bias: 🟢 Bullish above 22,800 | 🟡 Neutral/Bearish below 23,200
For individuals seeking to enhance their trading abilities based on the analyses provided, I recommend exploring the mentoring program offered by Shunya Trade. (Website: shunya dot trade)
I would appreciate your feedback on this analysis, as it will serve as a valuable resource for future endeavors.
Sincerely,
Shunya.Trade
Website: shunya dot trade
Disclaimer: This post is intended solely for educational purposes and does not constitute investment advice, financial advice, or trading recommendations. The views expressed herein are derived from technical analysis and are shared for informational purposes only. The stock market inherently carries risks, including the potential for capital loss. Therefore, readers are strongly advised to exercise prudent judgment before making any investment decisions. We assume no liability for any actions taken based on this content. For personalized guidance, it is recommended to consult a certified financial advisor.

For Those Trading PalantirPLTR has greatly accelerated it's growth trend lines. Right now PLTR is almost 3 years ahead of it's main long term trend line. What this means is upside potential is diminishing.
I see a lot of long charts for PLTR and wanted to share that support is actually at $134. So if you're a PLTR trader, looking to buy, that's the best area to do it.
If however you're looking to sell, then $230 is your spot.
I feel like people buying PLTR are playing a bit with fire as the fast gains are likely gone and eventually a return to the long term trend line is likely. I don't see that happening at least until IXCO runs into resistance, so until then $134 is the buy area.
Good luck!

SHORT 1HOUR CHART SL 88% FIBOThe previus setap was good.. but no profit no loss
Same strategy
SL 88%
TP LOCAL LOW
SLM TRAILING

Nasdaq 100 (US100) – Short Opportunity Still AliveThe Nasdaq is still showing weakness at it's current level. There’s been more than enough time and news to push this market higher – but nothing happened. That, in itself, is a strong signal.
What we’re seeing now:
Weak jobs data: ADP and JOLTS both came in soft. Job openings hit the lowest level in nearly a year. That boosted rate-cut hopes – but the Nasdaq didn’t move.
Tech underperformance: Broader markets found some strength, but tech keeps lagging behind. Nasdaq isn’t leading like it used to – that’s bearish.
China IPO risks: New Nasdaq restrictions on Chinese listings are adding pressure to overall tech sentiment.
No follow-through: Even with dovish expectations and weak macro, bulls can’t lift the index. That says a lot.
Trade Setup (based on the chart):
Entry: between 23,480 and 23,520
Stop Loss: above 23,600 or if not high leverage even 23,720
Targets:
T1: 23,250
T2: 23,000
T3: will update depending on momentum
Why this short still makes sense:
The Nasdaq had multiple bullish triggers – weak data, Fed expectations, soft dollar – and didn’t move.
Sentiment is shaky, buyers aren’t stepping in.
Tech remains heavy while other sectors rotate.
Price is stalling right at resistance after a weak bounce.
Summary:
Plenty of chances to break out – but nothing happened. That’s a red flag.
I’m shorting between 23,480 and 23,520, with targets at 23,250 and 23,000.
Setup is invalid if we break cleanly above 23,720.
No financial advice – just how I see the chart right now.

S&P | KEY RESISTANCE | GTradingMethodHello traders!
Has the S&P finally met its match?
Is this just a retest… or the beginning of a much deeper move?
- Broke diagonal support earlier this year
- Retesting previous support now
- Potential daily double top forming
If the retest holds, it’s a long way down… 📉
What are your thoughts? Keen to hear them :)
Signing off
G
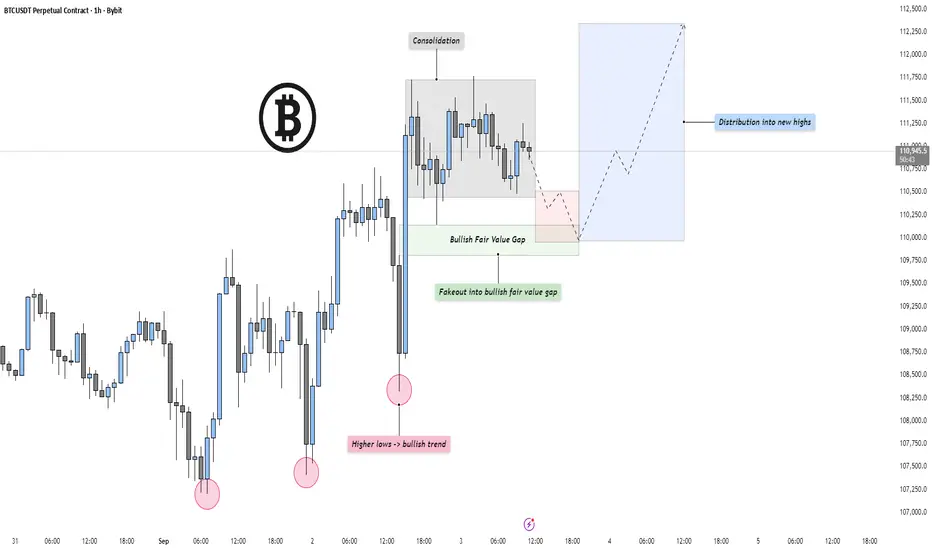
BTC - Consolidation, Manipulation & Distribution into new HighsMarket Context
BTC is currently printing a series of higher lows, which signals a bullish underlying trend despite short-term volatility. Each dip has been defended, showing that buyers are stepping in earlier with every pullback. This type of structure often builds the foundation for an eventual breakout higher.
Consolidation Phase
After the strong bounce from recent lows, price has moved into a tight consolidation range. This is a classic "cooling-off" period where liquidity builds up and traders wait for direction. Consolidations at this stage often precede expansion moves, and the side that breaks tends to dictate the next wave of momentum.
Bullish Fair Value Gap & Fakeout
Just below the consolidation lies a Bullish Fair Value Gap. Price may fake out to the downside into this zone, trapping breakout sellers and filling imbalance before reclaiming levels. This setup is particularly interesting because the higher-timeframe structure still favors the bulls, making the FVG a potential springboard for continuation.
Distribution into New Highs
If the FVG reacts as expected, the next phase would likely be distribution into new highs. That means clearing out liquidity above the consolidation and targeting the next round of upside expansion. In this scenario, the higher lows, the fakeout trap, and the FVG all align to fuel the breakout.
Final Thoughts
The higher-low structure gives this setup a bullish tilt, but the real clue will come from how price behaves around the Fair Value Gap. A clean reaction there could be the trigger for a sharp push into new highs.
If this breakdown gave you clarity on the structure, a like would be appreciated — and drop your thoughts in the comments. Do you expect the fakeout into the FVG, or are you positioned differently?
S&P500 | Daily Double Top | GTradingMethodHello Traders.
Welcome to today's trade idea by GTradingMethod.
🧐 Market Overview:
I’ve opened a short on the cash500 (S&P 500) at 6521. All GTradingMethod variables have been met, which means this trade setup qualifies under my system.
Additional confluences suggesting weaker buying strength include:
- RSI making lower highs while price pushed higher highs.
- Volume tapering off toward the latter part of the rally.
- MACD on sell signal
The only hesitation is that money flows have not decreased in the later stages of this move — but rules are rules. My edge is probability-based, so when my variables align, I must take the trade consistently.
📊 Trade Plan:
Risk/reward = 9.2
Entry price = 6520
Stop loss price = 6544
Take profit level 1 (50%) = 6370
Take profit level 2 (50%) = 6215
💡 GTradingMethod Tip:
A high RR doesn’t make a trade safer — it simply reflects how far the market could move relative to your risk. Always focus on process and probability, not just the potential payout.
🙏 Thanks for checking out my post!
Make sure to follow me to catch the next idea and please share your thoughts - I would like to hear them.
📌 Please note:
This is not financial advice. This content is to track my trading journey and for educational purposes only.

Russel 2000 | H4 Head and Shoulders | GTradingMethodHello Traders.
Welcome to today's trade idea by GTradingMethod.
🧐 Market Overview:
Since April 2025, this rally has been powering higher, leaving little room for pullbacks. But momentum is starting to show cracks — indicators are flashing signs of exhaustion. This doesn’t mean a sharp drop is guaranteed; markets often pause and drift sideways to shake off overbought pressure.
What I’m watching closely now is whether a head and shoulders pattern takes shape. If price steps into and closes in my entry zone, it could mark the start of a deeper pullback, but confirmation is key before jumping in.
📊 Trade Plan:
Risk/Reward: 3.9
Entry: 2,359.6
Stop Loss: 2,379.7
Take Profit 1 (50%): 2,292.9
Take Profit 2 (50%): 2,258.7
💡 GTradingMethod Tip:
Patience is a trading edge. Waiting for confirmation keeps you aligned with probability and protects you from unnecessary losses.
🙏 Thanks for checking out my post!
Make sure to follow me to catch the next idea and please share your thoughts - I would like to hear them.
📌 Please note:
This is not financial advice. This content is to track my trading journey and for educational purposes only.
Nasdaq - Preparing for another correction!🚔Nasdaq ( TVC:NDQ ) is starting to look weak:
🔎Analysis summary:
Over the course of the past couple of months, we witnessed an incredible rally on the Nasdaq. Following this previous price action, it is quite likely that we will soon see another correction. This could start with the current retest of the channel resistance trendline.
📝Levels to watch:
$23.000
SwingTraderPhil
SwingTrading.Simplified. | Investing.Simplified. | #LONGTERMVISION

Fed cut odds hit 97% ahead of Friday’s jobs report Markets are waiting for Friday’s U.S. NFP jobs report, which could heavily influence the Federal Reserve’s next move on interest rates.
Traders want a result that supports the case for rate cuts but doesn’t raise fears of a weakening economy. The ADP private payrolls report showed 54,000 new jobs in August. Stocks moved higher on the news, as wall street saw the number as weak enough for the Fed to cut rates in September, but not so weak that it signals a recession.
According to CME Group’s FedWatch tool, there is now a 97% chance the Fed will lower rates when it meets in two weeks.

Nasdaq 100 Holds Pivot Zone 23,280–23,360USNAS100 – Overview
The Nasdaq 100 reversed from the 23,045 support highlighted yesterday and is now trading above the pivot zone at 23,280–23,360.
Technical Outlook:
📈 Bullish scenario: As long as price holds above 23,280–23,360, upside momentum may extend toward 23,510 → 23,620 → 23,720. A confirmed breakout above 23,770 would strengthen the bullish trend and open the path to a new ATH near 24,090.
📉 Bearish scenario: On the downside, failure to hold above 23,280 would expose 23,045, with full bearish confirmation only if the index stabilizes below 22,990, targeting 22,720.
Key Levels:
Resistance: 23,510 – 23,620 – 23,720
Support: 23,280 – 23,045 – 22,720

F&G Annuities & Life Inc — Insider Activity ReportSergio Richi Premium ✅
NYSE:FG — F&G Annuities & Life Inc (NASDAQ:FG) Insider Activity Report | Financial | Insurance-Life |USA | NASDAQ | September 04, 2025.
Price (Sept 4, 2025) : $34.99
Insider Activity
CEO Chris Blunt just bought 7,000 shares at $34.02 on Sept 2. That pushes his 2025 insider buys to $2.5M+. No insider sales on record. When the CEO keeps writing checks into weakness, that’s conviction you don’t ignore.
(SEC Form 4)
www.sec.gov
1. Company Overview
FG is a life insurance and annuities player, majority-owned by Fidelity National Financial. Core business: retirement security through annuities, life insurance, and pension risk transfers. Rising rates have juiced demand for fixed-index annuities. Q2 revenue: $1.35B (+12.6% YoY), with sales momentum accelerating.
Dividend just bumped to $0.22/share (2.5% yield).
2. The Setup
• Stock is down ~15% YTD but holding a strong base near $34 support.
• Heavy institutional ownership (95.71%) and recent inflows from funds like BlackRock, DFA, and Millennium.
• Catalysts ahead: Q3 earnings in November, sector tailwinds from higher-for-longer rates, and annuity demand from aging demographics.
Charts:
• (1D)
Insider Trades:
FG seasonality:
FG Hedge Fund Flows:
FG Ownership:
3. The Trade:
Entry : $34–35
🎯 Take Profit 1: $40.85 (+16.75%)
🎯 Take Profit 2: $43.70 (+24.89%)
My View
The CEO is doubling down, institutions are scaling in, and fundamentals are firm. Risk/reward skews bullish — I see a 16–25% move higher as the base case, with upside surprise if annuity sales keep beating.

NASDAQ H4 : RETESTING TIME ?? Hello Everyone ,
The Nasdaq Currently Got Rejection From OB (23,480)
We Are Expecting Retest Buy From Below Zones ⬇️
OB + FVG (23,275 / 23180)
SUPPORT (23,00 / 22,995)
ORDER BLOCK ( 22,785)
Hope You Understand , Follow Us For More
Good Luck 🤞
XAU/USD | Gold Breaks $3500 – New ATH Hit! What’s Next?By analyzing the gold chart on the 12-hour timeframe, we can see that today, gold finally managed to print a new All-Time High (ATH)! As anticipated, price broke above $3500 and rallied up to $3508, hitting our previous bullish target and sweeping the liquidity resting above the key $3500 level.
After reaching $3508, gold entered a correction phase, dropping to $3470, but quickly bounced back and climbed to $3494. At the time of writing, gold is trading around $3478, showing a bearish reaction — but it's best to wait and see whether price gets rejected again from this level or not.
If gold is to undergo a deeper correction, the next potential downside targets are $3465, $3454, and $3420. This analysis will be updated — stay tuned for more confirmations from the market!
MY LATEST ANALYSIS :
