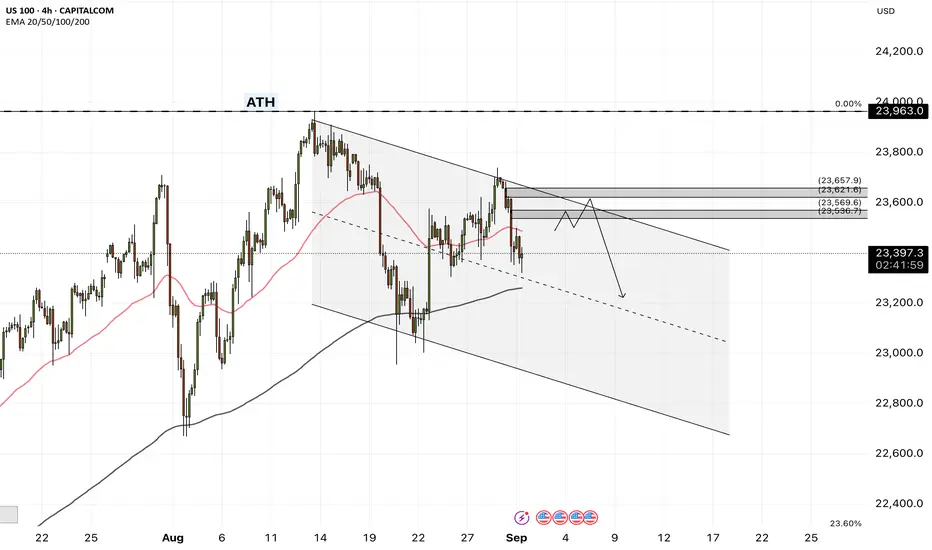
NASDAQ Eyes 23,565 Pivot as PCE Report LoomsNASDAQ – Update
The Nasdaq slipped on Friday as traders turned cautious ahead of the highly anticipated PCE inflation report, the Fed’s preferred gauge that could heavily influence the September rate decision. The release, expected before the bell, will likely set the near-term trend.
Technical Outlook:
The index reversed from resistance, showing signs of pressure ahead of the data.
A 1H close below 23,565 will confirm bearish continuation toward 23,435 → 23,295 → 23,170, especially if PCE comes in hotter than expected.
If the report is softer, bullish momentum may resume, targeting the ATH at 23,870, with extended resistance at 24,090.
Key Levels:
Support: 23,565, 23,435 – 23,295 – 23,170
Resistance: 23,690 – 23,870 – 24,090
📌 Bias: Neutral ahead of the PCE release. Expect high volatility and wait for confirmation at the pivot level before positioning.
Nasdaq

Nasdaq “Tug of war”
Nasdaq 100 has recently shown a significant shift in momentum on the 4hour chart, with bearish pressure taking hold. After a strong upward trend, the index has experienced a sharp decline, now consolidating within a critical range. The key to the next major move lies in the defence or failure of the defined support and resistance levels.
Current Market & Price Action
The price action clearly indicates a period of bearish dominance, marked by a substantial selloff from recent highs. The price is currently contained below a key resistance level at 23,515.6, which had previously acted as support. This consolidation phase is critical and suggests a tug of war between bulls and bears. The current price hovers around 23,406, leaving both a bullish reversal and a bearish continuation as plausible outcomes.
The Bearish Case : Reaching for 23,000
If the price continues to face rejection at the 23,515.6 level, the path of least resistance is to the downside. The next major target for sellers is the significant support zone between 23,000 and 22,900. This level is not only a major psychological number but also represents a strong structural support zone from previous price action.
A confirmed break below the current consolidation range, particularly the 23,331.4 level, would signal a continuation of the downtrend. A move to the 23,000-22,900 zone represents a potential drop of approximately 1.36%, as measured on the chart. Traders should watch for a decisive break of this support, which could trigger a much larger sell off.
The Bullish Case:
Reclaiming Momentum
For the bullish narrative to resume, the index must convincingly break and hold above the 23,515.6 resistance. A strong close above this level on the 4hour chart would invalidate the immediate bearish outlook and signal a potential reversal. If this occurs, the next logical target would be the higher resistance at 23,757.2, marking a potential recovery of the recent losses.
This bullish scenario would likely be fueled by a positive catalyst, such as favorable economic data or dovish comments from the Federal Reserve, which the market is currently anticipating. A successful break and retest of 23,515.6 would serve as a key entry signal for buyers aiming for higher levels.
Key Contextual Factors
Recent economic data and Federal Reserve policy expectations are likely to be major drivers for the Nasdaq's next move. As of early September, a rate cut by the Federal Reserve is heavily priced in, with some analysts predicting a move in the upcoming FOMC meeting. Any surprises to this expectation, either in a more hawkish or unexpectedly dovish direction, could trigger significant volatility. The tech heavy Nasdaq is particularly sensitive to interest rate policy, as it impacts company valuations and financing.
Summary and Outlook
Nasdaq 100 is at a pivotal point. The price is currently trapped between the 23,515 resistance and the 23,331 support.
* Bearish Trigger: A sustained break below 23,331.4 could lead to a test of the 23,000-22,900 support zone.
* Bullish Trigger: A decisive break above 23,515.6 could target the 23,757 resistance.
Given the recent price action and broader market uncertainty, the immediate risk appears to be to the downside. However, the market's direction will be confirmed by which of these critical levels is breached first.

NASDAQ holding the 4H MA200 can initiate the next rally.Nasdaq (NDX) has been trading within a Channel Up since mid May and currently is consolidating on its 4H MA200 (orange trend-line). Based on the 4H RSI we might be on a similar Higher Low as on May 30, having previously made a Channel Up bottom near the 1D MA50 (red trend-line).
The Bullish Leg that followed this Low was +6.80%, so we have our Target tailored on it at 24500.
-------------------------------------------------------------------------------
** Please LIKE 👍, FOLLOW ✅, SHARE 🙌 and COMMENT ✍ if you enjoy this idea! Also share your ideas and charts in the comments section below! This is best way to keep it relevant, support us, keep the content here free and allow the idea to reach as many people as possible. **
-------------------------------------------------------------------------------
💸💸💸💸💸💸
👇 👇 👇 👇 👇 👇

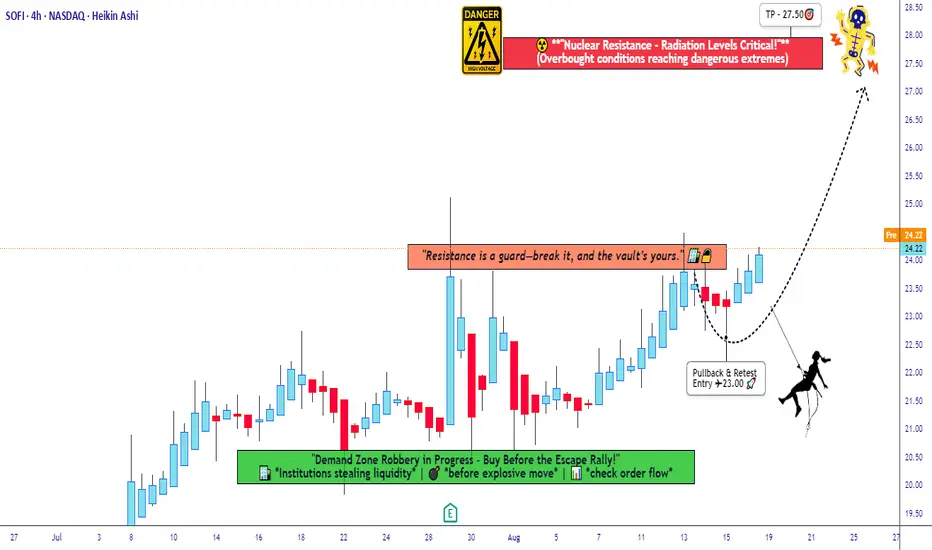
Breaking the Vault: SOFI Bullish Heist Plan Unlocked!🚨💼 SOFI Technologies Stock Heist Plan (Swing Trade) 💼🚨
Dear Robbers, Hustlers & Thief OG’s 🏴☠️💰
This time the target vault is none other than SoFi Technologies, Inc. (SOFI) 📈.
We’re planning a BULLISH STOCK HEIST with a layered entry strategy – the Thief’s signature move.
🕵️ Entry Plan
The heist doors open at ANY price level 🚪💥.
But remember… a real Thief never enters with one strike – we layer in with multiple limit orders (DCA style).
💎 Buy limit layers: 24.00 – 23.50 – 23.00 (you can increase your own layers if greedy 😈).
🛑 Thief Stop Loss (SL)
This is the escape hatch 🚨 – SL @ 22.00.
⚠️ Adjust your SL depending on your risk appetite, capital, and strategy.
(Every Thief OG has their own exit route 🏃💨).
🎯 Target – The Loot!
💥 Heavy resistance (electric fence ⚡) is spotted around 28.00.
So we aim to secure our stolen profits and escape clean at 27.50.
Don’t be greedy – once the vault is cracked, take the bag and RUN 🤑💼.
📢 Final Words from the Thief
Trading is a heist – not every move is safe, but every plan has an escape.
Stick to the layers, respect the SL, and collect the loot at target 🎯.
💖 Smash that BOOST if you’re part of the Thief gang 🔥💼
Let’s rob Wall Street together, one trade at a time 🚀🏴☠️
NAS100 - Trade Setup📊 NAS100USD – Multi-Timeframe Outlook
🔎 Monthly (1M)
Price moving inside a bullish wedge structure, with resistance tested near 25,200.
Support trendline holding firm, confirming strong macro bullish pressure.
Larger structure suggests Wave (5) still has room to expand toward 26,000+ if demand zones continue to hold.
🕰 Weekly (1W)
Elliott count clear: (1) → (2) → (3) extended, now correcting into (4).
Demand/FVG zones around 20,400 – 21,000 remain the critical swing support.
Next wave (5) projection aims at 25,000 – 26,000.
⏱ Daily (1D)
Structure consolidating within daily support, reacting from demand.
Breakout above 23,900 – 24,000 reactivates bullish impulse.
Invalidation lies below 22,950, where daily demand would fail.
⏳ 4H
Clear corrective retracement into daily demand (23,200 zone).
Long setup forming:
Entry: 23,222
Stop: 22,942
Target: 23,989
R:R ≈ 2.75
Short-term price action likely resolves higher into Wave (5) unless invalidation breaks.
🎯 Trade Plan
Bias: Bullish continuation into Wave (5)
Entry Zone: 23,200 – 23,300 (daily demand)
Targets: 23,989 (short-term), 25,200 – 26,000 (swing)
Invalidation: Daily close below 22,950

NASDAQ at Record Highs after US CPI report, but can it last?In today’s video, we break down the major market moves triggered by the July US CPI report. Headline CPI rose 0.2% month-over-month—right in line with expectations and a slowdown from the previous month. Year-over-year, headline inflation came in at 2.7%, just under the 2.8% forecast, while Core CPI rose 0.3% MoM (matching forecasts) but was a bit hotter at 3.1% YoY (vs. 3.0% expected).
These “not as bad as feared” inflation numbers kept hopes alive for a September Fed rate cut, pushing the odds of a cut to 96%. Markets responded strongly: the NASDAQ 100 closed at a record high, just shy of the 24K handle, with broad gains in tech and communication stocks, as traders bet on a more dovish Fed.
We also cover the technical setup for the NASDAQ 100 and key risk factors heading into the second part of August.
This content is not directed to residents of the EU or UK. Any opinions, news, research, analyses, prices or other information contained on this website is provided as general market commentary and does not constitute investment advice. ThinkMarkets will not accept liability for any loss or damage including, without limitation, to any loss of profit which may arise directly or indirectly from use of or reliance on such information.

NAS100 - Stock Market, in the Work Week!The index is below the EMA200 and EMA50 on the four-hour time frame and is in its short-term descending channel. If this channel is maintained and the specified range is reached, a close sale can be made with a suitable reward.
Economists anticipate that customs tariffs will push consumer prices higher while slowing economic growth in the coming months. Inflation is expected to accelerate, though not to the extreme levels of the 1970s when the term “stagflation” was coined to describe the combination of high inflation and economic stagnation. Unlike a recession—where the economy contracts and prices fall—stagflation features rising prices despite economic weakness. The U.S. economy could be heading toward a 1970s-style stagflationary environment, though analysts believe this time it will be far less severe.
Many experts argue that the U.S. is on the verge of a period of sluggish growth paired with accelerating inflation. The root cause lies in President Donald Trump’s tariffs, which simultaneously raise consumer costs and weigh on the labor market. However, economists expect this inflationary wave to be much milder than the double-digit annual increases that strained household budgets in the 1970s.
On the corporate front, Nvidia released its second-quarter earnings last week. Revenue reached $46.7 billion, exceeding analysts’ expectations of $46.23 billion. The company’s data center unit—the main growth driver—generated $41.1 billion, slightly below the $41.29 billion forecast. Adjusted earnings per share came in at $1.05, while the adjusted gross margin stood at 72.7%.
Looking ahead, Nvidia projected third-quarter revenue of around $54 billion, with a margin of error of plus or minus 2%. Its board also approved an additional $60 billion share repurchase program. Regarding China, the company reported zero sales of H20 chips to Chinese clients during Q2 and stated that no shipments are planned for that market in the near future.
In the earnings call, CEO Jensen Huang emphasized that the Chinese market could present a $50 billion opportunity for Nvidia this year. He estimated annual growth in China at nearly 50%, noting that the country is the world’s second-largest computing market and home to half of global AI researchers. Huang stressed that maintaining a presence in China is vital for the company’s long-term future, even amid ongoing political and trade tensions between Washington and Beijing.
On the monetary policy side, UBS warned that weakening the independence of the Federal Reserve—especially following Trump’s threat to remove Fed board member Lisa Cook—could have significant economic consequences. In its analysis of Jerome Powell’s speech at the Jackson Hole symposium, UBS described it as “classic Powell”: hinting at the possibility of a September rate cut to offset tariff effects but lacking a broader long-term framework for the evolving economy.
UBS emphasized that failure to strongly defend Fed independence could heighten political risks and destabilize markets.The bank warned that if the central bank comes under political influence, potential outcomes include the reemergence of inflationary instability, a one-percentage-point increase in real borrowing costs, and negative effects on fiscal policy, corporate investment, housing affordability, household savings, and speculative activity.
This week begins with one fewer trading day due to the Labor Day holiday, yet the economic calendar remains packed, with the labor market at the center of attention. On Tuesday, the ISM Manufacturing PMI for August will be released, followed by the JOLTS job openings report on Wednesday.
Thursday will be particularly important, bringing the August ADP private payrolls report, weekly jobless claims, and the ISM Services Index—all at once. These data points are especially significant given the recent large revisions to the Nonfarm Payrolls (NFP) report, which have renewed focus on the degree of convergence or divergence between ADP and NFP figures.
Historically, ADP and NFP reports have often diverged, leaving traders mispositioned when relying too heavily on ADP data. A recent example occurred in July, when ADP reported a decline of 33,000 jobs, while NFP the following day showed a gain of 147,000—well above expectations of 110,000. However, after NFP revisions, the actual trend proved more consistent with ADP’s numbers.
The most important event of the week will take place on Friday: the release of the August U.S. Nonfarm Payrolls report. Investors will be monitoring it closely, as any signs of labor market weakness could reinforce expectations for a Fed rate cut in mid-September.
Despite growing stagflation risks and heightened market volatility, Bank of America (BofA) suggested that autumn could be an attractive entry point for bullish investors. The bank cautioned that while volatility may exert short-term downward pressure, potential pullbacks could serve as buying opportunities.
The VIX volatility index fell to its lowest level of the year following Powell’s dovish remarks at Jackson Hole. Still, concerns about stretched stock valuations, a potential AI-driven bubble, and political risks tied to Fed independence suggest that this calm may not last.
NQ - Nasdaq Short Playbook for the next weeksIn the NQ, they took out the high and then hit it on the head day by day. It finally stopped below the 1/4 line. If you look closely, you see that this was the slanted zone of Support — just like the slanted Resistance.
"As above, so below."
...write me in the comments who said this already a couple hundred years ago §8-)
The small Modified Schiff Fork tells a story too.
Price reached the Center Line and got rejected. Now it's on its way down towards the small Fork's L-MLH. A break of it would indicate further selling ahead.
And the last bastion is the green support level, which stems from the second-to-last prior confirmed Swing Low.
Beyond this level, it's only a question of time before price hits the Center Line.
And — God forbid — below the Center Line, the Sh...t hits the fan. So you better run... behind price with a decent short trade and ride it down to the Abyss.
No worries, I'm with you §8-)
Happy Monday, folks!

Nasdaq Buy ZoneThe Nasdaq has remained strong, but I am not looking to initiate any longer term longs until we can pull back into our buy zone, highlighted in green. If we hold that zone our next push is to the Fibonacci extensions above.

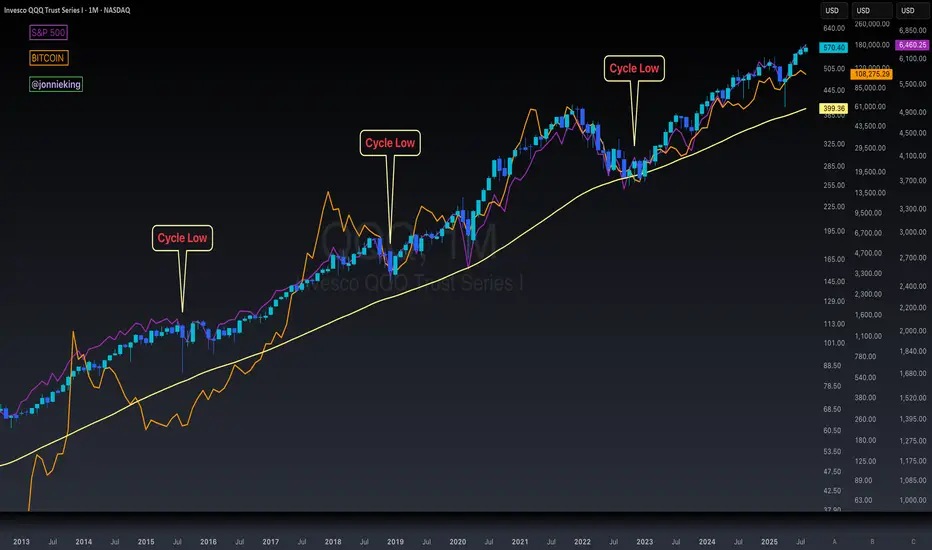
$BTC 4-Year Cycle Is NOT Dead According to $QQQ $SPXIt’s really weird cause everyone keeps telling me the ₿itcoin 4-year cycle is dead yet Nasdaq and S&P 500 follow nearly the exact same pattern with cycle lows 🤓
It’s almost as-if monetary and fiscal policy creates this boom and bust cycle every 4-years 🤔
Question for the “this time is different people”….
Will NASDAQ:QQQ and SP:SPX not have similar bear markets as we’ve seen in the past along with CRYPTOCAP:BTC ?
AFRM - NEW 52-WEEK HIGHAFRM - CURRENT PRICE :88.46
AFRM made a new 52-week high last Friday with burst in trading activity. The 52-week high resistance level near 82.00 - 83.00 is considered significant resistance level based on the share price history as it had been touched several times. One of the bullish signs for this stock is that the RSI is moving above 50 level steadily since 27 May 2025 - look at the red circle. Take note also that there is a rising support line - indicating demand is getting higher. There is possibility that the stock may trend higher in near term.
ENTRY PRICE : 83.00 - 89.00
TARGET : 97.00 and 104.00
SUPPORT : 78.00
Notes : For chart pattern lovers, look at the heliview chart (bigger picture). There is a CUP & HANDLE pattern !

NASDAQ Pullback Toward 23,160 as Index Holds UptrendHey Traders, in tomorrow's trading session we are monitoring NASDAQ for a buying opportunity around the 23,160 zone. NAS100 is trading in an uptrend, with price currently correcting toward this key support/resistance level.
Structure: The broader bias remains bullish, but price is pulling back after recent highs.
Key level in focus: 23,160 — a significant area where buyers may look to step in and resume the uptrend.
Fundamentals: Market sentiment remains supportive for equities, with U.S. data and Fed expectations keeping risk appetite intact. Any continuation of dovish Fed signals would add fuel to bullish NASDAQ momentum.
Trade safe,
Joe.

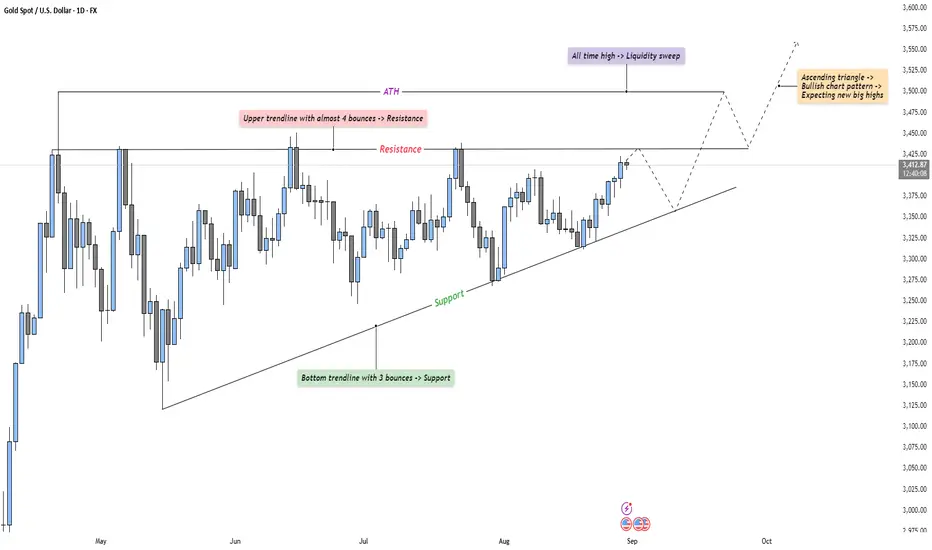
GOLD - Ascending Triangle into new All Time HighMarket Context
Gold has been steadily climbing, forming an ascending triangle pattern over the past few months. Buyers continue to defend higher lows, while sellers repeatedly reject price near resistance. This type of structure often signals building pressure, with volatility likely to expand once a breakout occurs.
Consolidation Phase
The range between the ascending support trendline and the horizontal resistance has created a textbook consolidation. Each bounce off support shows accumulation, while the repeated touches of resistance highlight where liquidity is building. The longer price compresses within this pattern, the more explosive the eventual breakout is expected to be.
Bullish Breakout Scenario
If price manages to break above resistance and sweep the all-time high, it would likely trigger a wave of liquidity from trapped shorts and breakout buyers entering. This move could fuel momentum into fresh price discovery, validating the ascending triangle as a bullish continuation pattern. The sweep of liquidity above ATH could serve as the catalyst for acceleration toward new highs.
Bearish Retest Scenario
On the other hand, if resistance holds once again, a deeper retracement back toward the ascending trendline is likely. This would test the conviction of buyers and determine whether the trendline support continues to act as the foundation for the structure. A clean break below support would weaken the bullish outlook and signal a potential shift in momentum.
Final Words
Patience here is key — ascending triangles often test traders’ resolve before making their decisive move. Let the market reveal its hand before committing to either direction.
If you found this breakdown helpful, a like would be much appreciated! Drop a comment and let me know: are you expecting the breakout to bring new highs, or do you see sellers defending this level once again?
NAS100 Technical Analysis Report - NASDAQ & US Market# NAS100 Technical Analysis: NASDAQ Comprehensive Multi-Timeframe Trading Strategy
Executive Summary
Current Price: 23,415.0 (August 30, 2025, 12:54 AM UTC+4)
Market Sentiment: Cautiously Bullish with Rate Cut Optimism
Primary Trend: Uptrend with consolidation characteristics
Key Catalyst: Fed Chair Powell's Jackson Hole speech signaling potential September rate cut
The NASDAQ-100 continues to demonstrate resilience following Fed Chair Jerome Powell's dovish signals at Jackson Hole, with markets pricing in high probability of September rate cuts. The index benefits from renewed optimism in technology sectors and artificial intelligence themes, though elevated valuations warrant selective positioning.
Market Context & Fundamental Backdrop
Federal Reserve Policy Outlook
Following Powell's Jackson Hole speech, markets have significantly increased bets on a September rate cut. The Fed Chair indicated that "conditions may warrant" interest rate cuts, with the balance of risks to employment and inflation shifting. Current federal funds rate remains at 4.25%-4.50%, but CME FedWatch Tool shows high probability of cuts beginning in September 2025.
Economic Environment
The US economy has shown resilience despite policy uncertainties, with the dual mandate of the Fed becoming more balanced. Labor market data shows some "unusual" behavior that could become concerning, supporting the case for monetary policy adjustment.
Technology Sector Dynamics
The artificial intelligence boom remains robust, providing fundamental support for NASDAQ constituents. However, chipmaker volatility has created intermittent pressure on the index, requiring careful sector rotation analysis.
Market Performance Context
Recent trading sessions have shown volatility, with the NASDAQ experiencing both significant gains and pullbacks. The index closed at 21,449.29 in late August trading sessions, demonstrating the current consolidation phase around elevated levels.
Technical Analysis Framework
Japanese Candlestick Analysis
Weekly Pattern: Long-legged doji formation indicating indecision at current levels
Daily Pattern: Inside bar sequences suggesting consolidation before next major move
Intraday Patterns: Morning star and evening star formations frequent in 4H timeframe
Volume Analysis: Average volume during recent consolidation phase
Elliott Wave Analysis
Primary Wave Structure:
Major Degree: Wave 5 of secular bull market potentially in final stages
Intermediate Degree: Subwave 5 of major Wave 5 showing extension characteristics
Minor Degree: Currently in subwave 4 correction within intermediate Wave 5
Wave Count Analysis:
Impulse Wave: Completed from 2020 lows to recent highs
Corrective Phase: Current consolidation representing Wave 4 of larger structure
Target Projection: Wave 5 completion targeting 25,000-26,000 zone
Critical Levels: Wave 4 support at 22,800-23,200 maintains bullish count
Harmonic Pattern Recognition
Active Harmonic Structures:
Bullish Cypher Pattern: Potential completion at 22,900-23,100 zone
ABCD Extension: Current formation targeting 24,200-24,500
Potential Bearish Gartley: Formation risk above 24,800 indicating reversal
Fibonacci Confluence Analysis:
- 61.8% retracement of major swing: 23,150
- 50% retracement level: 23,400 (current area of interest)
- 38.2% retracement: 23,650
- 1.618 extension target: 24,300-24,500
Wyckoff Method Analysis
Phase Assessment: Accumulation Phase D - Testing resistance
Market Structure:
- Sign of Strength (SOS) evident on rate cut optimism
- Last Point of Support (LPS) established around 23,000
- Backup to Edge of Creek (BUE) tests showing institutional accumulation
- Spring action potentially completed in August lows
Composite Operator Activity: Evidence of large player accumulation during recent weakness
W.D. Gann Technical Analysis
# Square of 9 Application
Current Position: 23,415.0 = 152.98° on the Gann wheel
Critical Resistance Levels:
- 23,409 (153°) - immediate geometric resistance
- 23,716 (154°) - intermediate resistance zone
- 24,025 (155°) - major resistance confluence
Key Support Levels:
- 23,104 (152°) - immediate geometric support
- 22,801 (151°) - strong support zone
- 22,500 (150°) - major psychological and geometric support
# Time Theory Application
Critical Time Cycles:
- September 3-6: 90-degree time angle from recent high
- September 21: Autumn equinox - natural market turning point
- October 12-15: 144-degree time cycle completion
- November 2-8: 180-degree cycle from major low
# Price and Time Squaring Analysis
Square Root of Price: √23,415.0 = 152.98
Next Significant Square Levels:
- 154² = 23,716 (key resistance zone)
- 155² = 24,025 (intermediate target)
- 156² = 24,336 (extended resistance)
- 160² = 25,600 (long-term target)
Support Square Levels:
- 152² = 23,104 (immediate support)
- 151² = 22,801 (strong support)
- 150² = 22,500 (major support)
# Gann Angle Analysis
Primary Angles from Major Low:
- 1x1 Angle: Providing dynamic support around 23,200
- 2x1 Angle: Resistance trend line near 23,800
- 1x2 Angle: Long-term support at 22,600
Ichimoku Kinko Hyo Analysis
Cloud Configuration:
Tenkan-sen (9): 23,425 - Price slightly below, neutral bias
Kijun-sen (26): 23,380 - Price above, mild bullish confirmation
Senkou Span A: 23,402 (cloud top)
Senkou Span B: 23,150 (cloud bottom)
Chikou Span: Above price action 26 periods ago (bullish)
Assessment: Price trading at cloud top resistance with mixed signals requiring breakout confirmation for directional clarity.
Multi-Timeframe Technical Indicator Analysis
5-Minute Chart (Scalping Focus)
RSI(14): 51.3 - Neutral territory with slight bullish bias
VWAP: 23,408 - Price oscillating around VWAP equilibrium
Bollinger Bands: Middle band at 23,410, bands contracting (low volatility environment)
Stochastic: 48.2 in neutral zone
Volume: Below average, typical for consolidation phase
Key Scalping Levels:
Micro Resistance: 23,435, 23,460, 23,485
Micro Support: 23,390, 23,365, 23,340
15-Minute Chart (Scalping Focus)
MACD: Histogram near zero line, momentum neutral
Williams %R: -52% indicating no extreme conditions
Moving Averages: EMA(20) converging with SMA(20) around 23,400
Volume Profile: High volume node at 23,380-23,430
Scalping Strategy Levels:
Long Bias Zone: 23,385-23,405
Short Bias Zone: 23,445-23,465
Breakout Alerts: Above 23,480 (bullish) / Below 23,360 (bearish)
1-Hour Chart (Day Trading)
RSI(14): 54.7 - Slight bullish momentum without overbought conditions
VWAP: 23,395 providing dynamic support
ADX(14): 28.3 indicating moderate trend strength
Parabolic SAR: Below price at 23,350 (bullish signal)
Day Trading Framework:
Primary Resistance: 23,500-23,550
Secondary Resistance: 23,650-23,700
Primary Support: 23,250-23,300
Secondary Support: 23,100-23,150
4-Hour Chart (Swing Trading)
RSI(14): 58.9 in bullish territory but not overbought
MACD: Positive momentum with slight bullish divergence forming
Bollinger Bands: Price near upper band, expansion needed for continuation
Ichimoku: Price at cloud resistance requiring break for bullish confirmation
Swing Trading Levels:
Key Resistance Zone: 23,700-23,800
Breakout Target: 24,000-24,200 on sustained break
Support Structure: 23,200-23,300
Stop Loss Consideration: Below 23,100 invalidates bullish structure
Daily Chart (Position Trading)
RSI(14): 61.4 showing healthy bullish momentum
MACD: Positive with momentum building
Volume: Consolidation pattern with average participation
Moving Averages: All major MAs (20, 50, 100, 200) aligned bullishly
Position Trading Analysis:
Triangle Pattern: Ascending triangle formation approaching apex
Breakout Targets: 24,500-25,000 on upside resolution
Support Defense: 23,000-23,200 critical for trend continuation
Time Factor: Resolution expected within 2-3 weeks
Weekly Chart (Long-term Analysis)
RSI(14): 65.8 approaching overbought but sustainable
MACD: Strong positive momentum with room for extension
Long-term Trend: Powerful uptrend since 2020 lows intact
Major Resistance: 25,000-25,500 psychological zone
Monthly Chart (Strategic View)
RSI(14): 71.2 significantly overbought (caution warranted)
Long-term Structure: Multi-year cup and handle completion
Secular Target: 28,000-30,000 based on pattern measurement
Major Support: 20,000-21,000 long-term trend support
Comprehensive Support and Resistance Analysis
Primary Support Structure
1. 23,380-23,420: Kijun-sen and VWAP confluence (immediate)
2. 23,300-23,350: Previous consolidation zone with volume
3. 23,200-23,250: Triangle support and trend line confluence
4. 23,100-23,150: Cloud bottom and Fibonacci support
5. 23,000-23,050: Major psychological level and institutional interest
6. 22,800-22,900: Elliott Wave 4 support and harmonic completion
7. 22,500-22,600: Extended support and Gann square level
Primary Resistance Structure
1. 23,450-23,480: Immediate intraday resistance
2. 23,550-23,600: Short-term resistance and previous reaction high
3. 23,700-23,750: Triangle resistance and Gann confluence
4. 23,900-24,000: Intermediate resistance and psychological level
5. 24,200-24,300: Major resistance zone and measured targets
6. 24,500-24,700: Extended targets and harmonic projections
7. 25,000-25,200: Major psychological resistance and long-term targets
Weekly Trading Strategy (September 2-6, 2025)
Monday, September 2, 2025 (Labor Day - US Markets Closed)
Market Environment: Limited trading due to US holiday
Strategy Focus: Pre-positioning for Tuesday's resumed activity
International Markets: Monitor for any overnight developments
Pre-Market Analysis:
Gap Scenarios: Assess any gap formation from Friday's close
Global Sentiment: Monitor Asian and European markets for cues
News Flow: Fed speakers or economic data releases
Tuesday, September 3, 2025
Market Environment: Resumption of full trading after holiday
Primary Strategy: Range trading with breakout preparation
Volatility Expectation: Above average due to holiday catch-up
Intraday Trading Strategy:
Opening Range: 23,350-23,480 expected
Long Setup: 23,380-23,400
- Stop Loss: 23,350
- Target 1: 23,450 (1:2 R/R)
- Target 2: 23,500 (1:3.5 R/R)
Short Setup: 23,460-23,480
- Stop Loss: 23,510
- Target 1: 23,400 (1:1.2 R/R)
- Target 2: 23,350 (1:2.2 R/R)
Key Levels to Watch:
Breakout Above: 23,500 targets 23,600-23,650
Breakdown Below: 23,320 targets 23,250-23,200
Wednesday, September 4, 2025
Market Environment: Mid-week momentum potential
Primary Strategy: Trend following with momentum confirmation
Focus: Economic data and Fed speakers impact
Trading Approach:
Bullish Scenario: Break above 23,500 with volume
- Entry: 23,510-23,530
- Stop: 23,450
- Targets: 23,600, 23,700, 23,800
Bearish Scenario: Break below 23,300 with momentum
- Entry: 23,290-23,270
- Stop: 23,330
- Targets: 23,200, 23,100, 23,000
Risk Management: Reduce position sizes by 30% if range-bound continues
Thursday, September 5, 2025
Market Environment: Potential high-volatility day
Primary Strategy: Breakout trading with volume confirmation
Critical Factor: Triangle pattern resolution expected
Triangle Breakout Strategy:
Upside Breakout: Above 23,650
- Volume Requirement: 150% of 20-day average
- Initial Target: 23,800-23,850
- Extended Target: 24,000-24,200
- Stop Loss: 23,550
Downside Breakdown: Below 23,200
- Volume Requirement: 130% of 20-day average
- Initial Target: 23,000-22,950
- Extended Target: 22,800-22,700
- Stop Loss: 23,280
Position Management:
- Scale into positions on confirmed breakouts
- Trail stops aggressively after first target achieved
- Monitor sector rotation for continuation signals
Friday, September 6, 2025
Market Environment: Week-end positioning and profit-taking
Primary Strategy: Consolidation trading and weekly close analysis
Focus: Jobs data potential and weekly settlement
End-of-Week Strategy:
Weekly Close Bullish: Above 23,500 sets up next week advance
Weekly Close Neutral: 23,300-23,500 maintains current pattern
Weekly Close Bearish: Below 23,300 suggests pattern failure
Day Trading Approach:
Morning Session: Follow Thursday's breakout direction
Midday: Range trading within established boundaries
Final Hour: Position adjustments for weekend risk
Non-Farm Payrolls Impact:
Strong Data: Could delay Fed cuts, potential market negative
Weak Data: Supports Fed cut narrative, likely market positive
In-Line Data: Maintains current rate cut expectations
Advanced Risk Management Framework
Position Sizing Matrix
Risk Allocation by Timeframe:
5M Scalping: 0.25-0.5% of capital per trade
15M Scalping: 0.5-0.75% of capital per trade
1H Day Trading: 1-1.5% of capital per trade
4H Swing Trading: 1.5-2.5% of capital per trade
Daily Position Trading: 2.5-3.5% of capital per trade
Dynamic Stop Loss Framework
Volatility-Adjusted Stops:
Low Volatility (<1% ATR): Stops at 0.75% of entry
Medium Volatility (1-2% ATR): Stops at 1.25% of entry
High Volatility (>2% ATR): Stops at 2% of entry
Timeframe-Specific Stops:
5-Minute Charts: 40-60 points maximum
15-Minute Charts: 80-120 points maximum
1-Hour Charts: 150-250 points maximum
4-Hour Charts: 300-450 points maximum
Daily Charts: 600-900 points maximum
Profit-Taking Methodology
Systematic Profit Realization:
First Target (40%): 1:1.5 Risk/Reward ratio
Second Target (35%): 1:2.5 Risk/Reward ratio
Third Target (25%): 1:4+ Risk/Reward ratio
Trailing Implementation: After second target achievement
Maximum Exposure Limits
Daily Risk Limits:
Total Portfolio: Maximum 5% risk across all positions
Single Strategy: Maximum 3% risk concentration
Sector Concentration: Maximum 40% in tech-related trades
Emergency Stop: -2% daily account drawdown triggers cessation
Geopolitical and Economic Risk Assessment
Federal Reserve Policy Impact
September FOMC Meeting: High probability of 25bp rate cut based on recent communications
Policy Path: Markets pricing 2-3 cuts through end of 2025
Communication Risk: Any hawkish surprises could trigger sharp correction
Independence Concerns: Political pressure on Fed policy creates uncertainty
Economic Data Dependencies
Labor Market: "Unusual" behavior noted by Powell requires monitoring
Inflation Trends: Sticky services inflation remains concern
GDP Growth: Resilience continues but tariff impacts uncertain
Consumer Spending: Holiday season performance critical for Q4
Geopolitical Considerations
Trade Policy: Tariff implementation timeline and magnitude
China Relations: Technology sector exposure to policy changes
Energy Security: Minimal direct impact on NASDAQ constituents
Dollar Dynamics: Strength/weakness affecting multinational earnings
Technology Sector Risks
AI Regulation: Potential oversight affecting major constituents
Semiconductor Cycle: Global chip demand and supply chain risks
Cybersecurity: Increasing threat landscape affecting valuations
Competition: Antitrust scrutiny on major tech platforms
Sectoral Analysis and Rotation Themes
NASDAQ 100 Sector Breakdown
Technology (45%): Apple, Microsoft, NVIDIA, Meta driving performance
Communication Services (15%): Google, Netflix, streaming platforms
Consumer Discretionary (12%): Amazon, Tesla leading components
Healthcare (8%): Biotech and medical device innovation
Other Sectors (20%): Diversified exposure across growth themes
Current Outperformers
1. Artificial Intelligence: NVIDIA, Microsoft, Google benefiting from AI boom
2. Cloud Computing: Amazon Web Services, Microsoft Azure expansion
3. Digital Advertising: Meta, Google capturing online spending shift
4. Electric Vehicles: Tesla maintaining technological leadership
Underperforming Areas
1. Traditional Software: Legacy platforms facing cloud migration pressure
2. Hardware Manufacturers: Margin pressure from supply chain costs
3. Streaming Services: Subscriber growth saturation concerns
4. Biotech: Regulatory approval timelines creating uncertainty
Rotation Indicators
Growth vs Value: Quality growth at reasonable prices favored
Large Cap vs Small Cap: Mega-cap technology leadership maintained
Secular vs Cyclical: Long-term secular themes outperforming cycles
Advanced Pattern Recognition and Trading Setups
Ichimoku-Based Strategies
Cloud Breakout Setup:
Bullish Signal: Price above cloud with Tenkan above Kijun
Entry: Break above 23,450 with volume confirmation
Stop: Below cloud at 23,150
Target: Measured move to 24,200-24,500
Kijun-sen Bounce:
Setup: Price return to Kijun-sen (23,380) with support
Entry: Bounce confirmation above 23,400
Stop: Below 23,350
Target: Previous high resistance at 23,650
Gann-Based Trading Approaches
Square of 9 Methodology:
Long Trades: Buy at 152° (23,104) targeting 154° (23,716)
Short Trades: Sell at 154° (23,716) targeting 152° (23,104)
Breakout Trades: Above 154° targets 155° (24,025)
Time Cycle Trading:
Major Turns: September 21 equinox reversal window
Minor Cycles: 90-degree angles creating intraweek pivots
Momentum Confirmation: Volume spikes during cycle completions
Wyckoff Accumulation/Distribution
Phase D Characteristics:
Testing Supply: Price probing resistance without heavy volume
Institutional Activity: Large lot accumulation on weakness
Markup Preparation: Successful tests lead to significant advances
Distribution Warning Signs:
Climactic Volume: Heavy selling on any approach to 25,000
Weakness Signs: Unable to hold gains on good news
Phase A Risk: Sharp reversal from resistance levels
Market Microstructure and Execution Considerations
High-Frequency Trading Impact
Algorithm Activity Zones:
23,000 Level: Heavy HFT support algorithm activity
23,500 Level: Resistance algorithm concentration
24,000 Level: Major psychological algorithm participation
Optimal Execution Windows:
9:30-10:00 EST: Maximum volatility and opportunity
11:00-11:30 EST: Mid-morning momentum continuation
14:30-15:00 EST: European close overlap activity
15:30-16:00 EST: Final hour positioning
Liquidity Considerations
High Liquidity Zones: 23,300-23,500 range with tight spreads
Reduced Liquidity: Above 24,000 and below 23,000 requiring careful sizing
After-Hours Trading: Limited liquidity requiring smaller position sizes
Order Flow Analysis
Institutional Patterns:
Accumulation: Evidence of large block buying 23,200-23,400
Distribution Zones: Monitor for heavy selling above 23,700
Momentum Algorithms: Active participation on breakout moves
Technology Integration and Trading Tools
Essential Trading Platforms
1. TradingView: Comprehensive charting with advanced indicators
2. Think or Swim: Professional-grade execution and analysis
3. Interactive Brokers: Direct market access and low commissions
4. Bloomberg Terminal: Institutional-grade data and news flow
Critical Alert Systems
Price-Based Alerts:
- Triangle breakout: 23,650 (bullish) / 23,200 (bearish)
- Psychological levels: 23,500, 24,000, 24,500
- Gann squares: 23,104, 23,716, 24,025
Volume-Based Alerts:
- Unusual volume spikes (>200% of 20-day average)
- Block trade notifications (>$10M trades)
- Dark pool activity indicators
News and Event Alerts:
- Fed speaker comments and policy communications
- Economic data releases (employment, inflation, GDP)
- Earnings announcements from major NASDAQ constituents
- Geopolitical developments affecting technology sector
Advanced Analysis Tools
Options Flow: Monitor unusual options activity for directional clues
Futures Positioning: Track institutional positioning in NQ futures
Sector Rotation: Monitor NASDAQ sector ETF performance relative to index
International Correlation: Track correlation with technology indices globally
Seasonal and Calendar Considerations
September Seasonality
Historical data shows September as traditionally weak month for equities, though technology sectors often show resilience. Current rate cut optimism may override seasonal weakness.
Federal Reserve Calendar
September 17-18: FOMC Meeting (high probability of rate cut)
October 29-30: Next FOMC Meeting
December 17-18: Final 2025 FOMC Meeting
Earnings Season Timeline
Q3 2025 Reporting: October-November period critical for NASDAQ constituents
Key Companies: Apple, Microsoft, NVIDIA, Google, Amazon reporting impact
Guidance Focus: AI spending, cloud growth, consumer demand trends
Holiday Impact Calendar
Labor Day (Sep 2): US markets closed
Columbus Day (Oct 14): Bond markets closed, equities open
Thanksgiving (Nov 27-28): Shortened trading sessions
Christmas/New Year: Year-end positioning effects
Conclusion and Strategic Outlook
The NASDAQ-100 stands at a critical inflection point, benefiting from Fed Chair Powell's dovish pivot while facing elevated valuation concerns and seasonal headwinds. The technical picture presents a compelling consolidation pattern with multiple breakout scenarios, requiring careful risk management and tactical positioning.
Key Investment Themes for September:
1. Fed Policy Pivot: Rate cut cycle beginning supports risk assets and growth stocks
2. AI Revolution Continuation: Technology leadership themes remain intact
3. Triangle Resolution: Current consolidation pattern approaching decision point
4. Seasonal Navigation: September weakness vs. Fed optimism dynamic
Tactical Trading Priorities:
Range Trading: Capitalize on 23,300-23,650 range until breakout
Breakout Preparation: Position for triangle resolution with volume confirmation
Risk Management: Elevated levels require disciplined position sizing
Sector Selection: Focus on AI beneficiaries and Fed-sensitive growth names
Medium-Term Outlook (1-3 Months):
The combination of Fed policy accommodation, robust AI/technology themes, and strong corporate fundamentals provides a constructive backdrop for NASDAQ advancement. Technical analysis suggests potential for significant upside toward 24,500-25,000 on successful breakout, though any hawkish Fed surprise or geopolitical shock could trigger sharp corrections.
Risk Scenario Analysis:
Bull Case: Fed cuts + AI momentum = targets 25,000-26,000
Base Case: Consolidation 23,000-24,000 through October
Bear Case: Fed disappointment + valuation concerns = correction to 21,500-22,000
Strategic Positioning Recommendations:
1. Maintain tactical long bias with disciplined risk management
2. Focus on high-quality technology leaders with AI exposure
3. Prepare for increased volatility around Fed meetings and earnings
4. Monitor triangle pattern resolution for significant directional moves
The multi-timeframe technical analysis framework presented provides robust tools for navigating the current market environment. Success will depend on maintaining discipline around the identified support/resistance levels while adapting to the evolving Fed policy landscape and technology sector dynamics.
Traders should remain flexible and prepared for both continuation and reversal scenarios, with particular attention to volume confirmation on any major breakout attempts. The convergence of technical patterns, fundamental catalysts, and seasonal factors creates a complex but opportunity-rich environment for skilled practitioners.
---
*This comprehensive analysis integrates multiple technical methodologies with current market fundamentals. All trading recommendations should be implemented within individual risk tolerance parameters and adapted to evolving market conditions. The technology-focused nature of the NASDAQ requires particular attention to sector-specific developments and regulatory considerations.*
---
For individuals seeking to enhance their trading abilities based on the analyses provided, I recommend exploring the mentoring program offered by Shunya Trade. (Website: shunya dot trade)
I would appreciate your feedback on this analysis, as it will serve as a valuable resource for future endeavors.
Sincerely,
Shunya.Trade
Website: shunya dot trade
---
Disclaimer: This post is intended solely for educational purposes and does not constitute investment advice, financial advice, or trading recommendations. The views expressed herein are derived from technical analysis and are shared for informational purposes only. The stock market inherently carries risks, including the potential for capital loss. Therefore, readers are strongly advised to exercise prudent judgment before making any investment decisions. We assume no liability for any actions taken based on this content. For personalized guidance, it is recommended to consult a certified financial advisor.
Nasdaq Pulls Back from Recent HighsToward the end of the week, the Nasdaq index began to retreat, posting a decline of at least 1.5% in the short term, as a new bearish bias has started to emerge strongly, preventing the index from reaching the historical highs again. For now, the momentum driven by expectations of lower interest rates has begun to fade in recent sessions, while corrections in stocks such as Nvidia—which represent a significant share of the index’s market capitalization—have limited buying pressure heading into the week’s close. Given this backdrop, as the market awaits key economic data, such as the upcoming U.S. employment report on Friday, uncertainty and sideways movements may continue to dominate trading sessions in the near term.
Short-Term Sideways Range
The lack of clear direction in recent movements has led to the formation of a sideways range in the Nasdaq, currently defined by resistance at 23,800 points and support at 22,800 points. As long as price action remains within these levels, neutrality will likely remain the prevailing scenario in the short term.
Technical Indicators
RSI: the RSI line is oscillating near the neutral 50 level, reflecting a consistent balance between buying and selling pressure over the past 14 sessions. This suggests that the neutral bias has begun to dominate short-term movements in the index.
MACD: the MACD histogram also hovers close to the 0 line, showing that short-term moving averages maintain a neutral bias. As long as this condition holds, the current sideways range is likely to remain relevant in upcoming sessions.
Key Levels to Watch:
23,800 points – Main Resistance: corresponds to recent highs in the Nasdaq. A sustained breakout above this level could open the door to a more consistent bullish trend in the short term.
22,800 points – Near-Term Support: aligns with the Ichimoku cloud and stands as the most important barrier for containing short-term downward corrections.
22,200 points – Critical Support: coincides with neutral price areas observed on the chart in February of this year and is also converging with the 200-period moving average. If this level comes under consistent pressure, it could pave the way for a more dominant bearish bias.
Written by Julian Pineda, CFA – Market Analyst

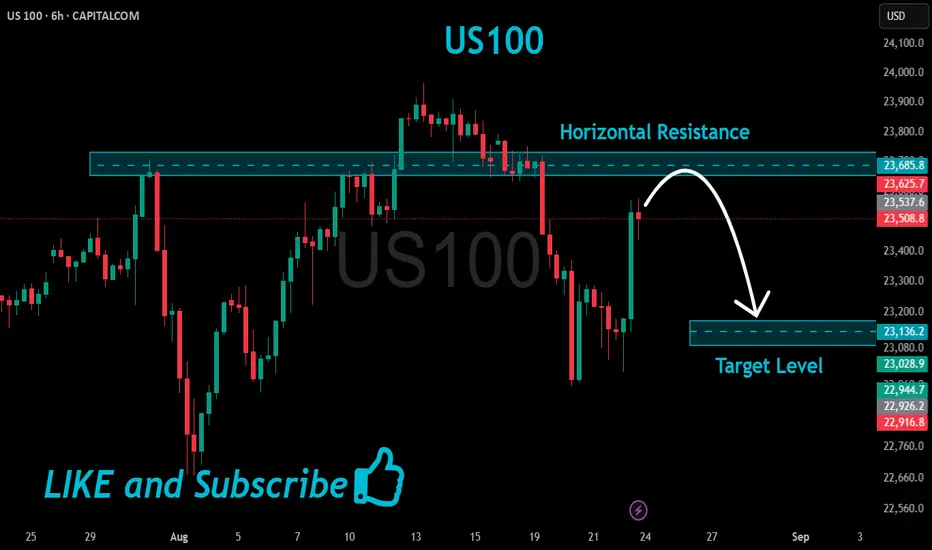
US100 Resistance Ahead!
HI,Traders !
#US100 is trading in an
Uptrend and Silver shot
Up sharply today and it
Is now locally overbought
So after the retest of the
Horizontal resistance above
At 23685.8 from where we
Will be expecting a local
Bearish move down!
Comment and subscribe to help us grow !
$LKQ — LKQ Corporation (NASDAQ:LKQ) August 27, 2025.NASDAQ:LKQ #LKQ — LKQ Corporation (NASDAQ:LKQ) Investment Analysis Report | Consumer Cyclical | Auto Parts | USA | NASDAQ | August 27, 2025.
Executive Summary
LKQ Corporation (NASDAQ: LKQ), a leading provider of alternative and specialty automotive parts, has seen notable insider buying activity in late August 2025, underscoring potential undervaluation amid a sector-wide slowdown.
On August 27, 2025, Director Andrew C. Clarke purchased 5,000 shares at $31.95 per share (total value $159,773), increasing his holdings to 21,172 shares.
Concurrently, President and CEO Justin L. Jude acquired 5,686 shares at $31.50 per share (total value $178,574), boosting his stake to 286,446 shares. These open-market buys follow a pattern of executive confidence, contrasting with prior sales by former directors.
Technical indicators point to a high-probability rebound from oversold conditions, with the stock at $32.08 exhibiting a potential bottoming formation on both daily and weekly charts, supported by stabilizing RSI and volume upticks. Q2 2025 earnings revealed revenue of $3.6 billion (down 1.9% YoY) but a slight net income increase, with strategic divestitures like the $410 million sale of the Self Service segment (announced August 26, 2025) aimed at simplifying operations and strengthening the balance sheet.
The auto parts sector faces headwinds from U.S. tariffs and sluggish demand, with projected 2025 U.S. vehicle sales declining 4-7%, yet LKQ's focus on aftermarket parts positions it for resilience.
Replicating the insiders' average entry at ~$31.73 suggests 20-50% upside potential over 3-6 months, targeting $38-$48, driven by divestiture proceeds and potential margin expansion.
With Zacks Rank equivalent to Buy and institutional accumulation, we rate LKQ as a moderate-conviction long, recommending 1-3% allocation for value-oriented portfolios amid cyclical risks.
Company Profile
LKQ Corporation is a global distributor of vehicle products, including replacement parts, components, and systems used in the repair and maintenance of vehicles. Operating through segments like Wholesale-North America, Wholesale-Europe, and Specialty, LKQ serves collision and mechanical repair shops, dealerships, and individual consumers via an extensive network of salvage yards and warehouses.
The company emphasizes sustainability through recycled and remanufactured parts, capitalizing on the growing aftermarket demand.
Key financial metrics as of August 27, 2025:
• Market Capitalization: $8.25 billion
• Enterprise Value: $13.91 billion (approx.)
• Earnings Date: 10/23/2025
• Put Call Ration: 0.03
• Put Volume: 20.00
• Call Volume: 718.00
• Insider Ownership: 0.69%
• Institutional Ownership: 106.51%
LKQ's strategy includes bolt-on acquisitions and operational efficiencies, with recent divestitures streamlining focus on core wholesale operations in a $300 billion global auto parts market.
Charts:
• (1D)
• (5D)
Insider Trades:
LKQ Ownership:
SEC From 4:
www.sec.gov
www.sec.gov
Insider Trading Context
Insider purchases in cyclical sectors like auto parts often signal undervaluation and anticipated recovery, particularly when executed by board members and executives with operational oversight.
The August 27, 2025, buys by Director Andrew C. Clarke (5,000 shares at $31.95) and President/CEO Justin L. Jude (5,686 shares at $31.50) total over $338,000 in value, occurring near multi-month lows and post-Q2 earnings. Clarke's transaction marks his first buy in 2025, while Jude's adds to prior accumulations.
This activity contrasts with earlier proposed sales by former Director Dominick P. Zarcone (e.g., 15,000 shares at $39.87 in June 2025), shifting net insider sentiment to positive. Year-to-date, insiders have net bought ~18,386 shares, valued at ~$638,464, excluding grants. Such clustered executive buying, especially post-divestiture announcements, suggests insiders view the current price as attractive, potentially anticipating margin improvements from the $410 million Self Service sale proceeds, which will reduce debt and fund growth.
Historically, similar patterns in auto parts stocks yield 15-25% outperformance over six months.
➖➖➖
Technical Analysis
The daily chart for LKQ illustrates a bearish-to-neutral transition, with price declining from $45 highs in April 2025 to $32.08 amid sector pressures, but showing early reversal signs for a high-probability (70-80%) short-term bounce. A descending channel dominates, with lower highs/lows, but recent candles form a potential double bottom near $30.50-$31.50, supported by a hammer on August 27 with 1.73 million volume—20% above average—indicating buying interest.
Key indicators:
• Moving Averages: Price below 20-day SMA ($30.59), 50-day SMA ($34.25), and 200-day SMA ($38.21), confirming downtrend; however, the 20-day is flattening, and a crossover above could signal reversal.
• Relative Strength Index (RSI, 14-period): At 50.11 (neutral), up from oversold <30 in July, with bullish divergence (higher RSI lows vs. price lows).
• MACD: Line at -0.85, signal at -1.02; histogram narrowing positively, hinting at momentum shift.
• Volume Trends: Declining during downswings but spiking on green days (e.g., +1.9% on August 27), supporting accumulation.
• Candlestick Patterns: Recent doji and hammers suggest indecision/resolution; breakout above $34 (channel upper) targets $38.
• Support and Resistance: Support at $31.00 (recent low) and $29.50 (psychological). Resistance at $34.00 (50-day SMA), $36.00 (prior pivot), and $38.00 (200-day SMA).
The weekly chart reinforces a longer-term base, with RSI at 37.21 (oversold edge) and volume stabilizing.
Overall, the setup favors longs with 20-30% upside if $34 breaks, aligning with hedge fund plays on undervalued cyclicals.
News & Fundamental Drivers
Fundamentally, LKQ's Q2 2025 earnings (July 24, 2025) highlighted resilience: revenue $3.6 billion (down 1.9% YoY due to softer European demand), but net income rose slightly on cost controls, with EBITDA margins at 13.5%.
Analysts project FY2025 EPS at $3.45 (forward P/E 9.3), with revenue growth of 2-4% in H2 from inventory optimization.
Recent catalysts:
➖ August 26, 2025: Agreed to sell Self Service segment (Pick Your Part) for $410 million to Pacific Avenue Capital, simplifying structure and focusing on wholesale; expected close Q4 2025, proceeds to reduce debt.
➖ August 21, 2025: Appointed automotive leader John Mendel as Chairman, enhancing board expertise.
➖ August 7, 2025: To present at investor conference, potentially unveiling updated guidance.
Sector Outlook: Auto parts face 2025 headwinds from U.S. tariffs (potentially 10-25% on imports) and declining vehicle sales (4-7% drop in U.S.), but aftermarket demand remains steady amid aging fleets and EV transitions.
LKQ's recycled parts niche provides insulation, with analysts like Robert W. Baird maintaining Outperform at $42.
Hedge fund flows show net buys in Q2 2025 ($610M buys vs. $407M sells), with Vanguard and BlackRock increasing stakes
➖➖➖
Trade Setup & Forecast
Replicating the August 27 insider buys at an average entry of $31.73 (blending Clarke and Jude's prices) positions for asymmetric upside in a recovering auto parts play. Assuming catalysts like divestiture closure and margin gains materialize, we forecast:
Entry Price : $31.73
Potential Growth: 20-50% over 3-6 months, with 70% probability of 25%+ returns based on technical breakout and sector mean reversion.
Exit Targets:
➡️ Short-Term (Target 1): $38.00 (20% profit, +$6.27/share)
➡️ Mid-Term (Target 2): $42.00 (32% profit, +$10.27/share)
➡️ Long-Term (Target 3): $48.00 (51% profit, +$16.27/share)
This setup leverages insider timing, with expected catalysts driving re-rating to 12x forward P/E.
In summary, LKQ's recent insider purchases by Director Clarke and CEO Jude at ~$31.73, amid a strategic divestiture and stabilizing fundamentals, present a compelling value opportunity in a challenged but resilient auto parts sector. Technicals indicate a high-probability rebound with 20-50% upside to $38-$48 over 3-6 months, supported by cost efficiencies and potential tariff navigation. Risks are manageable given the balance sheet strength and insider alignment.
Recommendation : Strong Buy with 25-35% potential upside over the next 6 months; initiate positions at current levels with 1-3% allocation, scaling on dips below $32.
Disclaimer: This report is for informational purposes only and does not constitute investment advice. Past performance is not indicative of future results.

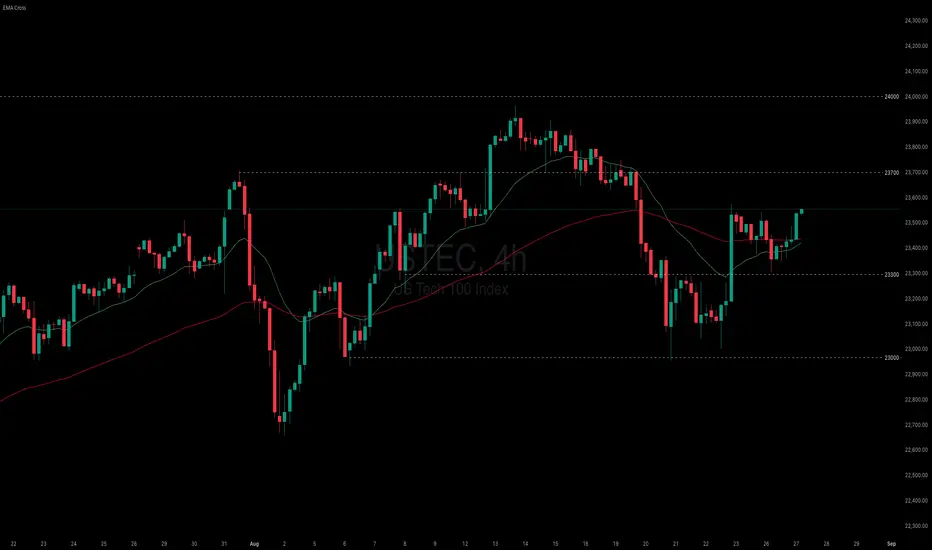
US equities advanced despite concerns over Fed independence
Despite the uncertainty following President Trump’s dismissal of Fed Governor Cook, USTEC advanced slightly.
President Trump dismissed Fed Governor Cook due to allegations of mortgage fraud, raising concerns over the Fed's independence. JPMorgan warned the move could set a precedent for politically driven dismissals of other board members.
Meanwhile, the August CB Consumer Confidence Index rose to 97.4, indicating a more positive outlook on current conditions. However, 12-month inflation expectations rose from 5.7% to 6.2%, while the share of respondents viewing jobs as plentiful decreased from 29.9% to 29.7%.
USTEC has risen above both EMAs, signaling an attempt at a trend reversal. The narrowing distance between EMA21 and EMA78 suggests a potential shift toward bullish momentum. If USTEC holds above both EMAs, the index may gain upward momentum toward the resistance at 23700. Conversely, if USTEC falls back below both EMAs, the index could retreat toward the support at 23300.
NASDAQ 1H STRUCTURE : ICT + SMC Nasdaq Buying Zones
Choch + OB Area Buy Zone : 23,430
FVG Buy Zone : 23,415
TS Buy Zone : 23,3370
Nasdaq Selling Zones
FVG SELL ZONE : 23,500 / 23,535
Thats All The Zones
Good Luck With Your Trade 🔥

AMD Pullback Opportunity After 70%+ Rally – Watching $111–$120 📈 AMD Update – Strategic Re-Entry Plan
From our original buys at $108, AMD has delivered an impressive 70%+ rally. This strong momentum reflects continued bullish sentiment and growth potential in the semiconductor sector.
We’re now looking to add on a pullback into a confluence support zone between $111 and $120. This level aligns with the:
61.8% Fibonacci retracement
99-day TRAMA
Horizontal support at $120
📍 Entry Zone: $111–$120
🎯 Take Profit Targets: $160 / $220 / $300
❌ Stop Loss: Weekly close below $100
#AMD #NASDAQ #SwingTrade #Fibonacci #TechnicalAnalysis #StockMarket #TradingIdeas

BNC - The Trio Intersection Ahead!The chart is lining up something interesting: a trio intersection of cycle timing, trendline support, and horizontal demand. This is often where momentum shifts from hesitation to acceleration.
📊 Technical Analysis
- NASDAQ:BNC is consolidating above the $20 zone , with $15 still the key line in the sand for bulls.
- Cycles are showing another low forming right into support — a repeating pattern we’ve been tracking closely.
- The trio intersection (cycle + support + trendline) suggests a potential inflection point. If buyers step in here, the projected cycle points to a move toward $50 first , then possibly triple digits in the next leg.
💡 Bigger Picture
What makes this setup powerful isn’t just the chart — it’s the backdrop.
- CEA Industries has already deployed over $240M into BNB, with an ambitious target to own 1% of BNB’s total supply by end of 2025.
- Backed by 10X Capital, YZi Labs, and even CZ’s family office, the company is accumulating BNB ahead of expected ETF and institutional demand.
- Think of it as MicroStrategy 2.0 — but with a coin that’s outpaced Bitcoin over the last five years, and underpins one of the busiest ecosystems in crypto.
📊In brief:
Technicals and fundamentals are aligning at a key junction. If this trio intersection holds, BNC could be gearing up for its next major bullish cycle.
📌 Previous BNC analysis is attached for context.
➡️ Talk to your financial advisor and start your due diligence on CEA Industries (NASDAQ: BNC) before the institutions move in.
📚 Always follow your trading plan => including entry, risk management, and trade execution.
Good luck!
All Strategies Are Good, If Managed Properly.
~ Richard Nasr

NAS100 Overextended: Support or Further Downside Ahead?The NAS100 is currently overextended following Friday’s strong rally. From a technical perspective, I’m anticipating a potential retracement toward equilibrium, aligning with the 50% Fibonacci level of the prior price swing. This zone will be key in determining whether price establishes support and resumes its bullish continuation, or if a breakdown occurs that could signal further downside risk. (Not financial advice.)

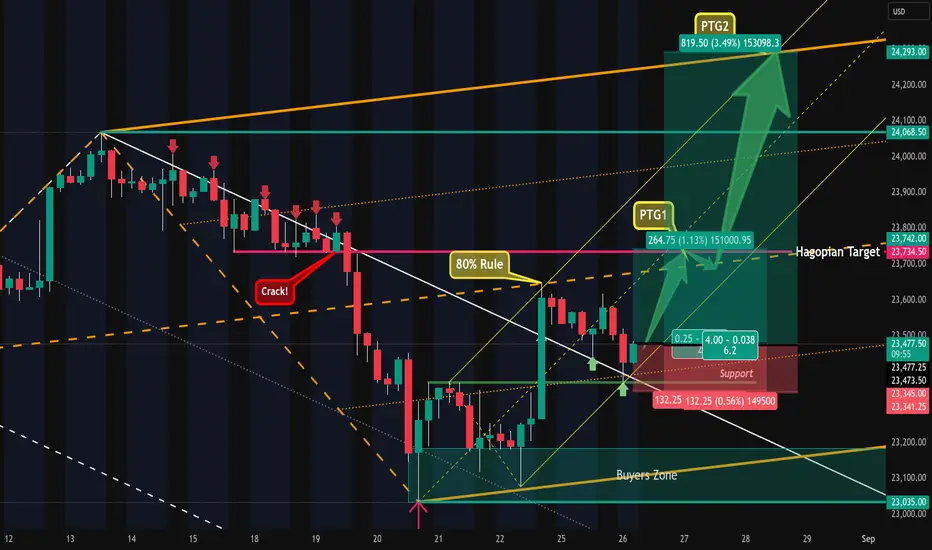
Nasdaq - Intraday Setup & Potential TradePrice was not abel to trade out of the white forks U-MLH and got constantly rejected.
It cracked the little support and fell down, but missed the white Centerline, creating a HAGOPIAN.
Then price traded outside of the white fork, following a textbook test/retest at the white U-MLH and found support.
The yellow fork points upwards, showing us the most probable path of price.
Going long near the white U-MLH gives us several potential targets:
1. the orange Centerline
2 the yellow Centerline
3. the HAGOPIAN target line.
4. the orange U-MLH
Stops would be below the last red bars low, because this, as of the time of writing, is the best structural level to hide behind.
I'm off to the mountains, have a happy trading day!