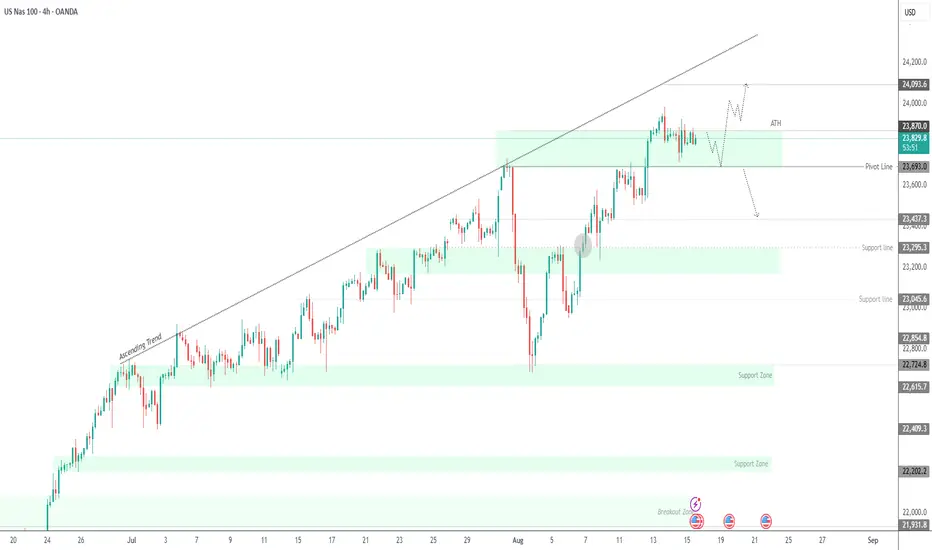
#202533 - priceactiontds - weekly update - nasdaq e-miniGood Day and I hope you are well.
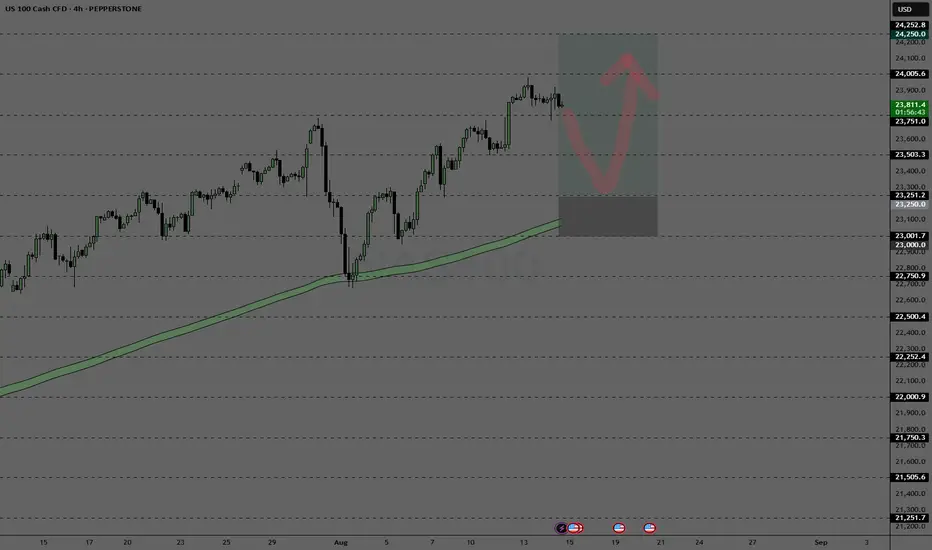
comment: Neutral. Bull flag but market is holding above the breakout price around 23800. Bears need a strong move below 23600 for more downside and if bulls stay above 23800, we can only assume sideways to up movement. I doubt we get another leg up but I have been wrong on that couple of times now. No longs for me above 23500. Only interested in a breakdown for 23400ish or 23000.
current market cycle: bull trend - peak bubble
key levels for next week: 22800 - 24100
bull case: Bulls remain in full control but a bigger pullback is expected. Until that happens, we can continue up since market is living on momentum and it’s still going strong. For a change bulls need to be trapped and that has not happened since April. Every dip buy was profitable but I do think it’s way beyond overdone and moronic to buy above 23000.
Invalidation is below 22700
bear case: Bears still do not have anything here. It doesn’t ever matter if we print 24000 or stay below 23848, until we see big bear bars closing on their lows again, this is likely going higher and bears can not hold short here where the strategy is hope. Nothing has changed last week. Bears need big red bars closing on their lows and trapping late bulls.
Invalidation is above 24100
short term: Neutral at best. Bears not doing enough and btfd is still going strong. Could easily do another test for 24100 before turning but I would not be surprised if we grind down to 23400ish and test the trend line again.
medium-long term - Update from 2024-08-10: Bear trend did not start last week. Sad but ok. I am still only interested in seeing this bubble popping.
Nasdaq

NASDAQ After the Fireworks: Bearish Setup LoadedAfter the classic 4th of July rally, I stepped in on the short side of Nasdaq, targeting 22,000 and 21,400 zones. The market structure shows exhaustion, and with the cloud retest failing to hold new highs, I positioned accordingly.
Technical:
• Price stalled at prior expansion highs with tight compression near 23,000.
• Daily FibCloud offered resistance confirmation.
• Bearish risk-reward skew forms after extended rally and thin retraces.
• Volume divergence spotted.
Fundamentals:
Multiple overlapping uncertainties:
• Trump confirmed tariffs will take effect on August 1, threatening a 10% surcharge on BRICS-aligned nations.
• Treasury Secretary Bessent anticipates several trade deal announcements within 48h—but stresses quality over quantity.
• Bank of America maintains its base case of 0 rate cuts in 2025, citing strong economic data and sticky inflation risks.
The combination of tariff escalation, hawkish monetary expectations, and global trade friction creates a perfect backdrop for volatility and correction—especially in overextended tech indices like the Nasdaq.
Note: Please remember to adjust this trade idea according to your individual trading conditions, including position size, broker-specific price variations, and any relevant external factors. Every trader’s situation is unique, so it’s crucial to tailor your approach to your own risk tolerance and market environment.

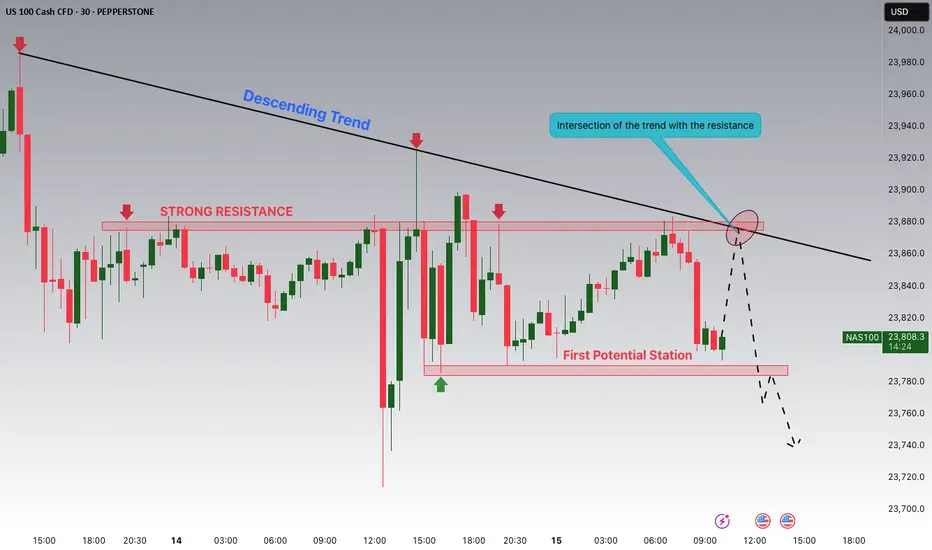
NASDAQ is Nearing the Intersection of The Trend with Resistance!Hey Traders, in today's trading session we are monitoring NAS100 for a selling opportunity around 23,875 zone, NASDAQ is trading in a downtrend and currently is in a correction phase in which it is approaching the trend at 23.875 support and resistance area.
Trade safe, Joe.
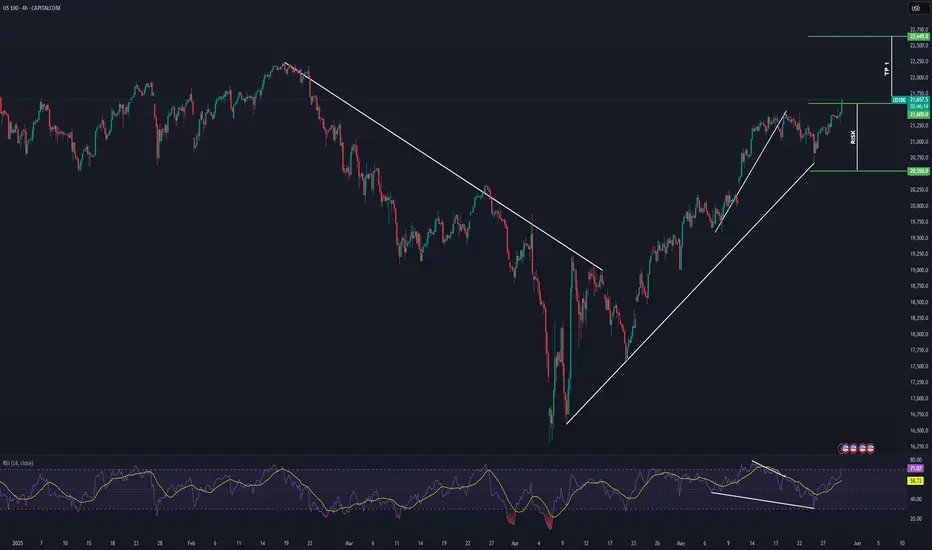
NASDAQ Potential Bullish ContinuationNASDAQ price action seems to exhibit signs of potential Bullish momentum as the price action may form a credible Higher High (after tarriff delays on the EU) with multiple confluences through key Fibonacci and Support levels which presents us with a potential long opportunity.
Trade Plan:
Entry : 21600
Stop Loss : 20550
TP 1: 22649
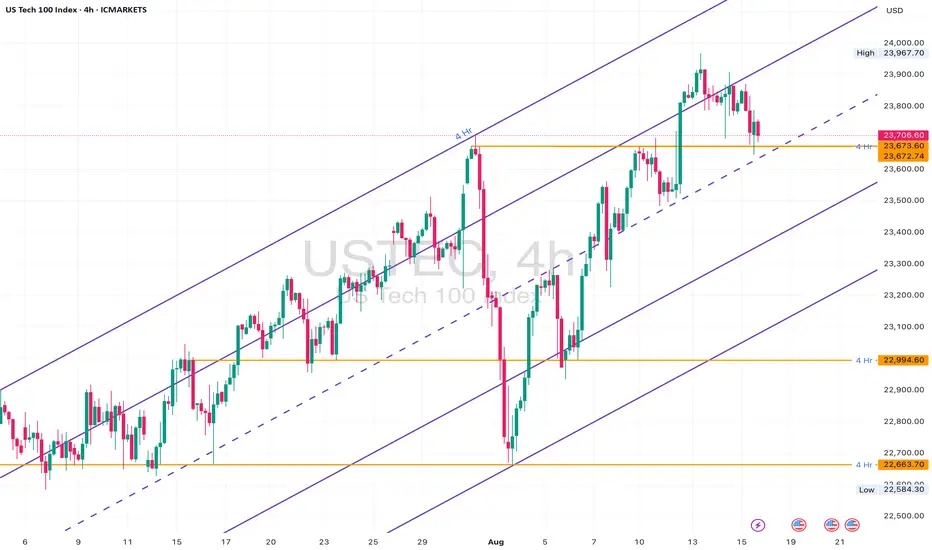
NAS100 4H Channel: Bounce or Breakdown?NASDAQ100 has been trending within a clean ascending channel on the 4H timeframe. We’re now sitting at a crucial decision point — the midline and horizontal support around 23,670.
This zone has historically acted as a strong S/R pivot. If price holds, we could see another bullish bounce toward 24,000+. But if it breaks and closes below, we may get a clean drop toward the bottom of the channel — with 23,200 and 22,663 as targets.
Plan:
• Wait for a 4H close above or below the 23,670 level
• Bullish scenario: Bounce toward upper channel (~24,300)
• Bearish scenario: Drop to lower channel boundary with incremental TP levels
Structure:
• 4H rising channel structure still intact
• Price testing midline zone
• Horizontal level at ~23,670 adds confluence
• No confirmed break of channel yet
Key Zones:
• Support: 23,670 (midline + structure support)
• Bullish flip zone: 23,967
• Bearish continuation zones:
‣ 23,200
‣ 22,994
‣ 22,663
US30 - potential head and shoulders on 30min chartWatching the US30Cash for a potential short setup.
A head and shoulders pattern may be forming on the 30-minute timeframe. I’m still waiting for confirmation on some key variables before entering the trade.
Trade Details:
📊 Risk/Reward: 2.7
🎯 Entry: 45 224
🛑 Stop Loss: 45 261
💰 Take Profit 1 (50%): 45 141
💰 Take Profit 2 (50%): 45 084
Thanks for checking out my post! Make sure to follow me to catch the next update. If you found this helpful, give it a like 👍 and share your thoughts 💬 — I’d love to hear what you think!
Please note: This is not financial advice. This content is to track my trading journey and for educational purposes only.

USNAS100 | Geopolitics in Play – Key Pivot at 23870USNAS100 Overview
Geopolitical developments currently influence the price.
Technical Outlook:
While below 23870, the price is expected to drop toward 23690. To confirm continuation of the bearish trend, it needs a 1H close below 23690.
A 4H close above 23870 would shift momentum bullish toward 24090.
Pivot: 23870
Support: 23690, 23540, 23440
Resistance: 23940, 24090
NAS100 Looking for a retrace and into a key levelLooking for a potential buy position and holding.
This is my markup and potential buy position.
I am not a financial advisor.
Update on the Nasdaq trade idea I shared last night.An update on the trade idea of NASDAQ last night where I was anticipating a buy from the marked zone with other possible Point Of Interested marked out aswell.
Price behaved exactly the way I was anticipating, even though it hasn't went really far as of yet.
BNC — The Wall Street Backdoor to BNBMost U.S. investors can’t buy BNB (the world’s #3 cryptocurrency) directly in their brokerage accounts. Yet it powers one of the most-used blockchains in the world => it is deflationary, pays yield, and has outperformed Bitcoin over the last five years.
But there’s now a backdoor … and it trades on the NASDAQ.
📌 Meet CEA Industries ( NASDAQ:BNC )
BNC is the first publicly traded U.S. company to make BNB its core treasury asset; much like MicroStrategy did with Bitcoin, but with arguably even greater upside potential.
The company has already deployed over $500 million into BNB, backed by institutional names like 10X Capital and YZi Labs , positioning itself ahead of expected demand from ETFs, exchanges, and even sovereign funds.
For everyday investors, this could be the easiest way to get one-click exposure to BNB; before Wall Street catches on.
📊 Technical Analysis
After deploying over $500M into BNB 💰, BNC has skyrocketed by more than 880% 🚀.
Missed the initial rally? No problem. BNC had entered a markdown phase 📉, retracing to fill the previous gap — a classic textbook pattern 📚. Historically, once such gaps are filled, the stage is often set for the next big bullish impulse 📈.
That key moment has now arrived ✅ — price has broken above the $23 accumulation zone 🔓, confirming a decisive momentum shift from bearish (markdown) ➡️ bullish (markup).
With the markup phase underway, our targets are:
- Short-term: $50 — key resistance level & psychological milestone 🧠
- Medium-term: $82.30 — filling a major gap from earlier price action 📊
💡 Why This Matters
- BNB has outperformed Bitcoin over the last 5 years (25x vs 9x).
- Deflationary supply + staking yield potential.
- Global adoption despite regulatory headwinds.
- First-mover advantage => no other U.S. public company is building its treasury around BNB.
Bottom line?
This could be MicroStrategy 2.0 - but with a token that may have an even stronger growth story ahead.
➡️ Talk to your financial advisor and start your due diligence on CEA Industries (NASDAQ: BNC) before the institutions move in.
📚 Always follow your trading plan => including entry, risk management, and trade execution.
Good luck!
All Strategies Are Good, If Managed Properly.
~ Richard Nasr

Summer RALLY-2025: What’s Driving #SP500 and #NQ100 Higher?Dear readers, earlier on June 25, 2025, in our article “Unexpected Surges and Drops in the Indices” we noted the U.S. economy’s readiness for bullish sentiment.
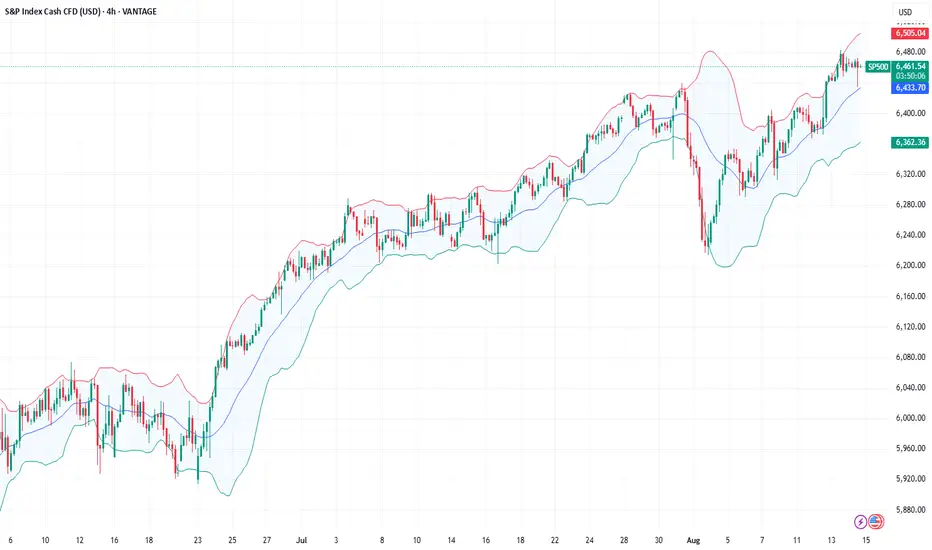
On August 12, 2025 #SP500 climbed above 6,400, and #NQ100 hit a new high above 23,800 as U.S. inflation came in softer than expected, prompting the market to believe in an imminent Fed rate cut — money became “cheaper,” making stocks more attractive. Tech giants and all things AI — chips and cloud — are in high demand and lead the gains. Many companies have reported earnings above forecasts, and buybacks are underway, supporting prices. A weaker dollar is also boosting the revenues of multinational corporations. As a result, investors are buying more aggressively, pushing indices to new records.
5 Reasons Why #S&P500 and #NQ100 Could Hold Their Ground Until the End of 2025:
Dovish Fed. Rate cuts → cheaper money → higher valuations.
AI and data center boom. Growing demand for chips, cloud, and software lifts the tech sector.
Profits + buybacks. Companies beat forecasts and repurchase shares → EPS growth and price support.
Low yields and weaker dollar. Stocks look more attractive than bonds; exporters earn more easily.
Domestic investment in the U.S. Localized production and infrastructure fuel demand for tech and industry.
The foundation of #SP500 and #NQ100 growth is profit. The earnings season added confidence: market participants liked the “breadth” of earnings beats and the resilience of margins among major issuers — the third pillar of the current rally. According to FreshForex, soft inflation and expectations of a Fed rate cut create a window of opportunity for long positions in #SP500 and #NQ100.
NAS100 – Potential Short Setup After Sharp RallyOn the 5-minute chart, NAS100 has made a strong upward move following a sharp drop earlier in the session.
Price is now approaching a potential exhaustion point near 23,940–23,960. I expect a reversal from this zone, followed by a move back toward 23,725 and possibly lower.
Trade Plan:
Sell Entry: 23,940–23,960 zone after confirmation
Stop-Loss: Above 23,960
Take-Profit: 23,725 initial target; further downside possible if momentum continues
Notes:
Watch for reversal candlestick patterns or break of short-term structure before entering.
This setup is based on intraday momentum and may require fast execution.

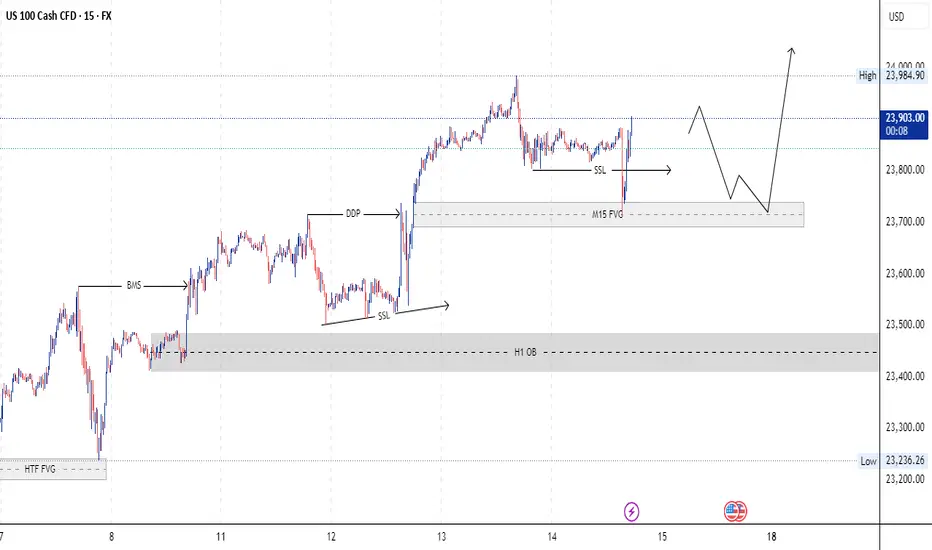
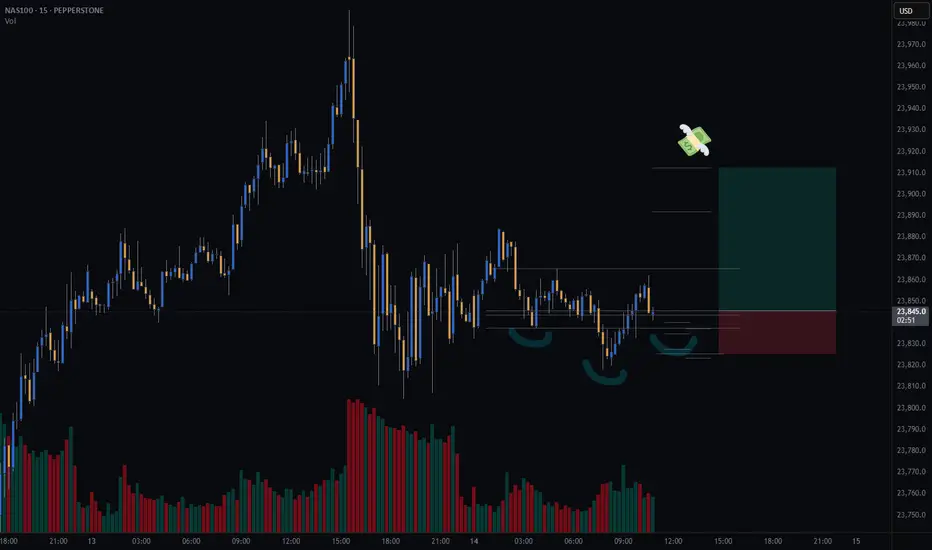
Potential inverse head and shoulders on NASDAQ (CASH100) - 15minI’m watching the Cash100 for a potential long setup.
On the 15min chart, an inverse head and shoulders pattern appears to be forming — potentially a continuation pattern following this week’s strong upward move.
I’m still waiting for confirmation of key variables, which will be assessed at 11:30am (GMT+1).
Trade Details:
📊 Risk/Reward: 2.4
🎯 Entry: 23 845
🛑 Stop Loss: 23 825
💰 Take Profit 1 (50%): 23 891
💰 Take Profit 2 (50%): 23 912
#GTradingMethod Tip: Lower volume on the right shoulder vs. the left shoulder strengthens the setup.
Please note: This is not financial advice. This content is to track my trading journey and for educational purposes only.
NASDAQ H1 BUYING CHANNEL Buy Nasdaq Channel ?
Buy Gold At Nasdaq FVG
Buying Structre #NASDAQ
Buy At FVG

NASDAQ (CASH100) is Approaching KEY ResistanceSince 15 May, the Cash100 has been trading within an upward channel.
It’s now approaching diagonal resistance — will it hold, or break higher?
On the chart, I have marked every time NAS has tested the diagonal resistance and failed to break through.
I’ll be watching this area closely for shorts.
What do you think: will NAS continue climbing, or is a reversal coming?

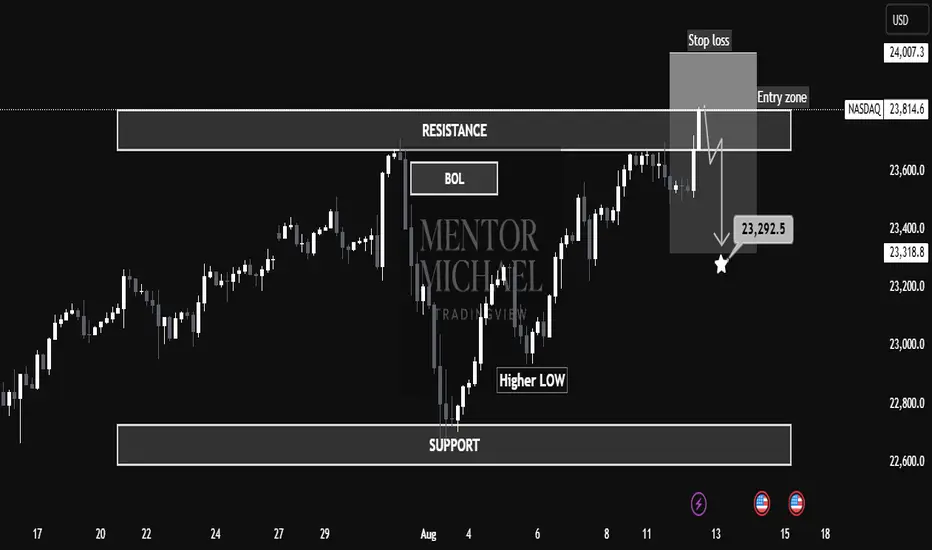
NASDAQ at Make-or-Break Resistance – Is a Sharp Drop to 23,292 "📉 NASDAQ at Make-or-Break Resistance – Is a Sharp Drop to 23,292 Next?"
📊 NASDAQ is currently trading within a well-defined resistance zone (23,812 – 24,007) after a recent rally from the support base near 22,800. The structure suggests a potential sell-side setup if price respects the resistance and fails to break higher.
🧐 Market Structure Analysis
Support Zone: Around 22,800, where buyers previously stepped in, forming a Higher Low and initiating the last bullish leg.
Resistance Zone: 23,812 – 24,007, marked by previous rejections and a Break of Liquidity (BOL).
Price has tapped into the entry zone just below resistance, hinting at possible exhaustion from buyers.
The chart indicates a bearish bias from this zone, aiming for a move toward 23,292.5 (marked target).
🎯 Educational Trade Example
Entry Zone: 23,812 – 24,007
Stop Loss: Above 24,007 to protect against breakout rallies.
Target: 23,292.5 (aligned with previous structural support).
Rationale:
Trading against strong resistance offers asymmetric R:R if momentum shifts bearish.
The Higher Low before resistance can act as liquidity fuel for sellers once demand weakens.
Clear invalidation point keeps risk defined.
⚠ Invalidation Scenarios
A strong breakout and close above 24,007 with follow-through volume would invalidate the short idea and potentially signal continuation toward 24,200+.
💡 Key Takeaways for Students
Zone-to-Zone Trading: Always define both entry and exit zones before execution.
Structure Before Strategy: The market’s reaction to resistance is the clue — confirmation comes before position sizing.
Risk Management is Non-Negotiable: Even high-probability setups require strict stop placement.
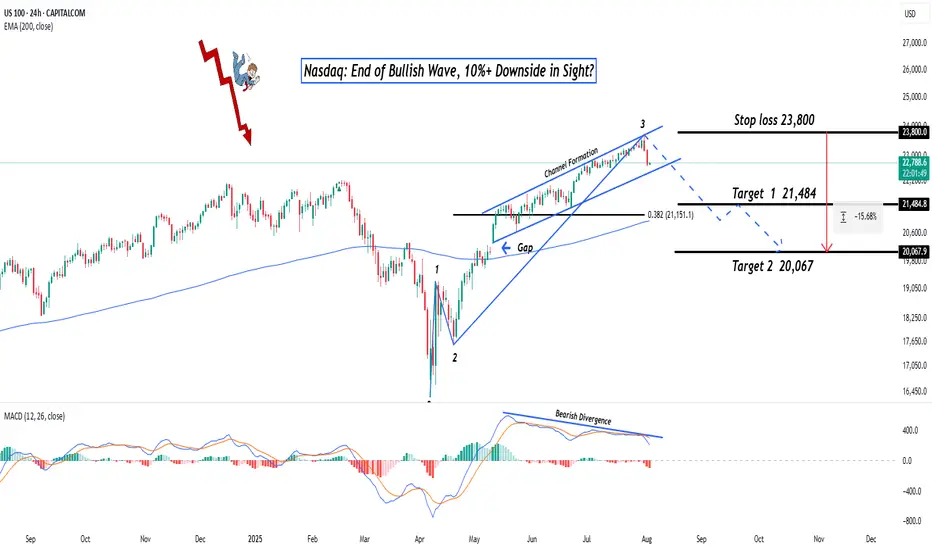
Nasdaq: End of Bullish Wave, 10%+ Downside in Sight?Hey Realistic Traders!
Has CAPITALCOM:US100 (Nasdaq) Finally Peaked? A Reversal Signal Just Flashed. Is This the Turning Point Toward a Deeper Pullback?
Let’s dive into the technicals to see what the chart is really telling us.
Technical Analysis
On the daily chart, the Nasdaq is starting to show signs of weakness. A bearish divergence has formed between the MACD and price movement , which is a classic signal that bullish momentum may be fading. This often indicates the potential for a trend reversal or a deeper correction.
A recent drop, confirmed by a strong bearish full-body candlestick, suggests that selling pressure is increasing. If this continues, we expect a breakdown from the current bullish channel.
In this scenario, the extended Wave 3 may have reached its peak. A correction could follow, with the first target at 21484, which lines up with the 0.382 Fibonacci retracement level. If the decline continues, the next downside target would be around 20067, where a previous gap may be filled.
This bearish outlook remains valid as long as the price stays below 23800 . A move above that level would invalidate the setup and return the outlook to neutral.
Support the channel by engaging with the content, using the rocket button, and sharing your opinions in the comments below.
Disclaimer: "Please note that this analysis is solely for educational purposes and should not be considered a recommendation to take a long or short position on Nasdaq.
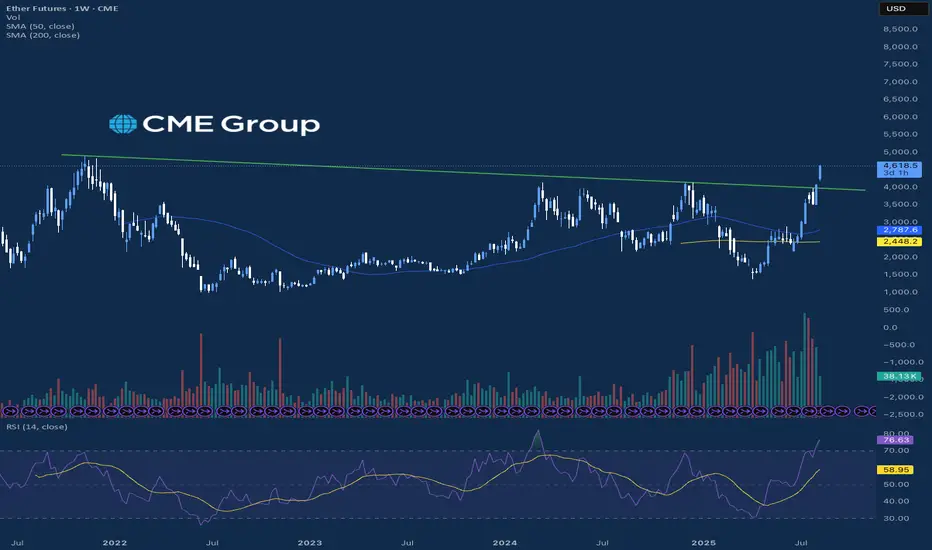
Nasdaq Hits New All Time HighThe big news of the session today was the CPI report, which rose by a less than expected amount in July. Initially, equity markets jumped off of the report and were able to close the day higher after some back and forth price action. THe Russell was the leader which traded up near 3% on the day while the S&P and Nasdaq traded to their all time high prices. While the Nasdaq was at an all time high, the Russell is looking to cross a critical level that traders have not seen since February of this year.
Outside of the equities, the significant jump in the Crypto markets continued today which was led by Ether futures and Solana futures which both traded up about 8% on the day. Ether futures have been on an incredible stretch to the upside and have now reached a level not seen since December of 2021, showing strong continued momentum. Bitcoin has also continued to slowly climb higher and will be looking to re-test its all time high price which is right near $123,615.
If you have futures in your trading portfolio, you can check out on CME Group data plans available that suit your trading needs tradingview.com/cme/
*CME Group futures are not suitable for all investors and involve the risk of loss. Copyright © 2023 CME Group Inc.
**All examples in this report are hypothetical interpretations of situations and are used for explanation purposes only. The views in this report reflect solely those of the author and not necessarily those of CME Group or its affiliated institutions. This report and the information herein should not be considered investment advice or the results of actual market experience.
ETH - If You Know ...... You Know whats Coming
NYSE:BLK $BUIDL tokenized U.S.-Treasury fund launched on COINBASE:ETHUSD in Mar 2024—Wall Street is already settling real dollars on-chain.
NYSE:JPM JPMD stablecoin just went live on Base (an COINBASE:ETHUSD L2), piping wholesale payments from a $4 T balance-sheet straight through COINBASE:ETHUSD rails.
COINBASE:ETHUSD isn’t just riding the next crypto cycle—it’s becoming Wall Street’s settlement layer. From BlackRock’s on-chain Treasury fund to JPMorgan’s and soon Bank of America’s dollar tokens, a tidal wave of institutional stable-coin flows is lining up behind ETH. Fewer coins, more real-world volume—if you know, you know what’s coming.
NYSE:BAC CEO says they’ll issue a dollar-backed token the moment regulators nod—another tier-1 bank boarding the Ethereum train.
Stablecoin cap has blasted past $230 B , with 80 %+ of all on-chain transfers riding Ethereum (plus BSC) blocks.
Corporate settlements via stablecoins grew 25 % YoY in 2024 as multinationals replaced SWIFT with instant on-chain clearing.
Daily stablecoin throughput averages $7 B—each hop burning ETH and tightening supply.
BCG projects tokenized real-world assets to exceed $16 T by 2030 , with EVM chains as the default plumbing.
Over 500 M wallets already interact with stablecoins , a 30 % YoY surge led by emerging-market demand.
L2s like BINANCE:ARBUSDT & BINANCE:OPUSDT cut transaction fees 35 % yet still settle back to mainnet—meaning ETH captures the fee stream and the burn.
Bottom line: a tidal wave of bank-grade stablecoins + tokenized assets is lining up behind ETH; supply shrinks, demand soars—if you know, you know what’s coming.
quote] Marty Boots | 17-Year Trader — smash that , hit LIKE & SUBSCRIBE, and share your views in the comments below so we can make better trades & grow together!

ARKK: The Calm Before the Innovation Storm -ALTSEASON Is COMING🚀 ARKK: The Calm Before the Innovation Storm 🌪️
The markets are shifting, and disruption is about to go vertical. ARK Innovation ETF (ARKK) is quietly positioning itself for what could be the most explosive move of this decade. With high-conviction bets in AI, Bitcoin, genomics, and next-gen tech, this isn’t just a fund—it’s a launchpad for exponential growth.
This post breaks down exactly why ARKK could go parabolic—and why the smart money is already moving in. 👇
Explosive upside in 2026
ARKK is already up over 24% YTD , showing strong momentum compared to broader markets and signaling early stages of a potential parabolic move .
High-conviction concentration in game-changers
Top 10 holdings include Tesla, Roku, Zoom, Coinbase, UiPath, Block, Crispr Therapeutics, DraftKings, Shopify, and Exact Sciences. These are leaders in innovation sectors with massive upside potential .
Deep exposure to Bitcoin and digital assets
Heavy allocation to Coinbase and Block gives indirect exposure to Bitcoin . If BTC breaks into a new cycle high , ARKK stands to benefit significantly.
Positioned in exponential growth sectors
Focus on AI, genomics, EVs, fintech, robotics, and blockchain , all of which are entering accelerating adoption phases globally.
Aggressive smart-money accumulation
Cathie Wood’s team continues buying aggressively during dips, reinforcing institutional confidence in the fund’s long-term trajectory.
Technical breakout structures forming
Ascending triangle and multi-month consolidation breakouts suggest a technical setup primed for explosive upside .
Innovation supercycle aligning
ARKK's themes are aligned with major global shifts like de-dollarization, decentralized finance, and AI convergence .
High beta = massive upside leverage
With a beta above 2 , ARKK tends to outperform in bull runs , offering leveraged exposure to innovation without the need for margin.
Resurgence of top holdings
Names like Coinbase, Tesla, Shopify, and Roku are up 50%–100% YTD , driving ARKK’s NAV growth and fueling bullish sentiment .
Long-term vision with short-term catalysts
The fund projects 5x returns over the next five years , while Bitcoin halving cycles, tech innovation, and regulatory clarity serve as short-term ignition points .
Marty Boots | 17-Year Trader — smash that 👍👍, hit LIKE & SUBSCRIBE, and share your views in the comments below so we can make better trades & grow together!

NASDAQ eyes 24300 as the Channel Up extends.Nasdaq (NDX) has been trading within a 3-month Channel Up since the May 12 candle. Throughout the whole time, the 1D MA50 (blue trend-line) has been in firm Support and right now the pattern is unfolding its latest Bullish Leg.
The last two rose by +6.67%, so that gives us a Target of 24300 by the end of the month.
Notice also that the 1D MACD is about to form a Bullish Cross. The previous one was a strong buy signal during the most recent Bullish Leg.
-------------------------------------------------------------------------------
** Please LIKE 👍, FOLLOW ✅, SHARE 🙌 and COMMENT ✍ if you enjoy this idea! Also share your ideas and charts in the comments section below! This is best way to keep it relevant, support us, keep the content here free and allow the idea to reach as many people as possible. **
-------------------------------------------------------------------------------
Disclosure: I am part of Trade Nation's Influencer program and receive a monthly fee for using their TradingView charts in my analysis.
💸💸💸💸💸💸
👇 👇 👇 👇 👇 👇

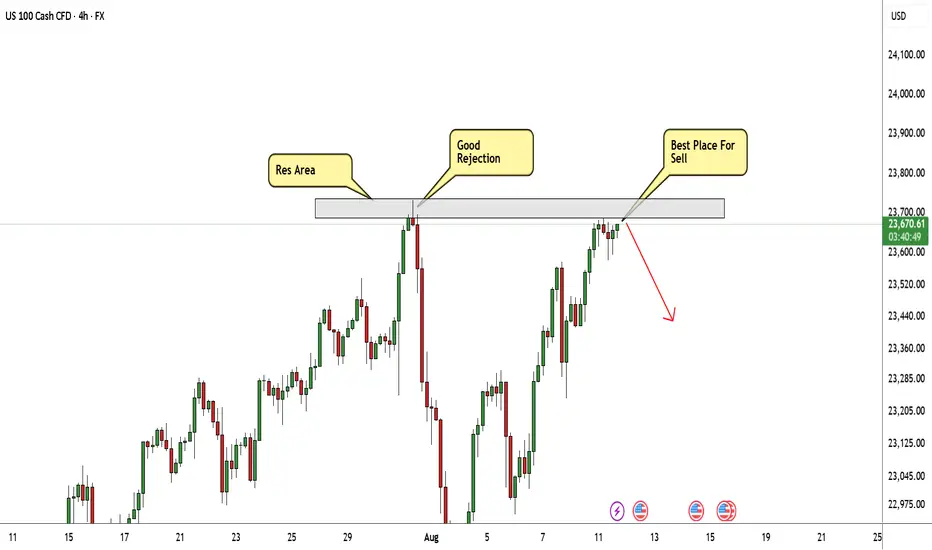
NASDAQ At Good Res , Is It A Chance To Sell To Get 200 Pips ?Here is my 4H Nasdaq Chart and my opinion is the price at very interesting selling area for me , and we have a very clear bearish price action and this Res Area forced the prices to go down Very hard and i think this Second Touch will be the best one , so i`m waiting selling this pair now and targeting from 100 to 200 pips . the only reason to cancel this idea if we have a clear daily closure above my res area .
Entry Reasons :
1- Clear Res Area .
2- Second Touch For The Res .
3- Bearish Price Action .
USNAS100 | CPI Day Setup – Breakout or Pullback Ahead?USNAS100 Overview
Markets found some relief after the U.S. and China extended their tariff truce until November 10, avoiding the imposition of triple-digit duties on each other’s goods.
Today, attention is firmly on the U.S. CPI release, which is expected to drive market direction:
A reading above 2.8% would likely support a bearish move toward 23440 and 23295.
A reading below 2.8% could fuel bullish momentum toward a new ATH at 23870.
Technical Outlook:
As long as the price trades below 23690, downside targets remain 23440 and 23295.
A 1H close above 23695 would turn the bias bullish toward 23870.
Support: 23440, 23295, 23045
Resistance: 23700, 23870
