EUR/USD | EURUSD Approaching Key Supply Zone, What's Next ?By analyzing the #EURUSD chart on the 6 hour timeframe, we can see that price is currently trading around 1.174. I expect EURUSD to first push up toward the 1.178 to 1.182 zone, and once price reaches this supply area, a bearish reaction is likely.
We need to watch how EURUSD behaves when it taps this zone. All other important supply and demand levels are already marked on the chart, so make sure to monitor price reactions closely.
Please support me with your likes and comments to motivate me to share more analysis with you and share your opinion about the possible trend of this chart with me !
Best Regards , Arman Shaban
Nasdaq

EUR/USD | Testing the supply zone (READ THE CAPTION)By examining the 4H chart of EURUSD, we can see that it has stuck to the supply zone and it's having a hard time making it through the zone. I expect another move to 1.17590 (high of the supply zone) and if it breaks through, I expect it to challenge the FVG zone.
If EURUSD fails to go through the supply zone, a drop to 1.17130 is likely.
Make sure to like and leave comment folks.

25.12.15 Nasdaq Analysis ScriptWelcome to ACID TRADE.
Hello everyone, today is December 15, 2025, and this is my Nasdaq market analysis.
My name is Acid.
Friday’s Analysis – Result Review
Reference chart:
Let’s begin by reviewing Friday’s analysis.
In the previous briefing, I stated that a break below 25,400 would likely trigger strong downside momentum, with 25,200 as the primary target.
As shown on the chart, Nasdaq dropped approximately 253 points in less than one hour, resulting in a profit zone of roughly $5,000 per contract.
This move confirmed that the downside structure and liquidity below 25,400 were valid.
Daily Chart Outlook
Reference chart:
Now let’s move to the daily timeframe.
Currently, Nasdaq has entered the Ichimoku cloud.
Price action within the cloud suggests that the market has not yet chosen a clear direction, but historically this structure allows for one-directional downside moves once bearish momentum expands.
From the current level, the lower boundary opens downside potential toward approximately 23,990, which represents nearly a 5% decline.
Additionally, Friday’s closing low and today’s early-session low are located at very similar levels.
This makes 25,147 a critical support — a clean break below this level would strongly indicate further downside continuation.
15-Minute Strategy – Long Scenario
Reference chart:
Let’s move on to today’s 15-minute trading strategy, starting with the bullish scenario.
For Nasdaq to resume an upside move, we need a break above the resistance trendline, combined with a break above the upper supply zone.
Following Friday’s sell-off, price is forming a short-term triangle compression.
However, this structure developed over a very short time period, which reduces its reliability.
Because of that, the focus should be on key price levels, not the pattern itself.
A bullish bias becomes valid only if price breaks above 25,400–25,430.
If this level is reclaimed, long positions can be considered.
Upside targets:
25,483 → 25,566 → hold for potential extension.
15-Minute Strategy – Short Scenario
Reference chart:
Now for the bearish scenario.
The short-term ascending trendline currently sits near 25,180, but its reliability is low since it aligns closely with recent lows formed on Friday and today.
From a strategic perspective, the cleaner short setup comes from a break below Friday’s low rather than an early trendline entry.
The downside target is based on the daily structure.
Specifically, the opening price of the strong bullish candle marked by the blue box.
This level is located near 25,027, which also aligns with the daily 60-period moving average.
If this level breaks, a move toward 25,027 within today’s session becomes highly probable.
Conclusion
Nasdaq remains in a high-risk decision zone inside the daily cloud.
A break below 25,147 increases the probability of downside acceleration.
Upside is only valid above 25,400–25,430 with confirmation.
Until a breakout occurs, expect range-bound volatility.
Trade the levels, not the emotion.

XAU/USD | A new ATH coming? (READ THE CAPTION!)Good morning folks, Amirali here.
As you can see, Gold has shattered the FVG and is now being traded at $4343 which is the lower part of the Bearish OB. We have to wait and see if Gold can go through the Bearish OB and hit the $4380 target and a hit a new ATH.
A drop to the high of the FVG at $4317 before going up to hit the target is possible.

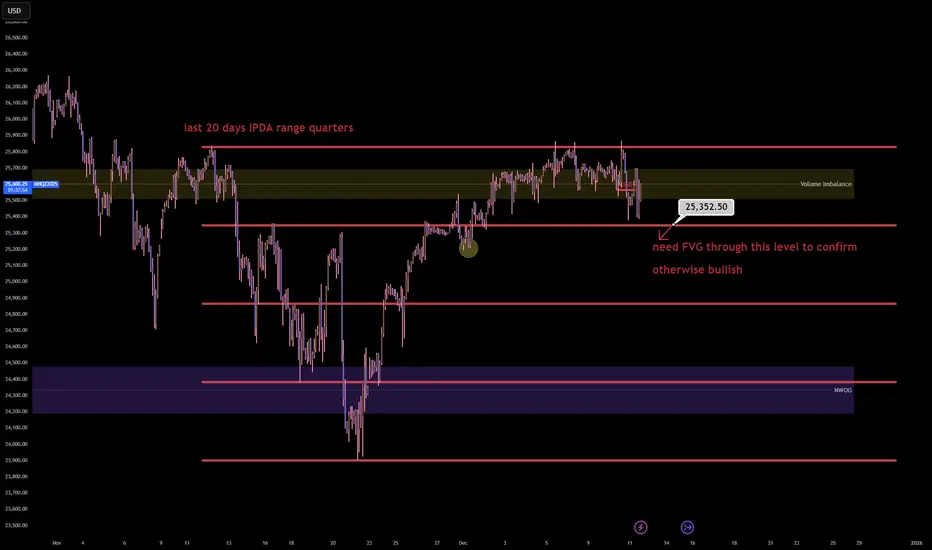
NQ1! (Nasdaq 100) has entered the terminal phaseThe Nasdaq 100 has entered the terminal phase of its 20 day institutional dealing range and is currently executing a distribution program within the premium quartile. The failure to sustain price acceptance above the 25,700.00 Volume Imbalance suggests the algorithm is preparing for a mean reversion event to rebalance the monthly ledger.
The present price action represents a classic 'Bull Trap' at the upper boundary of the range where retail momentum is being absorbed by institutional limit sell orders ahead of a repricing to equilibrium.
Entry: 25,550.00 (Sell Limit)
Stop loss: 25,880.00 (330.00 points)
Take profit: 24,850.00 (700.00 points)
Risk to reward ratio: 2.12R
CME_MINI:NQ1! CME_MINI:MNQ1! IG:NASDAQ
The Opportunity
The 20 day IPDA lookback reveals that price is oscillating within a defined premium distribution block between 25,350.00 and 25,850.00. The market has expended significant energy to reach this valuation but has failed to close the daily candles above the key Volume Imbalance at 25,700.00.
This rejection signature implies that the 'Santa Rally' narrative has been utilized to engineer exit liquidity for smart money positions accumulated at the lows. The algorithm is an efficiency engine and it cannot justify a new macro expansion leg without first revisiting the internal range equilibrium to capitalize the move.
The Entry
Initiating a short position in the 25,550.00 to 25,600.00 zone aligns with the institutional logic of selling the upper 25% of the monthly range. This zone offers the highest statistical edge as it places the entry directly against the 'Ceiling' of the current volatility profile while targeting the 'Floor' of the recent expansion.
The Volume Imbalance acts as a natural defensive barrier for the stop loss as the algorithm will typically respect this array during a distribution phase.
The Invalidation
The bearish causal chain is ontologically corrupted if price achieves a daily close above the 25,880.00 range high. Such an event would signify a 'Blue Sky' breakout and a shift in regime from range bound to trending.
If the market accepts price above this threshold it implies that the premium valuation has become the new floor and the algorithm is targeting the 26,000.00 psychological level.
Key Trajectory Waypoints
Target 1: 25,350.00 | Type: 75% Range Quartile | Probability: 70% | ETA: 24 Hours
Target 2: 24,850.00 | Type: Range Equilibrium (50%) | Probability: 60% | ETA: 2-3 Days
Target 3: 24,400.00 | Type: NWOG / Discount Target | Probability: 40% | ETA: Next Week
The Shadow Reality
A 35% probability exists for the antithetical reality: The Range Expansion.
In this scenario the current consolidation is a 'High Tight Flag' and the algorithm ignores the equilibrium requirement to force a squeeze into the 26,000.00 level immediately.
This reality is confirmed if price holds above 25,650.00 for two consecutive 4 hour closes.
COIN | 200 SMA Confluence + Bullish Doji = High-Value Setup🎯 COIN: The 200 MA Heist — Dip Buyers Stacking Bags While Others Panic 💼🔥
📊 Asset Intelligence
Coinbase Global Inc (COIN) — NASDAQ
Strategy Classification: Swing/Day Trade Hybrid
Market Bias: Bullish Pullback Confirmation
Risk Profile: Calculated Aggression
🧠 Technical Thesis — Why This Setup Slaps
Listen up, Thief OG's 👀
COIN just pulled back to the 200 Simple Moving Average and did exactly what professional setups do — it respected support and reversed. We got a textbook Heikin Ashi reversal doji candle forming right at the MA, signaling buyer exhaustion turned into buyer dominance.
Translation for the streets: Big money stepped in. Retail panicked. We capitalize.
📈 What We're Seeing:
200 SMA holding like a vault door 🔐
Heikin Ashi doji = indecision flipped to bullish conviction
Volume profile showing accumulation, not distribution
Buyers got the juice to push this higher
This isn't hopium. This is structure meeting momentum at a critical support zone.
💰 The "Thief Strategy" Entry Playbook
We don't chase. We layer. We scale. We steal profits from emotional traders.
Instead of slapping market buy like a degen, we're using layered limit orders to build our position as price moves in our favor. Think of it like planting money traps on the way down.
🎯 Entry Layers (Limit Orders):
Layer 1: $330 💵
Layer 2: $340 💵
Layer 3: $350 💵
Layer 4: $360 💵
You can add more layers if you're feeling spicy 🌶️. The goal is to dollar-cost average into strength, not weakness. Let the market come to YOU.
Pro Tip: Not all layers need to fill. Sometimes you only catch 2-3. That's fine. Better to miss some entry than to get caught in a fake-out.
🛡️ Risk Management — Protect Ya Neck
Stop Loss: $310 🚨
Real talk, Thief OG's: This is MY stop based on MY risk tolerance. You are NOT me. You don't have my account size, my strategy, or my psychology.
Set your own stop based on:
How much you're willing to lose per trade
Your position size
Your personal pain threshold
If COIN breaks below $310, the thesis is invalidated. The 200 MA failed. Buyers lost control. We exit, regroup, and find the next heist. No ego. No revenge trading. Just discipline.
🎯 Target Acquisition — Where We Take the Bag
Primary Target: $430 💎
⚡⚠️ WARNING: Resistance Fortress Ahead
At $430, we're walking into a battlefield:
Historical resistance = sellers have limit orders stacked
Overbought territory = indicators flashing red
Trap zone activated = late buyers will get liquidated here
What smart money does: Lock profits. Don't marry the trade. Don't get greedy.
Potential scenarios:
🟢 Strong momentum? Trail your stop and let winners run
🟡 Consolidation at $420? Take 50-75% off the table
🔴 Rejection at $430? Exit immediately, don't hope
(Thief OG's — again, this is MY target. You might want to exit at $400 for quick profits. You might want to hold for $450. Your rules. Your capital. Your consequences.)
🔗 Correlated Assets — The Bigger Picture
Don't trade COIN blind. Context is king.
Watch These Tickers:
BITSTAMP:BTCUSD & BITSTAMP:ETHUSD
Correlation: STRONG
COIN is basically a leveraged play on crypto sentiment. Bitcoin pumps = COIN pumps harder. Bitcoin dumps = COIN dumps harder. Always check the crypto market before entering.
⛏️ NASDAQ:MARA & NASDAQ:RIOT
Correlation: HIGH
Fellow crypto-exposed stocks. If they're ripping, COIN usually follows. If they're bleeding, stay cautious.
💳 SET:SQ (Block Inc.)
Correlation: MODERATE
Fintech + crypto exposure. Similar institutional money flows. Good confirmation indicator.
💵 TVC:DXY (US Dollar Index)
Correlation: INVERSE
Strong dollar = crypto weakness = COIN weakness
Weak dollar = crypto strength = COIN strength
Simple math. Don't ignore macro.
🔑 Key Insight: If Bitcoin is fighting resistance at $70K while COIN is trying to break out, one of them is lying. Read the room.
📌 Technical Breakdown — The Charts Don't Lie
✅ 200 SMA Support: Holding firm — institutional support level
✅ Heikin Ashi Reversal: Doji + bullish follow-through = momentum shift confirmed
✅ Volume Analysis: Accumulation on dips, not capitulation
✅ Risk/Reward Ratio: Solid if stops are honored and targets are realistic
⚠️ Resistance at $430: Real, tested, and dangerous — respect it
⚠️ Crypto Market Dependency: If BTC drops 10%, COIN drops 15%. Stay alert.
📢 Thief OG Community Rules
Never risk more than you can afford to lose — period.
Position sizing > entry price — manage your risk first, profits second.
Stick to YOUR plan — my plan is mine. Yours is yours.
Take profits — unrealized gains aren't real until you close the trade.
No FOMO, no revenge trades — discipline beats emotion every time.
✨ If you find value in my analysis, a 👍 and 🚀 boost is much appreciated — it helps me share more setups with the community!
#COIN #Coinbase #SwingTrading #DayTrading #ThiefStrategy #CryptoStocks #TechnicalAnalysis #PullbackSetup #HeikinAshi #200MA #NASDAQ #BullishSetup #LayeredEntry #RiskManagement #SmartMoney #PriceAction #TradingView #StockMarket #SwingTrader

OPEN: Time to Accumulate? Layer Entry Method Explained🎯 OPEN: The Heist is ON! 🏠💰 Strategic Swing Trade Setup
📊 Asset Overview
Ticker: OPEN (Opendoor Technologies Inc.)
Exchange: NASDAQ
Trade Type: Swing Trade
Bias: 🐂 BULLISH
🎭 The Master Plan: "Operation Real Estate Robbery"
Listen up, fellow wealth redistributors! 👋 Opendoor's chart is screaming opportunity louder than a house alarm at 3 AM. We're setting up a classic layered accumulation strategy (aka "The Thief's Multi-Pocket Approach") to maximize our position while managing risk like professionals.
🚪 Entry Strategy: The Layered Infiltration Method
Primary Approach: Multiple Limit Orders (Ladder Strategy)
Instead of going all-in at one price (rookie move 😅), we're spreading our capital across strategic levels:
Recommended Entry Layers:
🎯 Layer 1: $6.50
🎯 Layer 2: $7.00
🎯 Layer 3: $7.50
🎯 Layer 4: $8.00
Flexibility Note: You can adjust the number of layers and position sizing based on your capital and risk appetite. Some traders prefer tighter layers ($0.25 increments), others go wider. Make it yours! 💪
Alternative: If you prefer simplicity, current market price entry works too, but layering gives you better average cost basis on dips.
🛡️ Risk Management: The Escape Hatch
Stop Loss: $6.00
⚠️ Important Disclaimer: This SL level is based on technical structure, but YOU are the captain of your own ship. Adjust based on:
Your risk tolerance
Account size
Market volatility
Personal trading rules
Risk Management Tip: Never risk more than 1-2% of your total capital on a single trade. Set your position size accordingly!
🎯 Target: The Grand Exit
Primary Target: $10.00
At this level, we're expecting:
🚨 Strong resistance zone
📈 Potential overbought conditions
Possible bull trap area
💰 Excellent risk-reward ratio
Scaling Out Strategy (Advanced Move):
Consider taking 30-50% profits at $9.00-$9.50
Trail stop-loss on remaining position
Lock in gains progressively
Remember: Nobody went broke taking profits! 💵 If the market gives you money, take it. Don't get greedy waiting for the "perfect" exit.
🔗 Related Assets to Watch
Keep these correlated symbols on your radar for confluence:
📍 $Z (Zillow Group) - Direct competitor in real estate tech, strong correlation with OPEN's price action
📍 BLACKBULL:RDFN (Redfin Corporation) - Another proptech player, moves in sympathy with sector sentiment
📍 NASDAQ:EXPI (eXp World Holdings) - Real estate brokerage, broader sector health indicator
📍 AMEX:IYR (iShares U.S. Real Estate ETF) - Overall real estate sector strength/weakness gauge
📍 AMEX:XHB (SPDR S&P Homebuilders ETF) - Housing market sentiment indicator
Correlation Logic: When real estate tech and housing sectors show strength, OPEN typically benefits. Conversely, sector weakness can drag OPEN down regardless of individual fundamentals. Watch for divergences—they often signal important reversals! 🔄
📈 Technical Synopsis
This setup combines:
✅ Strategic layered entries for optimal positioning
✅ Defined risk with clear stop-loss
✅ Realistic profit target with strong R:R ratio
✅ Sector correlation awareness
✅ Flexible execution for different trading styles
The swing trade timeframe gives this setup room to breathe and develop, perfect for traders who don't want to be glued to charts all day! ⏰
⚡ The Bottom Line
This isn't financial advice—it's a strategic roadmap presented with personality! The "thief style" approach is all about:
🎯 Strategic positioning
🛡️ Risk management
💰 Profit-taking discipline
😎 Having fun while trading
Trade smart. Trade safe. Trade YOUR plan.
✨ If you find value in my analysis, a 👍 and 🚀 boost is much appreciated — it helps me share more setups with the community!
#OPEN #OpendoorTechnologies #SwingTrade #NASDAQ #StockMarket #TechnicalAnalysis #TradingStrategy #RealEstateTech #PropTech #BullishSetup #LayeredEntry #RiskManagement #TradingView #StockTrading #MarketAnalysis #TradingIdeas #SwingTrading #DayTrading

QUBT — Bullish Wave Formation or Another Trap Zone Ahead?🔬 QUBT – Quantum Computing Inc.
💸 Stock Market Profit Playbook (Swing / Day Trade)
🎯 Setup Overview
We’re looking at QUBT — the Quantum Beast of tech innovation 🧠⚙️.
The setup? A Bullish Breakout + Bullish Pullback combo that’s ready to roll if momentum confirms.
🧭 Trade Plan (Thief-Style Precision ⚔️)
💥 Breakout Entry:
If price breaks the previous neutral zone around $19.00, that’s your ignition switch 🔓 — buy above that zone once confirmation candle closes strong.
♻️ Pullback Entry:
Wait for the price to revisit the Triangular Moving Average (TMA) region near $13.00. If bulls defend that zone — that’s your wave start! 🏄♂️ Ride the bullish momentum from there.
💰 Thief Strategy (Layered Entry):
We thieves don’t chase — we layer. Place multiple buy limits like a pro sniper 🎯
First Layer ➤ $35.00
Second Layer ➤ $36.00
Third Layer ➤ $37.00
(You can extend your limit layers higher or lower based on your risk appetite and strategy.)
🛑 Stop Loss (SL):
This is my “Thief SL” @ $34.00 🧨 — but dear Ladies & Gentlemen (Thief OGs), this is not financial advice. Set your own SL based on your plan & comfort zone. Protect your pockets first, profits later! 💼
🎯 Take Profit (TP) / Target:
The Police Barricade awaits around $44.00 🚓 — strong resistance, overbought signals, and possible trap zone there!
So, our main escape point is $43.00, where smart thieves bag profits and disappear like smoke 💨💵
Note: Dear Thief OGs — I’m not recommending only my TP. Make your own move when you’re in profit.
🧩 Related Pairs / Market Correlation (For Cross-Eye Analysis 👀)
Keep these tickers in your radar when QUBT starts heating up 🔥:
NASDAQ:AMD → Tracks semiconductor + tech demand. If AMD rips, quantum stocks often follow the vibe! ⚙️
NASDAQ:NVDA → The AI overlord 👑 — any surge here can reflect positive sector sentiment toward compute innovation (including quantum).
CBOE:ARKQ → ARK’s innovation ETF 🚀 — often holds early-stage quantum exposure; its movement shows if deep-tech is gaining capital inflow.
NASDAQ:SOXX → The semiconductor index ETF. When it rallies, it confirms broad tech strength 🌐
When these tickers move in sync → that’s your quantum confirmation ripple 🌊
⚙️ How To Use This Setup (The Thief Way 🕶️)
Layer entries smartly, not emotionally.
🧠 Define SL & TP your way — mine’s just a reference.
💎 Manage exposure — if multiple layers trigger, scale wisely.
📈 Track volume + candle structure near breakout zones.
🕰️ Patience pays — let the setup prove itself.
✨ “If you find value in my analysis, a 👍 and 🚀 boost is much appreciated — it helps me share more setups with the community!”
⚠️ Disclaimer: This is thief-style trading strategy just for fun. Always DYOR (Do Your Own Research) before entering any trade.
#QUBT #QuantumComputing #StockAnalysis #SwingTrade #DayTrade #Breakout #Pullback #TradingStrategy #ThiefStyle #TechStocks #TradeSetup #ProfitPlaybook #StockMarket

Tesla - Falling DownThe bullish five-wave advance from Apr–Dec 2024 is complete.
Since Dec 2024, Tesla has been in a corrective phase.
Wave A (Dec 2024 - Apr 2025) was a five-wave corrective move.
Wave B (Apr - Oct 2025) formed a clear three-wave correction.
Sub-wave (C) correction is finishing. A brief upside attempt is still possible, but any short-term rise above 489 will likely make the subsequent decline of C deeper.
Tesla is in a major reversal zone.
A large wave C is expected, forming a five-wave impulsive decline to 210 or lower.
Summary:
A 50%+ decline in Tesla shares is expected in 2026.
---
Please subscribe and leave a comment.
You’ll get new information faster than anyone else.
---

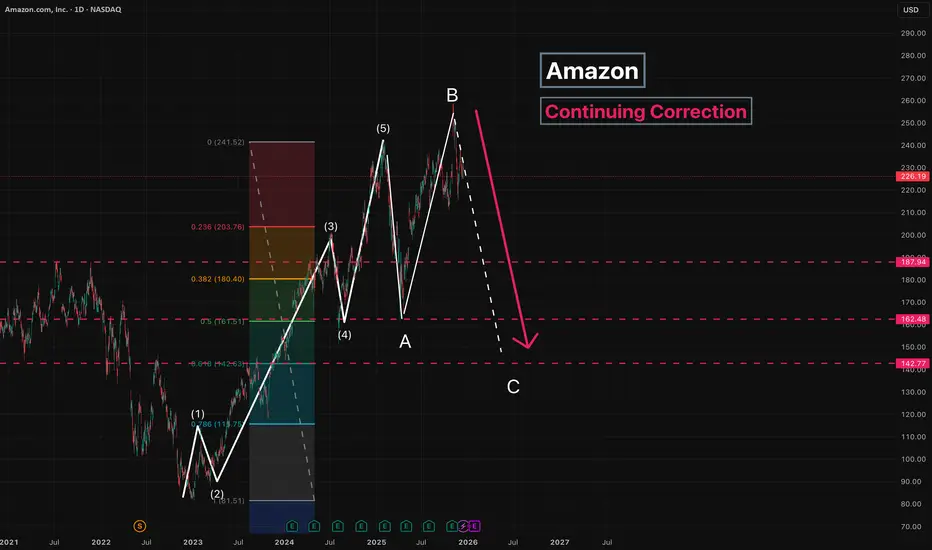
Amazon - Continuing CorrectionThe correction is ongoing, and wave C has started to form.
Since wave B is longer than wave A , wave C is expected to move below the low of wave A .
Main target: 142
Intermediate target: 187
---
Please subscribe and leave a comment.
You’ll get new information faster than anyone else.
---
US Tech 100 NASDAQ Structural Bearish Shift
IG:NASDAQ
Structural Bearish Shift Explained
Multi-Timeframe Price Action Breakdown (1D → 4H)
This analysis focuses purely on market structure, liquidity, and intention.
🔹 1D CONTEXT — MARKET STRUCTURE SHIFT
On the Daily timeframe, the market printed a clear bearish Market Structure Shift (MSS):
• The prior bullish sequence (HH → HL) was invalidated
• Price broke the key HL, officially changing the higher-timeframe flow
• This confirms a bearish structural bias on 1D
The critical detail is where the shift originated.
⸻
🔹 ORIGIN OF THE 1D MSS (KEY DETAIL)
The Daily MSS was caused by an internal high, not by a macro LH:
• This internal high was the impulsive driver that broke the Daily HL
• Once the HL failed, that internal high became:
• The origin of the bearish shift
• A high-probability liquidity pool
This distinction matters.
The market is not reacting randomly — it is respecting structural causality.
⸻
🔹 1D LIQUIDITY SWEEP = MITIGATION, NOT BREAKOUT
After the MSS, price returned precisely to that internal high and:
• Swept liquidity above it
• Took stops from:
• Early shorts
• Late breakout longs
• Failed to accept above the level
• Closed back below the sweep zone
This move is best defined as:
Daily mitigation of the MSS origin, not an attempt at bullish continuation.
No acceptance = no bullish intent.
🔹 4H CONFIRMATION — INTERNAL ALIGNMENT
Dropping to 4H, the lower-timeframe behavior aligns perfectly with the Daily narrative:
• A 4H bearish MSS printed
• Followed by a 4H BOS to the downside
• A clean bearish Fair Value Gap (FVG) was left behind
• Price expanded impulsively away from that imbalance
This tells us:
• The Daily mitigation triggered internal distribution
• Lower timeframes accepted the bearish flow
• Momentum is now aligned top-down
⸻
🔹 WHAT THIS TELLS US ABOUT MARKET INTENT
Putting it all together:
• ✅ Daily bearish MSS defines bias
• ✅ Liquidity above the MSS origin has been fully mitigated
• ✅ 4H structure confirms bearish continuation
• ❌ No bullish acceptance or expansion above key levels
This is not a failed breakout
This is a structural transition from accumulation to distribution
⸻
🔹 KEY TAKEAWAY
After a Daily Market Structure Shift, the market revisited the exact internal high that caused the shift, swept liquidity, failed to accept higher prices, and aligned lower-timeframe structure to the downside.
Bias: Bearish
Framework: Structure → Liquidity → Acceptance
Not financial advice.
AI Generated.

Nasdaq - The final blow-off top!⚰️Nasdaq ( TVC:NDQ ) can rally a final +25%:
🔎Analysis summary:
Just this month, we witnessed quite some volatility on the Nasdaq with a correction of about -10%. However, bulls immediately stepped in and clearly pushed price higher. Since there is still bullish pressure, a final blow-off top rally in the near future is quite likely.
📝Levels to watch:
$25,000 and $30,000
SwingTraderPhil
SwingTrading.Simplified. | Investing.Simplified. | #LONGTERMVISION

SPX to 6861 watch for vwap rejection and a liquidity grabPretty clear your going to form your bull flag in this inverse or break down into a lower one vwap is a good pivot and wathcing point

ZOOMing back to $160 $ZMZoom is already a solidly profitable, mid teens P/E on forward earnings and very strong gross margins versus large SaaS and tech peers.
Recent quarters have shown revenue growth reaccelerating from a low base.
Management has repositioned the company as a unified communications and AI centric platform
(ZOOM workplace, Phone, contact center, AI companion) broadening it's TAM beyond meetings and supporting upsell to existing enterprise customers.
Zoom has a strong balance sheet and robust free cash flow, which limits downside and offers buyback optionality.
#CupandHandle

USNAS100 | Bullish Above 25430 Toward 25835USNAS100 – Technical Overview
USNAS100 maintains a bullish momentum while trading above the key support zone at 25430, with the market positioned to extend upward toward the next resistance levels.
Technical Analysis
Above 25430:
The bullish structure remains intact, with upside targets at:
→ 25835
→ 25985
A breakout above 25985 may open the way for a broader continuation toward higher resistance zones.
Below 25430:
A 1H close beneath this level will shift momentum bearish, targeting:
→ 25210
→ 24810
This zone represents the next major liquidity area where buyers may attempt to re-enter.
Key Levels
Pivot Line: 25430
Support: 25220 · 24820
Resistance: 25835 · 25985

Robinhood pretends to chill, but the chart exposes its ambitionsRobinhood pretends to wander, but the chart already knows its destination
HOOD closed at 123.08 on the daily chart and is moving toward the buy zone 116.54–120.86, aligned with the ma100, which forms a strong demand area. As long as price stays above the intermediate support near 120.00, the bullish structure remains valid. The expected scenario is a controlled pullback into 116.54–120.86 followed by accumulation and a fresh upward impulse.
Once demand confirms, the first major resistance is 138–146. A breakout above that level opens the road to the primary target 180.36. Fibonacci aligns cleanly with the structure: 0.618 at 119.54, 0.5 at 123.86, 0.786 at 110.38 remain key tracking levels.
Fundamentally as of December 12 2025, Robinhood is delivering strong performance. Active users exceed 26.5M, trailing revenue is near 2B USD, and options revenue is up more than 18 %. Cash reserves surpass 5.7B USD with minimal debt. Robinhood Retirement, lending products and the fast growing Gold Membership continue expanding monetization. User activity remains high with more than 6M daily trades.
Price has not yet reached the demand zone, but volume behavior and moving averages suggest a strong upcoming entry point. Robinhood looks casual, but the chart hints that something bigger is brewing.

US100 – Bullish Reversal Setup-H4: Turning bullish with a new high at 25,667.
Pullback: Formed a lower high, now H1 shifting bullish again.
Plan: Looking for buys above 25,542, SL below last H1 LH.
Adjustment: If another H1 LH forms and breaks upward, trail SL for tighter risk.
-Fundamental: Shutdown-end hopes , supporting the bullish scenario.

XAU/USD | Gold smashes through the supply zone(READ THE CAPTION)Good morning folks, Amirali here.
As you can see, Gold smashed through the supply zone and it is now being traded in the 4270-4320 FVG zone.
I expect Gold to rise to 4320 level, and then a reaction before reaching the NDOG + LV of 4330 level. If Gold goes through this level, I expect to reach the bearish OB. Should it fail, a drop to FVG zone and consolidatiON there is expected.

25.12.12 Nasdaq AnalysisWelcome to Acid Trade.
Hello everyone, as of December 12th, 2025, I will be analyzing the Nasdaq chart today.
This is Acid.
15 Minute Chart Analysis
Let’s first review yesterday’s results.
In the previous video, I mentioned that a long position should be taken once the resistance trendline and the 25,566 level were broken.
That breakout occurred at the white circle, and from that entry, the market climbed approximately 152 points, resulting in a $3,000 profit.
For the short-side opportunity, the entry occurred when the rising trendline after the market opened was broken.
This sell signal appeared at the blue circle and led to a 186-point decline, giving a $3,720 profit.
Therefore, the total profit for December 11th was $6,720.
Daily Chart Analysis
Looking at yesterday’s candle (December 11), the price tapped the daily 20-EMA and bounced back, leaving a long lower wick.
Nasdaq is currently trading inside a previous volume zone, with the downside open toward 25,120 and potentially 24,945 if momentum continues lower.
Today’s Strategy
Today, Nasdaq temporarily broke below the short-term rising trendline, but this happened due to a pre-market gap-down, creating the yellow-box gap zone.
Because the sell-off was not strong and price action remains sideways, the market is effectively consolidating.
At the moment, Nasdaq is forming a larger box range:
Top: 25,879 forming a double top
Bottom: 25,400 forming a double bottom
A breakout from either side will likely determine the next major trend direction.
Today’s trading strategy should focus on identifying that breakout level and reacting once confirmation appears.
Conclusion
Nasdaq is moving within a key range between 25,879 and 25,400, and a breakout will define the next major trend direction.
Watch for a confirmed break with supporting volume before taking a position.
Today’s session is all about timing the breakout and reacting quickly.

MU - Continuing CorrectionWe are evaluating the chart from a technical perspective.
The correction is still in progress, and the structure suggests that wave C should begin forming.
Targets:
• First target: 225.5
• Second target: 192.5
---
Please subscribe and leave a comment.
You’ll get new information faster than anyone else.
---

Breaking: Adobe Forecasts Annual Revenue Above EstimateAdobe (NASDAQ; ADBE), forecast fiscal 2026 revenue and profit above Wall Street expectations on Wednesday, signaling strong demand for the Photoshop maker's design tools and increasing monetization for its artificial intelligence offerings.
Since the launch of ChatGPT in 2022, Adobe has made heavy bets on generative AI with its Firefly tool, which can be integrated across the company's Creative Cloud suite to create images and videos, in an attempt to draw users in.
Adobe is seeing strong growth in AI adoption, with monthly active users for its freemium offerings increasing 35% year over year to over 70 million, Says CFO Dan Durn.
"We're seeing significant strength in Creative Cloud Pro, Photoshop, Lightroom," he said, adding that natively embedding generative AI into these products is paying off.
In its push into the ad market, last month, Adobe said it would acquire Semrush (SEMR.N), opens new tab for $1.9 billion to help marketers better understand how their brands are seen by online consumers through searches on websites and GenAI bots such as ChatGPT and Gemini.
Technically, NASDAQ:ADBE stock is in a Diamond-like pattern characterised by a widening and then narrowing price range, creating a shape similar to a diamond. These pattern often provide us with a hint of market reversal points in the financial markets.
With RSI at 58 s little thrust from NASDAQ:ADBE stock to break the ceiling of the diamond could resort to a bullish reversal pattern in the long run.
Analyst Summary
According to 23 analysts, the average rating for ADBE stock is "Buy." The 12-month stock price target is $453.48, which is an increase of 32.16% from the latest price.
About ADBE
Adobe Inc. operates as a technology company worldwide. Its Digital Media segment offers products and services that enable individuals, teams, and enterprises to create, publish, and promote content; Document Cloud, a cloud-based document services platform; and Creative Cloud, a subscription service that allows subscribers to use its creative products and applications (apps) integrated with cloud-delivered services across various surfaces and platforms

Market Hunter: NASDAQ-NAS100 Sell OpportunityMy friends, Good morning!☀️
For US100-NAS100, I will open a SELL position between 24,988 and 25,243, targeting 23,843.📊
My friends, I share these analyses thanks to every single like I receive from you.
Your likes increase my motivation and make me want to support you in this way.🙏
I sincerely thank all my friends who support me with their likes.❤️

XAU/USD | A drop before a bullish move? (READ THE CAPTION)Good morning folks, Amirali here.
As you can see, last night with FOMC news, Gold price surged from 4194 all the way to 4238 before dropping again to 4204 and now it's being traded at 4214 level.
Gold is respecting the supply zone and has shown reaction to it multiple times. I expect Gold to challenge the supply zone again, should it fail to go through, a drop to 4160 to sweep all the sellside liquidity there and then again another upwards move for it to happen is likely.
