$GUTS (NASDAQ) — Weekly Reversal in ProgressAfter several months of consolidation followed by a sharp summer sell-off, GUTS is finally showing strong signs of recovery.
Last week’s candle closed decisively above the $1.60 – $1.70 supply zone, triggering a potential trend-reversal structure.
📌 Swing Trade Plan
📍 Entry: $1.85 – $1.90
🛑 Stop-loss: $1.58 (below the last bullish weekly candle)
🎯 Take-profit: $2.35 – $2.40
📊 Risk/Reward: ~1:2 ✔️
🔍 Technical Rationale
✔️ Strong breakout above resistance
✔️ Clear higher highs & higher lows structure forming
✔️ Positive reaction after earnings — bad news likely priced in
✔️ Rising volume confirming momentum and demand
⚠️ Invalidation Level
📌 A weekly close below $1.70 kills the bullish momentum and cancels the setup.
📢 Scenario Management
🔺 Plan will be updated in case of a breakout above $2.00
🔻 Or loss of $1.70, which would signal structural weakness
💬 This is just my personal market outlook — not financial advice.
If you enjoy this kind of analysis, drop a 👍 and follow for more weekly setups!
#Stocks #NASDAQ #SwingTrade #TechnicalAnalysis #PriceAction #Investing #StockMarket #ChartAnalysis #BreakoutTrading #MomentumTrading #ReversalPattern #VolumeAnalysis #MarketSetups #TradeIdeas
Nasdaq

Breaking: Victoria's Secret & Co. (VSCO) Reports Earnings ResultThe price of Victoria's Secret & Co. (VSCO) saw a notable uptick of 18% today gearing for a move to the $70 resistant amidst market turmoil.
Victoria’s Secret (VSCO) shares jumped on Friday after the lingerie retailer posted better-than-expected results and boosted its guidance as it cut back on promotions and raised prices.
The company reported a third-quarter loss of $0.46 per share, $0.13 lower than forecasts from Visible Alpha. Revenue increased 9.2% to $1.47 billion, also better than expected. Comparable store sales were up 5%. When including direct-to-consumer sales, they gained 8%.
Sales in North America increased 5.4% to $778 million, and direct-to-consumer sales rose 4.3% to $428.5 million. International sales jumped 33.5% to $264.8 million.
CFO Scott Sekella said adjusted gross margin grew 170 basis points, “driven by a reduced promotional approach and higher regular-priced selling, while leveraging the strength of our business model.” Victoria’s Secret remains “focused on managing costs while prioritizing investments in product innovation, brand strength, and customer experience,” he said.
The company raised its outlook for full-year adjusted EPS to between $2.40 and $2.65, and revenue to $6.45 billion to $6.48 billion. Previously, it anticipated adjusted EPS of $1.80 to $2.20, and revenue of $6.33 billion to $6.41 billion.
Financial Performance
In 2024, Victoria's Secret & Co.'s revenue was $6.23 billion, an increase of 0.78% compared to the previous year's $6.18 billion. Earnings were $165.00 million, an increase of 51.38%.
About VSCO
Victoria's Secret & Co. operates as a specialty retailer of women’s intimate, and other apparel and beauty products worldwide. It offers bras, panties, lingerie, casual sleepwear, apparel, sport, and swim products, as well as prestige fragrances and body care products; and loungewear, activewear, and accessories and beauty products under the Victoria’s Secret, PINK, and Adore Me brands.

Nasdaq : 24,000 Holds Strong — Next Stop 25,800?Price action on the Nasdaq 100 is telling a clear story: 24,000 (AVWAP + HVN confluence + Round number) is acting like a magnet for institutional buyers.
This suggests that accumulation is happening at these levels, positioning for a potential run toward 25,800 if momentum holds.
Are we front-running a breakout, or should we wait for confirmation above 25,000 first?

XAU/USD | Gold Update : Watching 4192 and 4240 Closely!By analyzing the #Gold chart on the 4 hour timeframe, we can see that price followed the previous analysis perfectly and hit the first target at $4240, even pushing slightly higher to $4242. After that move, gold pulled back and corrected all the way down to $4175. Right now gold is trading around $4192, which is basically a neutral zone with no clear direction yet.
We need to see whether price can climb back above $4240 again or not. One important point: if gold fails to hold above $4192 within the next hour, we might see another heavier drop. Keep an eye on the reaction to these key levels. I will update this analysis again soon.
Please support me with your likes and comments to motivate me to share more analysis with you and share your opinion about the possible trend of this chart with me !
Best Regards , Arman Shaban

Travere Therapeutics (TVTX) — Expanding Rare Kidney LeadershipCompany Overview
Travere Therapeutics NASDAQ:TVTX focuses on rare kidney & metabolic diseases, led by FILSPARI (IgAN) and Thiola (cystinuria)—a durable, high-margin franchise in a $10B+ nephrology market.
Key Catalysts
FILSPARI Growth: Q3’25 revenue $56M (+40% YoY) with accelerating prescriber adoption and expanding market penetration.
FSGS sNDA (2025): Positive Phase 3 data underpins label expansion; success could roughly double FILSPARI’s TAM.
Guidance Raised: FY revenue outlook $210–$225M, reinforcing operating momentum and margin leverage from a focused rare-disease model.
Why It Matters
✅ Category leadership in high-unmet-need nephrology
✅ Pipeline-driven upside via FSGS
✅ Attractive rare-disease economics (pricing, durability, margins)
Investment Outlook
Bullish above: $30–$31
Target: $60–$62 — supported by FILSPARI growth, potential FSGS approval, and sustained guidance momentum.

USNAS100 | Watching 25740 After Resistance ReactionUSNAS100 – Technical Overview
USNAS100 has already reached the 25730 resistance highlighted in the previous analysis.
For today, the index is expected to trade with bearish momentum while below 25740, with price likely to test 25570.
A 1H close below 25570 is required to confirm continuation of the bearish trend toward 25430.
However, if the market closes a 1H candle above 25740, bullish momentum will return, opening the way toward 25980 and higher resistance levels.
Key Levels
Pivot Line: 25740
Resistance: 25880 · 25985 · 26170
Support: 25570 · 25470 · 25330
previous idea:

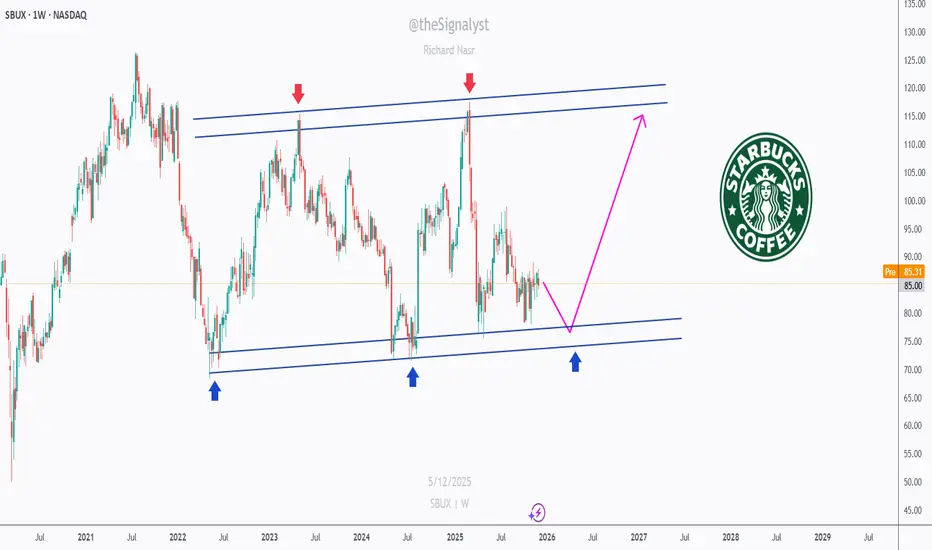
Starbucks at Support - Time to Brew a Bullish Move?📈SBUX has been moving inside a clean rising channel for years, respecting both the upper and lower bounds with precision.
⚔️Right now, Starbucks is retesting the lower bound of this long-term channel, a zone that has historically acted as a strong support (blue arrows).
As long as this area holds, we will be looking for trend-following longs, aiming for a continuation toward the mid and upper boundaries of the channel.📈
Nothing is confirmed yet, but this is exactly where buyers have stepped in many times before.
If the structure holds, the next bullish swing could already be brewing. ☕️
Do you think SBUX is ready for its next leg up? Share your thoughts below! 👇
⚠️ Disclaimer: This is not financial advice. Always do your own research and manage risk properly.
📚 Stick to your trading plan regarding entries, risk, and management.
Good luck! 🍀
All Strategies Are Good; If Managed Properly!
~Richard Nasr
Microsoft: Overvalued but Still Bullish - Watching the 400–450Microsoft NASDAQ:MSFT
1. Quick Trade Plan (for those who want levels first) 🎯
Market Bias: Long term bullish, but in a late phase of the cycle.
Strategy: Don’t chase highs; buy the correction.
📌 Buy Zones
Primary Buy Zone: 400–450 USD
Strong support cluster and the preferred accumulation zone.
Aggressive Early Entries:
450–470 on sharp dips, but main focus remains 400–450.
⛔ Invalidation Level
345 USD
A break below this level invalidates the mid term bullish structure.
🎯 Take Profit Targets
TP1: ~600
TP2: 680–720
Potential completion of the final fifth wave.
🧭 For Current Holders
Continue holding while above 345.
Use a protective stop below 345 if trading shares.
Options traders may hedge instead.
🆕 For New Buyers
Avoid entering near ATHs.
Wait for the 400–450 pullback.
Use 345 as your hard-risk level.
2. Fundamental Overview: Great Business, Clearly Overvalued 💼📊
Microsoft has delivered very stable mid-teens growth for years:
Revenue growth: 15–17 percent annually
EPS growth: also 15–20 percent annually
Last 3 quarters: EPS +9–12 percent, revenue in the same range
This is a mature mega-cap, not a hyper-growth name.
⚠️ Buybacks Stopped
Company regularly bought back shares for six years
Stopped in March 2023 and hasn’t resumed
This removes a major EPS-boosting engine
📉 Valuation (Peter Lynch style)
EPS growth ≈ 15 percent
P/E ≈ 30
Stock trades at ~2x its fundamental fair value
Conclusion:
Amazing business. Predictable. Cash generative. 🔥
But fundamentally overpriced and in the late stage of its growth curve.
3. Technical Picture: Still Bullish, but Late in the Cycle 📐📈
📅 Long Term Channel Since 2010
Price has stayed inside a massive uptrend channel for 14+ years.
As long as MSFT remains inside it, the primary trend stays bullish.
📏 200-Day Moving Average
MSFT consistently bounces from the 200d MA on the weekly.
That keeps the structural bull trend intact.
🌊 Elliott Wave Context
Currently in the 5th sub-wave of a larger 3rd wave
Upside still possible
Potential final wave targets: 600–700
⏳ What Comes After
Once this major wave completes:
Expect a multi-year sideways cycle (5–7 years) as the market distributes the massive positions accumulated since 2009.
4. Current Structure: A Correction Is Likely Before New Highs 🔄
We already saw an A–B–C correction, but structure suggests another A–B–C, forming a zigzag, before the final move higher.
🎯 Why 400–450 Is the Key Zone
Major liquidity & support cluster
Aligns with channel midline and prior consolidation
Perfect area for a 5th wave launch
If MSFT hits 400–450 and bounces → 600–700 is back on the table.
5. What To Do Based on Your Situation 🧭
✔️ If You Already Hold MSFT
Stay in the trade while above 345
Expect volatility
You can hedge or use a stop below 345
🟦 If You Want to Enter
Don’t FOMO near the highs ❌
Wait for a pullback into 400–450
Start with partial size, add on confirmation
345 = hard stop
⚡ If You Trade Short Term
Shorts are counter-trend
Treat every drop as a tactical move, not a macro reversal
Unless 345 breaks
6. Final Thoughts ✨
Microsoft is still in a powerful long term uptrend, but:
Fundamentally overvalued
Technically late stage of its long cycle
Likely to give a clean buyable correction
Best accumulation zone: 400–450
Invalidation: 345
Upside targets: 600–700
It’s a “buy the dip, not the rip” market for MSFT.
Not financial advice — manage risk according to your plan.

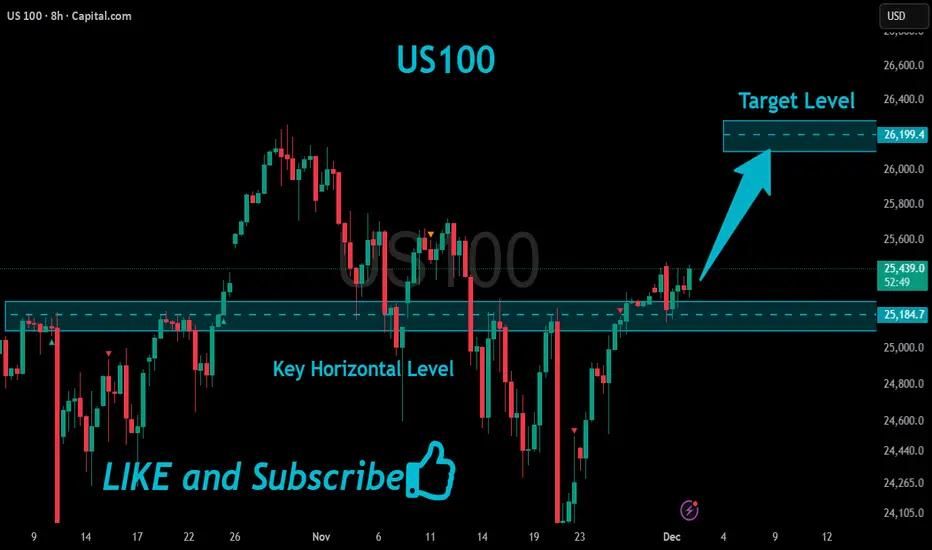
US100 Bullish Breakout!
HI,Traders !
#US100 is going up now
And made a bullish
Breakout of the key horizontal
Level of 25184.7 and the breakout
Is confirmed so we are bullish
Biased and we will be
Expecting a further
Bullish move up !
Comment and subscribe to help us grow !
Breeaking: Polyrizon Ltd. ($PLRZ) Gearing for 200% SpikeThe price Polyrizon Ltd. (NASDAQ; NASDAQ:PLRZ ) experience a notable spike of over 120% in early premarket trading on Thursday breaking out of a bullish symmetrical triangle .
The share price is enroute to the $20 resistant eyeing a whooping 200% spike today. last recorded RSI was 65 further cementing NASDAQ:PLRZ bullish momentum.
In another news, Polyrizon Ltd. (Nasdaq: PLRZ) announced compelling new preclinical data showing its proprietary naloxone hydrogel adheres to nasal tissue longer than an approved and marketed intranasal naloxone spray product.
The results showed that Polyrizon’s Trap and Target ™ (T&T) hydrogel exhibited significantly higher mucoadhesion levels compared to the commercial product, supporting potentially prolonged contact at the nasal deposition site and potentially enhancing bioavailability.
About PLRZ
Polyrizon Ltd., a biotech company, engages in the development of medical device hydrogels in the form of nasal sprays in Israel. The company uses its proprietary technology to develop its products comprising Capture and Contain, a barrier against a range of allergen particulates and viruses; and Trap and Target for nasal delivery of active pharmaceutical ingredients. It also develops PL-14, a nasal allergies blocker; PL-15 for COVID-19; and PL-16 for influenza blockers.

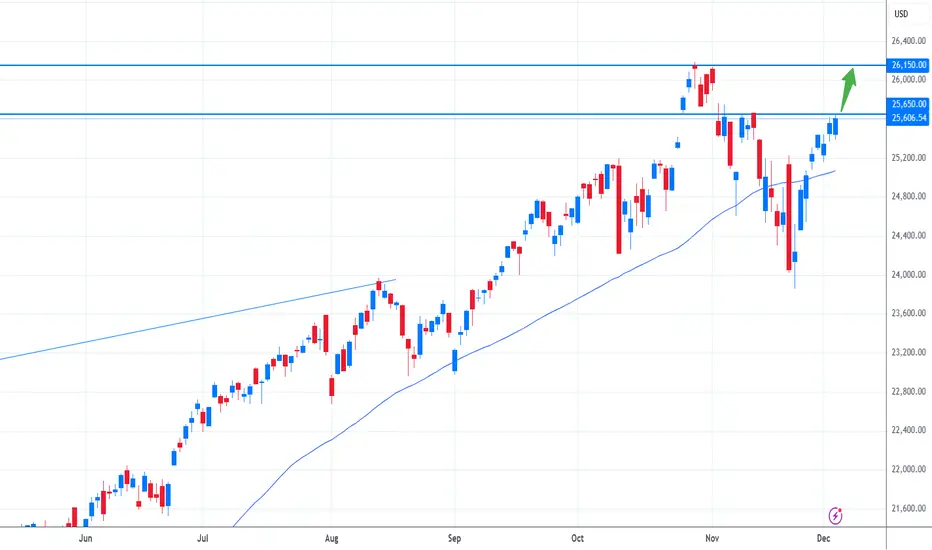
Nasdaq breakout around the corner?The Nasdaq is pushing higher as weaker US employment data boosts risk sentiment and fuels expectations that the Fed will move ahead with rate cuts. With softer labor figures reducing pressure on monetary policy, investors are rotating back into growth and tech names, supporting the broader index. The year-end rally narrative is strengthening as well, with many market participants positioning early for seasonal upside.
Lower Treasury yields are adding momentum, making equities relatively more attractive and encouraging capital to flow back into high-beta sectors. Corporate earnings remain solid in key industries, which helps stabilise sentiment after recent volatility. On top of that, easing geopolitical tensions and improved liquidity conditions are giving markets another tailwind. Market breadth has been expanding too, indicating that the upside is supported by more than just a handful of mega-caps.
From a technical perspective, the critical level to watch is the 25,700 zone. A clean break above this resistance could trigger further upside and potentially send the index toward its old all-time high. Until that breakout occurs, short-term pullbacks are still possible, but the broader setup continues to point toward a constructive outlook as long as the index holds above key support areas.
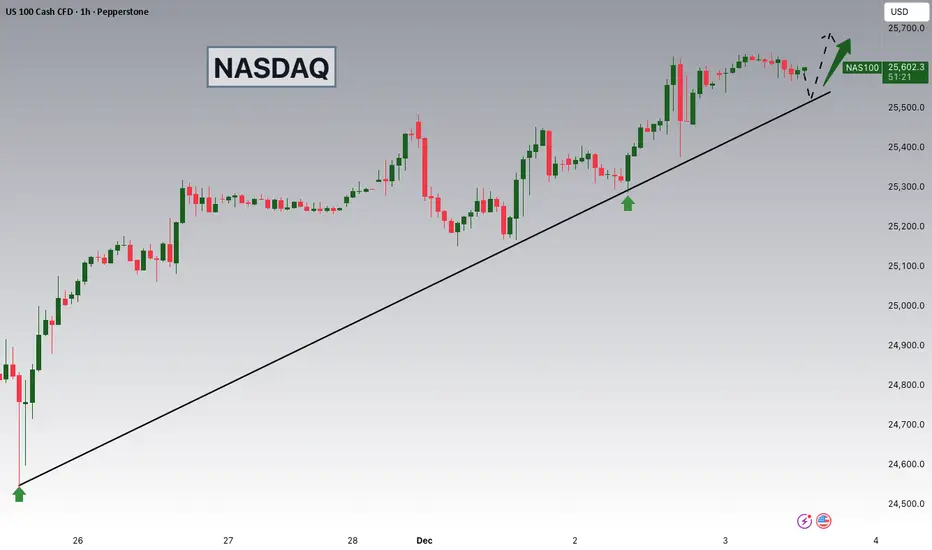
NASDAQ Potential UpsidesHey Traders, in today's trading session we are monitoring NAS100 for a buying opportunity around 25,520 zone, NASDAQ is trading in an uptrend and currently is in a correction phase in which it is approaching the trend at 25,520 support and resistance area.
Trade safe, Joe.
Netflix: Long-Term Buy Zone in Focus Netflix shares have recently turned lower, moving towards our previously identified long-term entry zone between $96.27 and $75.19. Within this range, we expect the low of the turquoise wave 4 to form, setting the stage for the ongoing upward impulse in wave 5 to push past resistance at $134.11. In a new alternative scenario, there is a 30% probability that the beige wave alt.IV could establish a lower low below $81.27, though it would still remain within the long-term entry zone

SPX - H4 - SELL SETUP - Supply Retest confirmedSPX has entered bear market territory last month and I expect a continuation to the downtrend from here onward. Based on many different macro indicators such as credit default swaps on big tech, macro regimes, sentiment and technical analysis. I see SPX falling off the clip from this precise supply zone

XAU/USD | Another Bullish Leg Possible! (READ THE CAPTION)By analyzing the #Gold chart on the 4 hour timeframe, we can see that price made a strong bullish jump today, pushing all the way up to $4264 before showing signs of exhaustion and pulling back. This reaction is typical after such an aggressive move, especially when price taps into short-term liquidity pockets and meets intraday supply zones.
Right now, TVC:GOLD is trading around $4228, which keeps the overall bullish structure intact. The key level to watch remains $4187, as long as price holds above this zone and doesn’t break it with a strong 4H candle close, the bullish scenario stays valid. This level is acting as both structural support and a demand area from the last impulsive move, so buyers will likely attempt to defend it.
As long as we stay above that support, we can expect the market to build another wave of bullish momentum. The next upside targets remain the same, with potential reaction zones at:
• $4240
• $4250
• $4260
• $4272
Each of these levels represents short-term liquidity pockets and minor supply areas where price may pause, react, or give another continuation setup. If bullish pressure stays strong, TVC:GOLD can attempt another push into the upper range after clearing intraday resistance levels.
Overall, the trend is still bullish as long as $4187 holds, and higher targets remain in play unless we see a deeper breakdown or a sharp shift in momentum.
Please support me with your likes and comments to motivate me to share more analysis with you and share your opinion about the possible trend of this chart with me !
Best Regards , Arman Shaban

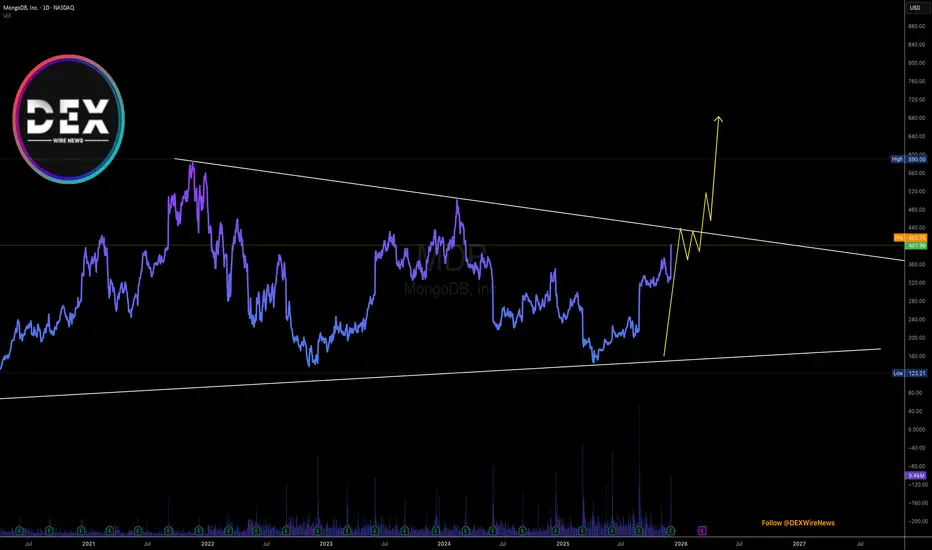
Breaking: MongoDB, Inc. (NASDAQ: $MDB) Spike 77% The price of MongoDB, Inc. (NASDAQ: NASDAQ:MDB ) surge 77% yesterday extending the gains to extended market and premarket trading sessions consecutively.
Currently up 22%, should the asset break the ceiling of the symmetrical triangle formed the stock might be eyeing the $500 resistant albeit market condition.
MongoDB Just Surged to a New 52-Week High, the company posted stronger-than-expected quarterly results and a solid forecast.
Shares of MongoDB soared nearly 80% Tuesday, a day after the company reported adjusted earnings of $1.32 per share on revenue that increased 19% year-over-year to $628.3 million.1 Analysts surveyed by Visible Alpha had expected $0.82 and $594.3 million, respectively.
Financial Performance
In 2024, MongoDB's revenue was $2.01 billion, an increase of 19.22% compared to the previous year's $1.68 billion. Losses were -$129.07 million, -26.91% less than in 2023.
bout MDB
MongoDB, Inc., together with its subsidiaries, provides general purpose database platform worldwide. The company provides MongoDB Atlas, a hosted multi-cloud database-as-a-service solution; MongoDB Enterprise Advanced, a commercial database server for enterprise customers to run in the cloud, on-premises, or in a hybrid environment; and Community Server, a free-to-download version of its database, which includes the functionality that developers need to get started with MongoDB.
Buy BiogenShort Term Trading Advice by Naranj Capital
Buy Biogen
● Buy Range- 178 - 180
● Target- 188 - 190
● StopLoss- Below 180
● Potential Return- 5-6%
● Duration- 12-14 Trading Days

DXY EXTREME BEARISH DIVERGENCE > ABOUT TO COME STRAIGHT DOWN!DXY Has been on a tear but I think thats about to end and I think it will end very quickly. There is multiple very strong bearish divergences on the weekly, across multiple indicators showing that a major move down is coming. I think we have reached the top for the DXY for a while and its about to tank. Dont know whats around the corner as far as news but something big is about to come out thats going to kill the DXY. This is not trading or financial advice this is just my opinion. If you apprecaite my work please consider giving this chart a boost and follow me for more updates. Thank you and good luck my friends.

GBP/USD | Clean Drop Hit Target, Now Setting Up for the Next MovBy analyzing the #GBPUSD chart on the 2 hour timeframe, we can see that price dropped exactly as expected and successfully hit the 1.32130 target, even dipping briefly to 1.3200. After that move, GBPUSD bounced and is now trading around 1.325.
I expect a small pullback first, but after that the pair could push higher toward the 1.328 area. This analysis will be updated soon.
Please support me with your likes and comments to motivate me to share more analysis with you and share your opinion about the possible trend of this chart with me !
Best Regards , Arman Shaban

XAU/USD What to look for? (Read the caption)Hey guys, Amirali here, let's drop an analysis today on the #Gold chart. As you can see, Gold managed to break through the supply zone, completely closing it and then falling all the way to $4181 before bouncing back to the $4200 channel. We must be careful now, as the price dropped below 4187. $4272 to $4320 FVG is yet to be touched, and is a range to be watched.
Sincerely, Amirali

NASDAQ NAS100 Analysis and My Trade Plan📊 Currently analysing NAS100 (NASDAQ), we can see that price has broken structure to the upside, confirming bullish intent. Right now, NAS100 is retesting the value area and the Point of Control (POC) on the volume profile — a critical zone to watch 👀📈
⚠️ Price action is a bit precarious. After a strong impulsive move, we’ve now seen a deep and aggressive retracement, which opens the door for potential bearish movement this week.
📆 However, my higher-timeframe bias remains bullish, with the weekly chart still supporting upward continuation.
📌 My plan:
If price holds above the current POC, then breaks and retests cleanly, I’ll be looking for long opportunities. If it breaks below the POC, I will step aside and abandon the long bias 🚫
This is not financial advice — just my personal market outlook. 💬📉📈

NASDAQ 100: Bullish! Look For Valid Buys With The Trend!Welcome back to the Weekly Forex Forecast for the week of Dec. 1-5th.
In this video, we will analyze the following FX market: NASDAQ (NQ1!) NAS100
The NASDAQ closed last week strong. It would indicated the potential for follow through going into this week, at least early.
Bear in mind that the previous 3 weeks were very bearish, coming down from ATHs, and forming a bearish MSS.
Look out for confirmations for valid trades. The overall trend is bullish, so I am personally looking for valid buys. A bearish MSS would invalidate those ideas.
Enjoy!
May profits be upon you.
Leave any questions or comments in the comment section.
I appreciate any feedback from my viewers!
Like and/or subscribe if you want more accurate analysis.
Thank you so much!
Disclaimer:
I do not provide personal investment advice and I am not a qualified licensed investment advisor.
All information found here, including any ideas, opinions, views, predictions, forecasts, commentaries, suggestions, expressed or implied herein, are for informational, entertainment or educational purposes only and should not be construed as personal investment advice. While the information provided is believed to be accurate, it may include errors or inaccuracies.
I will not and cannot be held liable for any actions you take as a result of anything you read here.
Conduct your own due diligence, or consult a licensed financial advisor or broker before making any and all investment decisions. Any investments, trades, speculations, or decisions made on the basis of any information found on this channel, expressed or implied herein, are committed at your own risk, financial or otherwise.

NAS100 — 25,458 Liquidity Sweep, Target Revised to 24,989The NAS100 has completed a clear liquidity sweep at 25,458, taking out the previous swing high before rejecting the zone. This move confirms that the breakout above 25,458 was only a liquidity grab, not a structural shift. As long as price remains below this swept level, the bias stays bearish.
The rejection from 25,458 suggests that the market has collected buy-side liquidity and is now positioned to move toward the opposite side of the range. The first reaction zone is 25,054, but this level is likely to act only as an intermediate pause. The true downside magnet is now 24,989, where a deeper liquidity pool resides (lows + imbalance).
Key Level
25,458 — Sweep Liquidity Zone (bearish invalidation if reclaimed)
Targets
25,054 — Interim level
24,989 — Main target
