NASDAQ Santa Rally already underway.Nasdaq (NDX) has made a strong V-shaped recovery on its 1D MA100, as projected on our previous analysis and is extending the uptrend above the 4H MA200 (orange trend-line).
The rally may need a relief pull-back towards its 4H MA50 (blue trend-line) but technically, the seasonal end-of-the-year 'Santa Rally' is already underway.
V-shaped recovery and Inverse Head and Shoulders patterns typically target their 2.0 Fibonacci extensions. That is currently at 26600.
---
** Please LIKE 👍, FOLLOW ✅, SHARE 🙌 and COMMENT ✍ if you enjoy this idea! Also share your ideas and charts in the comments section below! This is best way to keep it relevant, support us, keep the content here free and allow the idea to reach as many people as possible. **
---
💸💸💸💸💸💸
👇 👇 👇 👇 👇 👇
Nasdaq

5 Key Trading Tips for BeginnersWelcome back everyone to another post! In this article we will be explaining 5 key pointers (tips) for new individuals entering the trading space.
When it comes to trading first there is “ understanding ” before we begin the 5 keys steps. Let me assist you in understanding what will happen when you take on trading.
Trading is a challenge. Not a video game challenge, not a math test challenge – a * Challenge * One that will break you. Trading will break you mentally, physically, spiritually and financially. It is an eye-opening journey.
Trading will teach you a lot about yourself, and it will teach you a lot about discipline, patience and how you can analyze markets.
I saw a quote somewhere, it said trading: “ Trading is the hardest way, to make easy money ” and they are right.
You will be learning how to manage risk, control your emotions, understand your own decision-making patterns. These are all invaluable lessons for life, as well as trading.
Sounds great! But then there are the losses, what you lose to gain all this. Trading isn’t something that you can learn overnight – all those posts you see about a young 17-year-old “ cracking the code ” is rubbish. Why? Because they haven’t learnt life lessons.
You can make money fast, but you will lose it faster if you don’t know how to manage it.
Trading will drain every bit of energy out of you. You will feel like you’re falling behind, you will eventually collapse at every loss and become frustrated. The market will test you; the market doesn’t give a damn about you – you accept the risk when you take on trading and since you’re the one making the trades, it’s you VS you.
You’re testing yourself. You agree to test your patience, your confidence, your mindset. Doing so will make progress feel nonexistent or slow.
Every day, and every trade you will question yourself, wondering if “trading” is even for you. Sometimes it will feel like you’re going in circles. You will continue to make mistakes repeatedly. It will become exhausting but remember – only experience and your own strengths will allow you to succeed. Only those who can endure the grind without giving up will make it.
So, let’s start off the 5 key pointers that will prepare you.
1) Prioritize Risk Management Over Profits:
Most newbies focus first on “ making money ” rather than safeguarding capital. The reality is that surviving in the market is way more important than winning every trade you see or come across.
Key Points:
Determine risk per trade: A common rule is risking no more than 1-2% of your trading account on a single trade. This way even a string of losses will not wipe you out.
Always use stoploss: A defined maximum loss per trade enforces discipline and emotions to stay in check.
Position sizing: Your sizing should be proportional to what you’re willing to lose on each trade. Bigger trades amplify the losses, but they also amplify the profits.
Why it matters:
Without strong risk management, even a high win-rate strategy can fail. Protecting capital ensures you’re still in the game when opportunities arise.
2) Develop a trading plan and stick to it .
Random reactive trading is the best way to lose money. Build your plan overtime.
Key points:
Define your strategy: Building your strategy is the longest part, constant back testing and forward testing, refining and rebuilding. You’re not “switching” your strategy if you’re adding something small to it, you’re changing it if you eliminate the whole thing.
Identify your form of trades, short, mid, long term or swing trades.
Set clear rules: Don’t leave anything to chance, for example “I only enter trades if price closes above the 50ema and RSI is above 50”
Journalling trades: Ensure to journal all your trades, “How do I journal” Easy. Record the time, date, symbol, pair, what model/system you used, images, your entry, tp and exit, why and for how long you’ll have it open.
Why it matters:
Consistency is a key, it pairs with discipline, psychology and lingers with risk management. Traders who follow a disciplined system perform better than those to trade off an impulsive feeling. Other words “Gamble”
3) Master one market and one system first:
Beginners usually spread themselves too thin, trying forex, crypto, stocks and commodities all at once – Unfortunately for me I made this mistake at the start which made it very difficult! – Don’t do this. Stick to one market.
Key points:
Pick one market: Each market has its own rhythm, volatility, and liquidity. Teaching one thoroughly allows you to understand everything about it.
Focus on one system: Instead of trying every new system from you tubes or forums, master one approach and refine it onwards e.g. – you trade FVGs, Win rate is 50% once you add Fibonacci it might be e.g. 65%
Avoid information overload: Social media and trading forums are filled with conflicting advice, stick to your chosen approach and refine it. People say you need to have 12-hour trading days. If you do this, you will FAIL. You will grind yourself into the ground and face burnout making it very difficult to get back up again. Limit yourself to how much trading and trading study you do a day. Eg 10 back test trades, 3 real trades, 3 journaled trades, 1 hour of studying and researching the market.
Without strong risk management, even a high win-rate strategy can fail. Protecting capital ensures you’re still in the game when opportunities arise.
Why it matters
Depth beats breadth early on. Mastering a single market and system will allow you to build confidence and improve your edge.
4) Understand the Psychology of trading.
Trading isn’t just numbers: as mentioned in “understanding” it’s a test of emotional control, fear, greed and impatience.
Key points:
Emotions vs logic: ensure you recognize emotional reactions like FOMO (Fear of missing out) or revenge trading. Pause before reacting to a trade that will go against you.
Set realistic expectations : Markets move slowly. Sometimes for months, don’t expect huge gains overnight. Just like DCA focus on compounding. Compound your knowledge and skill set.
Mindset training: Techniques like medication and journaling as well as visualization can help reduce stress and maintain discipline.
Why it matters:
Even a diamond system can still fail if emotions drive your actions. Psychology often determines long term success, more than technical skill.
5) Prioritize learning. Then earning.
Beginners fall into the trap of trading being a “get rich quick” scheme. But the real investment is learning how the market works.
Key points:
Paper and demo trade first: Practice on demo accounts before you use real money – you will be surprised how many times you will fail. It’s better to fail with simulation money than your McDonalds weekly wage.
Review every trade: Analyze your losing trades, but also your winning trades. Find patterns and areas to improve.
Continuously educate yourself: Read books about the mind, about habits, watch market analysis but critically, apply what you learn and don’t just collect information and not use it.
Why it matters:
Earnings are just the byproduct trading. The faster you learn and adapt, the sooner your profits will appear. Treat early losses as tuition. Not failure.
Thank you all so much for reading.
I hope this benefits all those who are starting off their trading journey. If you have any questions, let me know in the comments below!

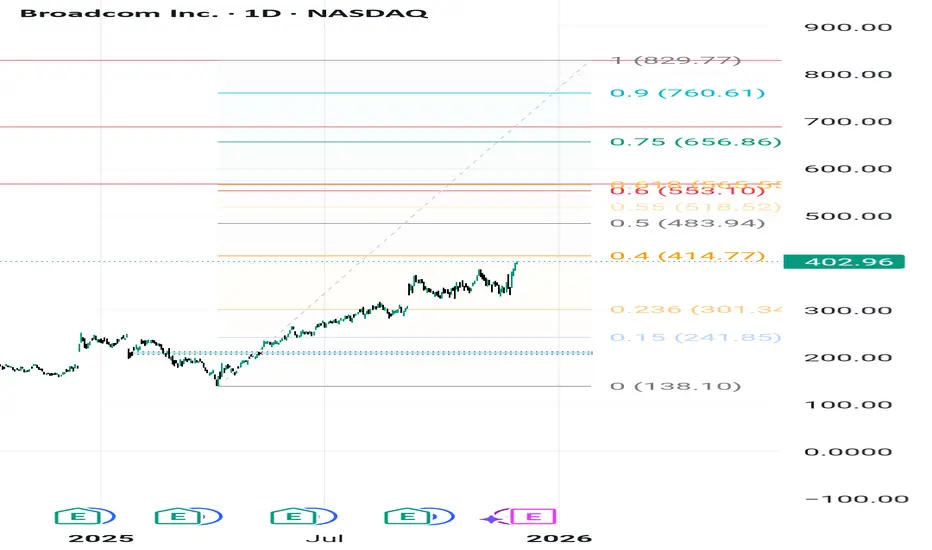
AVGO: Path to $829.77 – Navigating Critical Fibonacci Zones1. Overall Thesis and Price Structure
Broadcom Inc. (AVGO) exhibits a strong underlying bullish trend, fundamentally driven by demand for its AI chips and the successful integration of VMware. The technical objective targets a final high of $829.77. However, the path requires breaking through significant resistance levels defined by the Fibonacci structure. The current price is \mathbf{\$402.96}, maintaining the bullish momentum.
2. Crucial Resistance and Volatility Points
The analysis identifies two critical intermediate targets. The first and most significant hurdle is at $567.10, which aligns closely with the \mathbf{0.618} Fibonacci Golden Ratio. This zone is expected to trigger major volatility, profit-taking, and consolidation. The price action at $567.10 is the key test for trend continuity. Should the price break this level decisively, the next primary resistance target is $688.63, paving the way for the ultimate goal.
3. Key Support and Trend Invalidation
The long-term structural support, or the "Invalidation Point" for the bullish scenario, is the Key Zone at \mathbf{\$206.00}. As long as AVGO trades above this level, the multi-year uptrend remains valid. In the short term, the stock needs to overcome immediate resistance near $414.77 to gather momentum and continue its push towards the intermediate Fibonacci targets.
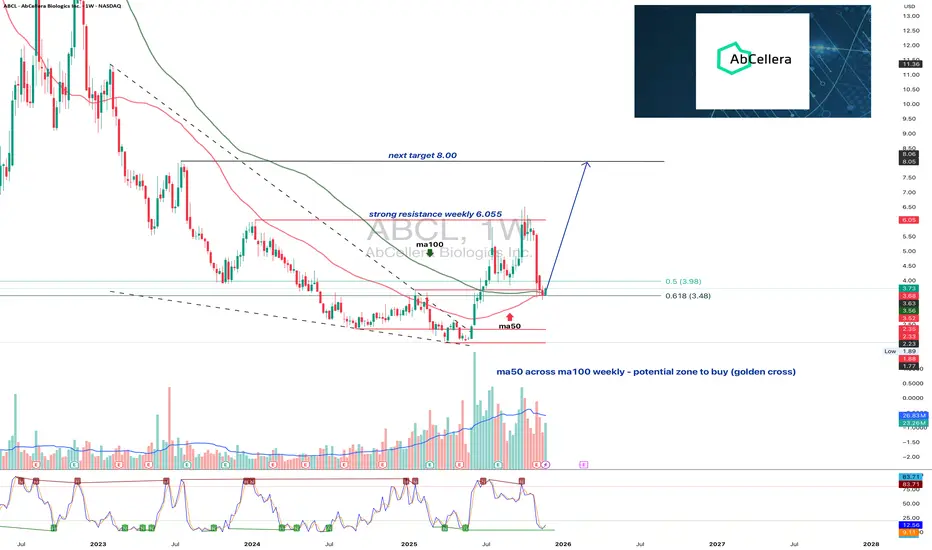
ABCL1W: turning around or just another biotech placeboABCL returns to key weekly support and prepares for the next move
ABCL has tested the strong weekly support zone between 3.48 and 3.98. This area combines Fibonacci retracement levels, a previous breakout retest and an important signal with ma50 crossing above ma100. Such a combination often forms a reliable accumulation zone. Buyers reacted immediately from this region which confirms active demand. The nearest key resistance is located near 6.05. A confident close above this level opens the path toward the next target at 8.00.
AbCellera operates in the biotechnology sector and develops advanced antibody discovery platforms for pharmaceutical partners. Revenue remains uneven due to milestone based payments. However the company maintains a strong balance sheet, significant cash reserves and a growing number of active programs. Improving sentiment in the biotech sector enhances the fundamental backdrop.
As long as price remains above the 3.48 to 3.98 area, the structure retains the signs of a forming medium term base. If this zone is lost, the market may shift into wide consolidation. The present reaction suggests that buyers are defending the level with confidence.
Support levels often speak louder than headlines. The chart usually warns long before the news arrives.
Just In: Nebius Group N.V. (NASDAQ; $NBIS) Spike 5.61% YesterdayThe price of Nebius Group N.V. (NASDAQ; NASDAQ:NBIS ) Spike 5.61% in Thursday's market trading extending the gains to premarket session on Friday.
NASDAQ:NBIX is up 2% in Friday's premarket session amidst growing interest in the AI tech giant.
For NASDAQ:NBIX , if it manages to break the ceiling of the wedge formed- that is the $170 resistance, NASDAQ:NBIX will be set for a move to the $200 pivot.
Similarly, failure to achieve that fit might resort to a drawback to the $90 range shaking weak hands before picking liquidity up.
Nebius have received a haircut of 40-60% in recent weeks.
NBIS stands out for the highest ARR projections and a lower forward P/S ratio than Iren.
AI hosting demand is likely still underestimated by Wall Street, and further large contracts add to the investment thesis.
We believe NBIS stock could rise significantly in 2 years and still trade at a fair valuation, supported by technicals, despite execution and broader economic risks.
About NBIS
Nebius Group N.V., a technology company, engages in building full-stack infrastructure to service the global AI industry in the Netherlands, Europe, North America, and Israel. The company offers Nebius builds full-stack infrastructure for AI, including large-scale GPU clusters, cloud platforms, and tools and services for developers. It also provides Toloka, a data partner for various stages of generative AI development; TripleTen, an edtech platform for re-skilling individuals for careers in technolgy; and Avride.

TSLA — Bullish Above 317.77, Targeting 544.53TSLA maintains a bullish structure as long as price holds above the key zone at 317.77.
This level represents the foundation of the current upward leg and serves as the invalidation point for the broader trend. As long as buyers protect 317.77, upside continuation remains the dominant scenario.
Price is currently reclaiming the 0.5 Fibonacci level at 424.43. A sustained close above this area strengthens bullish momentum toward 452.77 (0.618), followed by 472.47–484.48 (0.7–0.75). A breakout above these mid-range levels would open the path toward the major extension target at 544.53.
In a bearish scenario, price cannot break above the key support zone; any rally into it while trading below would be considered only a corrective bounce.
But as long as 317.77 holds, the primary outlook remains bullish.

USNAS100: 24760–24880 Range Controlling the MarketUSNAS100 | Technical Overview
U.S. stock index futures slipped slightly on Tuesday, cooling after a strong tech-led rally in the previous session.
Investors remain cautious as they await upcoming economic data and earnings releases that will offer clearer signals on the strength of U.S. consumer spending and overall market resilience.
Technical Outlook
The Nasdaq is currently consolidating between 24760 and 24880, awaiting a decisive breakout.
Bearish Scenario:
A 1H close below 24760 will activate a bearish leg toward 24575, and a break below that level opens the way toward 24365 and potentially 24150.
Bullish Scenario:
A 1H close above 24910 will confirm bullish continuation toward 25210, with further upside potential toward 25420.
Pivot Line: 24760
Support: 24575 · 24365 · 24150
Resistance: 25210 · 25420

Stocks Stage Comeback in Time for Thanksgiving. What's Behind ItIt’s Thanksgiving, and you know what that means. “Hey, sweety, why don't you come here and let us know how your high-beta stocks are doing. Here’s our little investor.”
And for once, the answer isn’t followed by a sigh. Stock traders are heading into the holiday with something they haven’t had in a while — gains and optimism.
Major US indices just logged their fourth straight day of gains, with the Nasdaq Composite on pace for its best Thanksgiving week since 2008.
That’s right: the last time the Nasdaq had a holiday rally this strong, we were still explaining what a “smartphone” was.
This year, it’s all about two things:
A dovish Federal Reserve
An AI trade that refuses to sit idle
Let’s carve into what’s driving this seasonal sprint.
📈 AI Fears Cool Off
The market has spent the past month wrestling with fears that AI stocks were puffing up like an overfilled Thanksgiving parade balloon. But this week, the anxiety faded.
Microsoft NASDAQ:MSFT , CoreWeave NASDAQ:CRWV , Dell NYSE:DELL , and even suddenly-revived AI-adjacent names have found solid footing again. The Nasdaq TVC:IXIC jumped 0.8% on Wednesday, outpacing the other indices and reminding investors that tech still runs this town.
What changed?
No new AI scandals and bubble talk
No shocking spending pivots (thanks, Meta NASDAQ:META )
No high-profile shorts announcing apocalyptic bets (thanks, Burry)
And some great data-center guidance in recent earnings ( thanks, Dell NYSE:DELL )
Even Nvidia NASDAQ:NVDA , which has been under the most scrutiny , clawed back 1.4% Wednesday — though the stock is still well off its early-month peak.
Investors are clearly reshuffling their AI winners, but the trade lives on. A shakeout doesn’t mean a shutdown.
🟩 Breadth Returns: Not Just a Tech Party
All but two sectors of the S&P 500 SP:SPX moved higher Wednesday, pushing the broader index up 0.7%.
The Dow TVC:DJI matched that performance, rising 315 points, with both indices tracking for their best Thanksgiving week since 2012.
Even the defensive sectors joined in. When utilities and consumer staples start partying with semiconductors and mega-cap tech, you know sentiment’s shifting.
🏦 The Fed Is Quietly Setting the Table
Just a week ago, the odds of a December rate cut were a coin toss — roughly 50/50 according to CME FedWatch. Today, that probability has surged to more than 80%.
What a cut could mean to traders:
Cheaper borrowing
Higher valuations
Softer financial conditions
And fewer landmines in the months ahead
Nothing gets markets into the holiday spirit like the smell of potential rate cuts.
This week is also shortened — stock markets are closed Thursday and shut early Friday (ref: the economic calendar ). With fewer trading hours to log, investors often front-load their optimism or their panic. This time, it’s mostly optimism.
🔄 Nvidia Isn’t Gone — It’s Just Taking a Breath
Nvidia’s stock remains sharply lower from its early November highs, but Wednesday’s move showed there’s still life in the AI leader.
Meta NASDAQ:META , Alphabet NASDAQ:GOOGL , and select cloud names have picked up flows as traders diversify their AI bets.
And while Nvidia might not be the main driver of the rally this week (spoiler alert: it’s Google ), its ability to stay positive helped prevent any emotional selling from spreading through tech.
🧁 The Warm, Lightly-Toasted Takeaway
If you were expecting a quiet, uneventful lead-in to the holidays — the market apparently had other plans.
Here’s where we’re at now:
A four-day winning streak,
A revival in Big Tech,
A broad rally across sectors,
And Fed expectations suddenly swinging toward cuts.
Off to you : Will it last through December? With inflation, rate decision, and jobs data, will AI stocks keep marching higher or retreat? Share your view in the comments and, to our US folks, enjoy Thanksgiving!

Micron Technology - The end will come soon!✂️Micron Technology ( NASDAQ:MU ) will create a top soon:
🔎Analysis summary:
Starting back in mid 2025, Micron Technology retested a major confluence of support. This retest was followed by an expected rally of about +250%. But soon, Micron Technology will create a short term top formation, followed by a healthy correction towards the downside.
📝Levels to watch:
$250
SwingTraderPhil
SwingTrading.Simplified. | Investing.Simplified. | #LONGTERMVISION

SPY - Potential Head & Shoulders And now we have this exhaustion pattern again. I went back and foruth on this yesterday. But in the final minutes a bought shorts again. The right shoulder can consolidate for a few days and the H&S can still be invalidated but I have this on my bucket list. I can´t sit on the sidelines on this one. If it happens, it will be legendary. With first strong support at 605

Nasdaq Rallies into Thanksgiving, Meta Bounce Kicks InWall Street sentiment has perked up on renewed Fed cut bets, with the Nasdaq leading the way. This has allowed Facebook to finally rally from support levels I highlighted 3 weeks ago.
Matt Simpson, Market Analyst at City Index.

NQ on Major Support Target 36,490Nasdaq 100 index is on major support since September. This is the area you want to buy and as it goes up take some profits if you want for a potential check back into support around early 2027 (green path).
There's the alternative scenario (orange path) that we just trend right up to 36,490 resistance and then have a major pullback to the long term trend. This one is less likely, but possible.
Either way if you sell some of your position (like shorter term options) in the middle of the range you're likely to be in a better position than holding the entire time as eventually that lower trend should get hit and that's a lot of time decay to ruin your positions.
Good luck!

Zscaler: Downward Shortly after our last update, Zscaler faced significant downward pressure—completely in line with our primary scenario. This move allowed the stock to turn lower in time, staying below the resistance at $340.25 and avoiding our alternative scenario of an early breakout above that level. However, a quicker peak for the turquoise wave alt.Y remains a possibility, as we still assign a 37% probability to such an accelerated sequence. Primarily, though, we expect further sell-offs as part of the magenta wave , which should eventually give way to renewed gains above the support at $164.78. With wave , the regular wave Y should then complete above $340.25.

DIS WEEKLY OUTLOOK!One of the best and easiest strategies when trading sideways markets…
I guess there’s no need for a long explanation the chart already speaks for itself if you know how to read it.
In trading or investing, you can never know where the market is going next. That’s exactly why we use charts: they show us solid levels where buying and selling makes sense. As you can see, DIS is still falling and as the saying goes, “never catch a falling knife.” If you buy here, you are taking unnecessary risk because this is the middle of the movement, not a confirmed reversal.
Technical analysis always teaches the same principle:
“Buy support, sell resistance.”
Right now I’m watching to see where this downward move stops. The $80–$85 zone is the main buying area, with a $77.44 stop-loss level. And I know what you’re thinking: “But what if the price doesn’t come down and reverses upward from here?
In that case, we simply wait.
If the price breaks above the $120 resistance, that level will turn into a strong support zone — and that breakout will also give us a clean buying opportunity. We don’t need to rush. We let the chart show us the solid levels.
Please ask yourself first: Are you a long-term investor or a trader?
If you are a trader, never enter a position without a proper setup, stop-loss, and take-profit target. Discipline is everything in trading.
And of course, this is not financial advice.

Cognex (CGNX) – Downtrend Breakout + Double Bottom ConfirmationOn the Weekly timeframe , NASDAQ:CGNX is showing strong bullish technical signals:
The long-term downtrend line has been broken both on body and shadow, confirmed with high volume .
The last weekly candle is forming near a retest, while on the Daily chart, a strong bullish candle confirms buyers stepping in.
A clear Double Bottom pattern has formed, with the neckline overlapping the downtrend line, providing stronger confirmation.
Price is trading above EMA50 & EMA100 , with EMA50 attempting a bullish cross over EMA100.
The stock has also broken through local resistance , opening the way for higher targets.
MACD is bullish, showing positive momentum.
RSI is already inside the overbought zone. However, since no divergence is present, this could still support bullish continuation, though short-term pullbacks are possible.
Key Levels:
If the breakout and retest confirm, the first target is the nearby resistance zone.
A further move towards the next resistance level (~$72–73) is possible if momentum sustains.
Important Note:
This analysis is not a buy/sell signal , but rather an educational outlook. While technicals are bullish, traders should remain cautious as RSI is in the overbought zone, where short-term corrections are common.
(For educational purposes only, not financial advice.)

QQQ long-term TAQQQ has broken mid-term uptrend, and it's currently in distribution phase, we have to give it some time to find the bottom, weekly uptrend is still in place.
P.S.
There are many other indicators that are being used for this TA, the above snapshot is only an example.

Nasdaq 100, USD Index: Thanksgiving PerformanceToday I’m digging into my Excel data to see how the Nasdaq and the US Dollar Index performed across the three trading days either side of Thanksgiving.
Matt Simpson, Market Analyst at City Index.

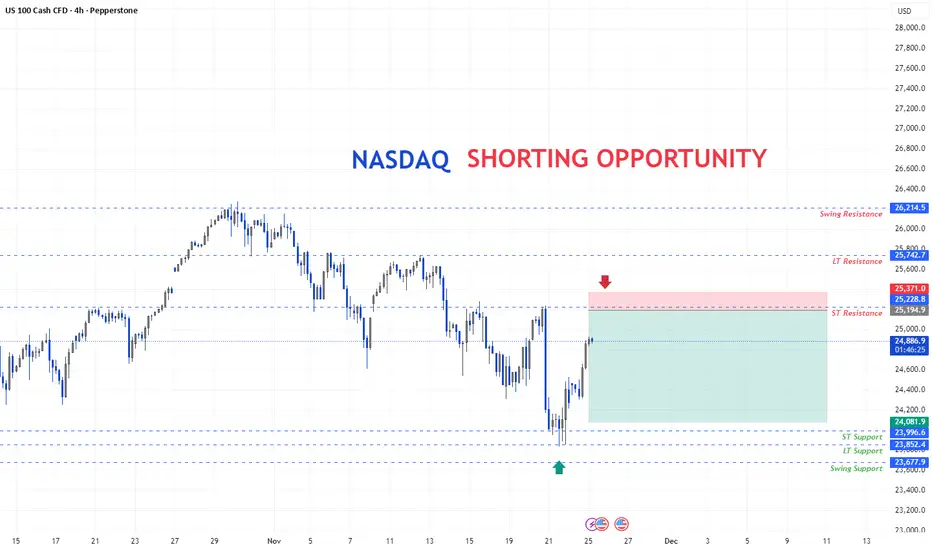
Nasdaq wait for the level for the short entry after market structure broken at the nasdaq, it give a sharp pullback, wait for the entry on the short side at the ST resistance.
NAS100 Future | The Bullish Liquidity RuTrading isn't about chasing green candles; it's about anticipating where the "smart money" needs to go to fill their orders. On this NAS100 1H chart, we are stalking a potential Bullish Model #1 setup by waiting for price to revisit the discount zone.
Here is the CRT (Candle Range Theory) breakdown of the projected path:
1. The Trap: Turtle Soup at CRTL 🐢
The chart projects a drop below the CRTL (Candle Range Theory Low) at 24,664. This is the classic "Turtle Soup" mechanic.
The Logic: As the book states, "Turtle Soup is when the market tricks traders by briefly breaking through a level, then reversing".
The Goal: Smart money needs to "run stops... below old lows" to accumulate a long position. We want to see price stab this low to trap late sellers.
2. The Confluence: Fair Value Gap (FVG) 🧲
Notice that the sweep of the lows aligns perfectly with a Bullish FVG (the grey box).
Why it matters: "When Model #1 appears with an FVG... it becomes even more powerful". This gap acts as a magnet to pull price down before the real expansion begins.
3. The Objective: CRTH 🎯
If the trap is set and price reclaims the level (confirming the reversal), the draw on liquidity becomes the CRTH (Candle Range Theory High) at 25,307.
The Cycle: Market moves from range to manipulation (Turtle Soup) to trend. The target is simply the opposing side of the range.
🧠 Trader's Mindset: "Patience is your greatest trading asset". Right now, the chart suggests we are in the waiting phase. Do not try to catch the falling knife. Wait for the sweep of the CRTL, look for the strong reaction (Model #1 confirmation), and then execute.
Disclaimer: This analysis is based on Candle Range Theory concepts for educational purposes. Past performance is not indicative of future results.
Next Step: Set an alert at 24,720. Are you watching for the sweep or buying the dip early? Let me know your plan below! 👇

ANNX 1D - pennant before the next impulse?On the daily chart, Annexon Inc. is forming a bullish pennant after a strong upward move — a classic continuation pattern often signaling the next wave of momentum.
The price remains above the 50-day and 200-day moving averages, with a golden cross confirming that buyers are still in control.
The key support zone is $2.70–2.90, while Fibonacci targets sit at $4.29 and $5.69 if momentum continues.
From a fundamental view , Annexon stays on investors’ radar as it develops treatments for neurodegenerative disorders - a risky but high-potential biotech niche.
Tactical plan: wait for a confirmed breakout from the pennant. If buyers push through, the uptrend could accelerate fast.
Remember - a golden cross doesn’t always mean golden profits, but it might this time.

Breaking: Enlivex Therapeutics (NASDAQ :ENLV) Spike 44% Today Enlivex Therapeutics Ltd. (ENLV) Spike 44% albeit market dip. The asset broke through the $0.85 support point to reclaim the $1 resistant.
With the RSI at 72, the asset is poised for a bullish continuation pattern should the share price break though the $1.30 resistant setting the pace to reclaim the $2 resistance point.
In another news, Enlivex Therapeutics Ltd. (NASDAQ: ENLV) today announced the appointment of Mr. Matteo Renzi, former Prime Minister of Italy, to the board of directors at Enlivex, effective November 24th. 2025.
Similarly, Enlivex Announces $212,000,000 Private Placement to Initiate World’s First Prediction Markets Digital Asset Treasury Strategy, via RAIN token Accumulation.
Analyst Summary
According to 2 analysts, the average rating for ENLV stock is "Buy." The 12-month stock price target is $7.0, which is an increase of 442.64% from the latest price.
About ENLV
Enlivex Therapeutics Ltd., together with its subsidiaries, operates as a clinical-stage macrophage reprogramming immunotherapy company in Israel. Its product pipeline is the Allocetra (ENX-CL-02-002), which is in phase II clinical trial for the treatment of organ dysfunction and failure caused by sepsis; and Allocetra (ENX-CL-05-001), which is in phase I/II clinical trial to treat moderate knee osteoarthritis.

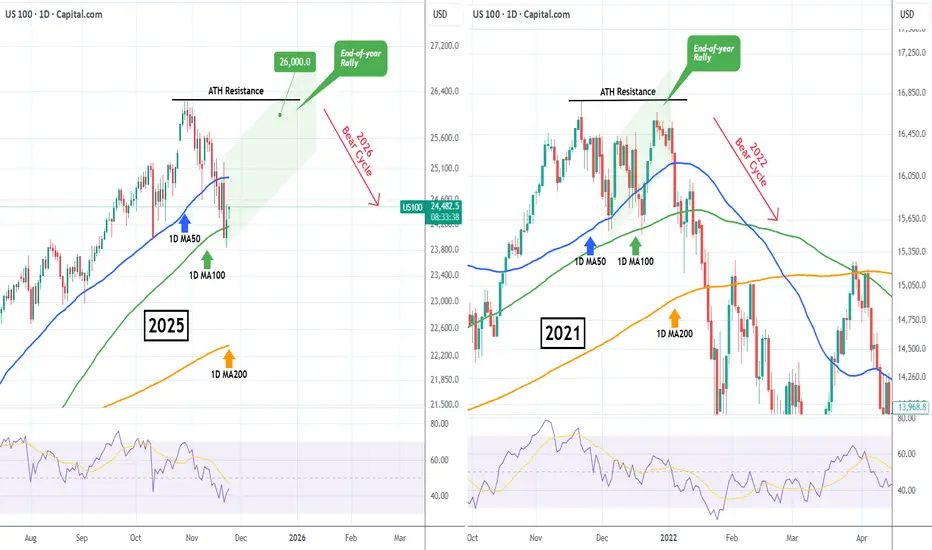
NASDAQ Santa Rally back to 26000 started?Nasdaq (NDX) rebounded on Friday after marginally breaching below its 1D MA100 (green trend-line) for the first time since May 09! The continuation today is a sign of a potentially strong rebound, the traditional end-of-year rally that is know as 'Santa's rally'.
Based on the 2021 Bull Cycle, which after touching its own 1D MA100 it started a final rally that almost tested its ATH Resistance, we can expect Nasdaq to now rise towards the end of the year to potentially 26000.
Could this be the last rally before a new Bear Cycle in 2026?
---
** Please LIKE 👍, FOLLOW ✅, SHARE 🙌 and COMMENT ✍ if you enjoy this idea! Also share your ideas and charts in the comments section below! This is best way to keep it relevant, support us, keep the content here free and allow the idea to reach as many people as possible. **
---
💸💸💸💸💸💸
👇 👇 👇 👇 👇 👇
Blue Bird Corporation (NASDAQ: $BLBD) Set for Earnings ReportBlue Bird Corporation (NASDAQ: NASDAQ:BLBD ) is schedule to report her earnings results today after market close. The asset has close Friday's trading session up 6% trading within the ceiling of the resistant zone at $60.
With the RSI at 65, a little thrust from the bulls will break the ceiling of the $60 resistant as more buyers step in.
The stock price has increased by +36.95% in the last 52 weeks. In the last 12 months, Blue Bird had revenue of $1.42 billion and earned $115.89 million in profits. Earnings per share was $3.49.
The 6 analysts that cover Blue Bird stock have a consensus rating of "Strong Buy" and an average price target of $63, which forecasts a 17.06% increase in the stock price over the next year. The lowest target is $50 and the highest is $71.
Financial Performance
In 2024, Blue Bird's revenue was $1.35 billion, an increase of 18.92% compared to the previous year's $1.13 billion. Earnings were $105.55 million, an increase of 343.25%.
About BLBD
Blue Bird Corporation, together with its subsidiaries, designs, engineers, manufactures, and sells school buses in the United States, Canada, and internationally. The company operates through two segments, Bus and Parts. It offers Type C, Type D, and specialty buses; and alternative power options through its propane powered, gasoline powered, compressed natural gas powered, and electric powered school buses, as well as diesel engines.
