Nasdaq - The final blow-off top!⚰️Nasdaq ( TVC:NDQ ) can rally a final +25%:
🔎Analysis summary:
Just this month, we witnessed quite some volatility on the Nasdaq with a correction of about -10%. However, bulls immediately stepped in and clearly pushed price higher. Since there is still bullish pressure, a final blow-off top rally in the near future is quite likely.
📝Levels to watch:
$25,000 and $30,000
SwingTraderPhil
SwingTrading.Simplified. | Investing.Simplified. | #LONGTERMVISION
Nasdaq100

Nasdaq 100 Chart Analysis After the Fed DecisionNasdaq 100 Chart Analysis After the Fed Decision
The Nasdaq 100 index showed sharp volatility yesterday following the interest rate announcement. The market action can be interpreted as follows:
→ First, the FOMC decision was released: as expected, the Federal Funds Rate was cut from 4.00% to 3.75% (a bullish catalyst), which pushed the index up towards point A.
→ However, half an hour later Jerome Powell’s press conference began, and his tone was noticeably hawkish (a bearish catalyst). The Fed Chair signalled that the rate-cutting cycle has been paused because inflation remains elevated and additional labour-market data is needed. As a result, the index fell sharply from point A to the low at point B.
Meanwhile, Donald Trump criticised the Fed’s decision, arguing that rates should be cut far more aggressively. This adds to uncertainty, especially given expectations that Powell will leave his post in May 2026.
Bearish pressure on the tech index intensified further after Oracle’s earnings release — see yesterday’s post for details. The results disappointed investors, fuelling renewed talk of an AI bubble, and ORCL shares plunged around 11% in after-hours trading.
Technical Analysis of the Nasdaq 100 Chart
Looking at recent price action in the Nasdaq 100, the index appears to be forming a bearish Rounding Top pattern:
→ The peak at point A resembles a bull trap, as the price only slightly exceeded the December highs before reversing — in SMC terms, a sign of a bearish liquidity grab.
→ The price then broke support from several recent sessions around 25,570 after forming a large bearish candle (marked by the arrow). This indicates strong selling pressure (a market imbalance) and the area may now act as resistance.
It is possible that bulls will attempt to recover some of yesterday’s losses today. However, if any rebound stalls near this resistance zone, the Nasdaq 100 may continue to drift lower along a rounding downward trajectory.
This article represents the opinion of the Companies operating under the FXOpen brand only. It is not to be construed as an offer, solicitation, or recommendation with respect to products and services provided by the Companies operating under the FXOpen brand, nor is it to be considered financial advice.

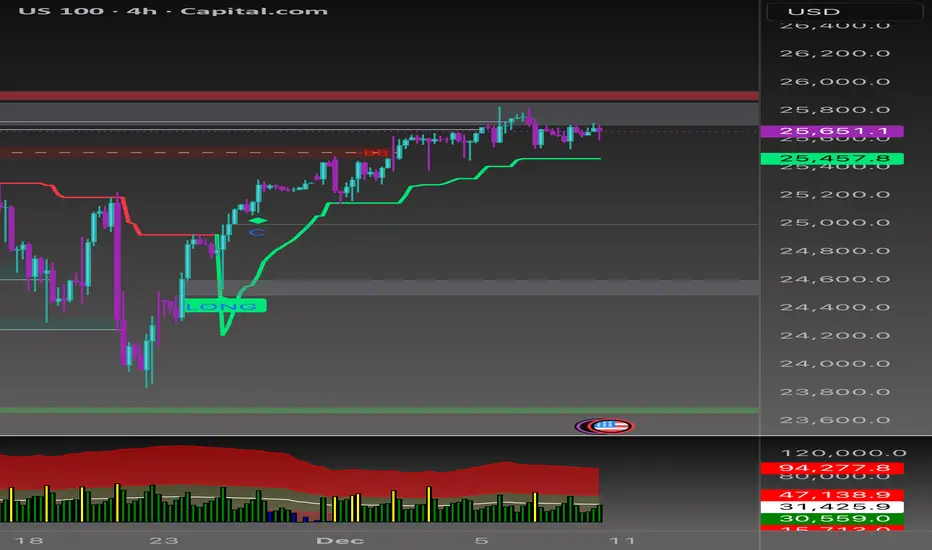
Distribution or Reload?CAPITALCOM:US100 keeps grinding inside the same premium band we’ve been tracking.
The 4H chart shows price repeatedly tapping into the premium PD arrays but failing to secure a clean breakout. Buyers are active, but they’re not strong enough to reclaim the upper liquidity shelf.
Your OG system reacted cleanly again:
• TrendMaster (4H) held as dynamic support on every dip, but it’s starting to flatten, showing we’re consolidating at the top.
• FlowMaster is printing reduced momentum on the latest pushes into premium zones.
• ScalpMaster (15M) nailed the intraday rejection perfectly, marking early short signals right after the PD Array tap.
Overall, price is respecting every OG zone point to point.
🟣 Short-Term View (15M–1H)
Structure is still choppy inside the premium band, but intraday momentum favors a corrective move.
Short bias unless 25,700 is reclaimed with strength.
Targets to the downside:
• 25,640
• 25,610
• 25,580 liquidity pocket
Invalidation
• A clean break and hold above 25,700 would switch intraday flow back into premium expansion.
🔵 Mid-Term View (4H)
Higher-timeframe trend remains bullish overall, but we’re extended into premium territory and showing early signs of distribution.
As long as TrendMaster holds above
25,450–25,500, bulls maintain control
on the midterm.
A deeper pullback into discount arrays would actually be healthy before the next leg up.
Midterm targets if discount is tapped:
• 25,300
• 25,150
• 25,000 major demand zone
A breakout above 25,780 would unlock continuation toward new highs.
📌 Summary
US100 is compressing at the top.
Your OG system is showing exhaustion on premium taps, favoring short term corrections while the mid term trend stays bullish until key support breaks.
Perfect environment for reactive trading:
Fade premiums intraday, accumulate in discounts on the HTF.
Breaking; Aimei Health Technology Co., Ltd (AFJK) Spiked 1000%The price of Aimei Health Technology Co., Ltd (NASDAQ: NASDAQ:AFJK ) saw a noteworthy uptick of 1000% in yesterday's market session. However, the reign was short-lived as the asset is down 45% in premarket trading today.
The last recorded RSI is 93, which is clearly overbought setting the stage for a cool off to the $50 support zones.
About AFJK
Aimei Health Technology Co., Ltd does not have significant operations. The company intends to effect a merger, share exchange, asset acquisition stock purchase, reorganization, or similar business combination with one or more businesses. It also intends to acquire small cap businesses in the biopharmaceutical, medical technology and device industries, as well as in the diagnostic and other services sector. Aimei Health Technology Co., Ltd was incorporated in 2023 and is based in New York, New York.

NAS100 Retest of POC: Bullish Break or Deeper Correction?I'm keeping a close eye on NASDAQ (NAS100) right now 📉📈. We’re seeing a deep pullback—a strong retracement that makes everyone ask the classic question:
Does this want to keep pushing lower and give us a bearish weekly candle, or is it gearing up to hold a level and rally back with the higher-timeframe trend?
For me, I’m a trend-continuation trader. Even if the weekly candle prints bearish, I’m not interested in selling into higher-timeframe strength. I’d rather stay patient and stick with the bigger trend direction 🧭.
Here’s the key level I’m watching:
If NAS100 can break back above the Volume Profile POC (Point of Control) — which is basically the high-value area acting as support right now — then I’ll be looking for long opportunities.
But if price breaks below the POC, that invalidates the idea and I’ll step aside. No need to force anything 👍.
Not financial advice ⚠️

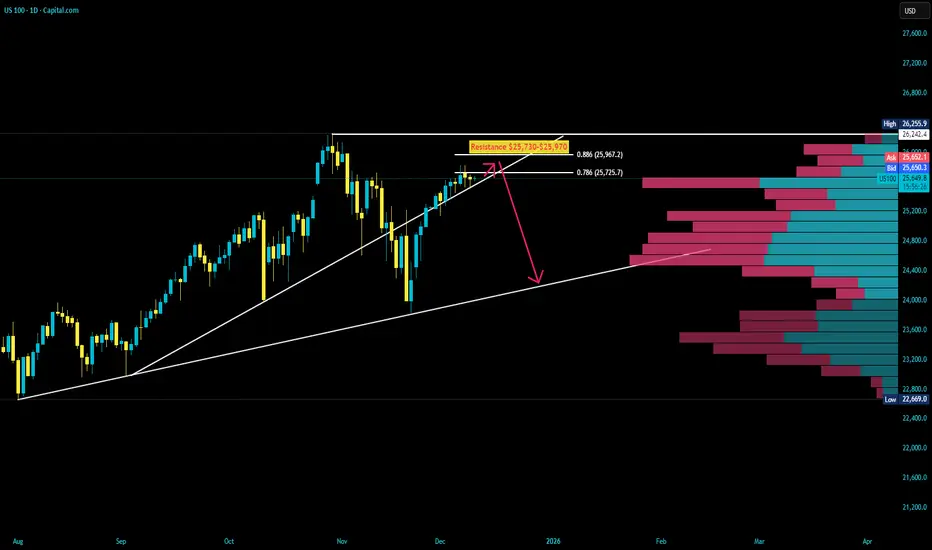
US100 Resistance AheadUS100: Tough resistance zone at 25,730–25,970. If price fails to hold above 25,730 after today’s FOMC decision, a sharp sell-off toward 24,200 becomes highly probable.
NQ1! — Fed Week: 25,650 Inflection | Tight Decision📊 NQ1! NASDAQ 100 E-MINI FUTURES
December 9, 2025 | by officialjackofalltrades
🟡 CAUTIOUS |Fed Week Special Edition
EXECUTIVE SUMMARY - THE PRE-FED SETUP
Current Price: $25,651.50 | Date: December 9, 2025 | Change: -$48.25 (-0.19%)
The Nasdaq 100 E-mini futures are consolidating in a tight range between 25,000-26,300 as markets brace for tomorrow's Federal Reserve decision. After December E-mini Nasdaq futures rose +0.10% on Tuesday, the index is now sitting in a critical decision zone with massive implications for tech stocks.
The Technical Picture:
Pattern: Range-bound consolidation (4 weeks)
Current Position: Middle of range at 25,650
Resistance: 26,200-26,300 (tested multiple times, rejected)
Support: 24,700-24,900 (solid floor since November)
Key Level: 25,200 (bull/bear line)
The Fundamental Backdrop:
Big Tech was mixed at the close: Amazon booked a modest gain, while Apple, Meta and Microsoft finished slightly in the red. More importantly, These industry titans have consistently outpaced the broader S&P 500, with the S&P 500 Top 10 rising over 600% in total since January 1, 2016.
But here's the tension: AI capex coming from tech companies listed in the S&P 500 is $400 billion or more per year, going forward. The biggest AI company OpenAI has disclosed revenues of just $13 billion for 2025.
The Trade: Long from 25,200-25,600, target 26,500-27,200, stop 24,650. Risk/reward: 1:2.5 .
MARKET CONTEXT - WHAT'S REALLY HAPPENING
The Pre-Fed Paralysis
Stock indexes gave up early gains and settled mixed on Tuesday as bond yields climbed after the Oct JOLTS report showed job openings unexpectedly rose to a 5-month high.
This is classic pre-FOMC behavior : markets waiting for the catalyst before committing.
Investing.com - U.S. stock futures inch down ahead of the start of trading for December, with investors keeping tabs on a possible rate cut.
The AI Valuation Debate
Here's what's creating the consolidation: AI optimism vs. valuation concerns .
BULLISH CAMP:
Nvidia leads the tech sector with a market cap of $4.4 trillion
24/7 Wall St. forecast projects Nvidia revenue rising from $121 billion in 2025 to more than $265 billion by 2030
For the Mag 7 group, total earnings are expected to increase by +12.6% on +9.5% higher revenues in 2025
BEARISH CAMP:
OpenAI may have lost $12 billion in the third quarter of 2025 alone, according to a disclosure by Microsoft
806 Russell 2000 companies (40%) have no earnings or negative earnings
The revenues currently being generated by AI companies are far smaller than the amount of capex being directed at them
My Take: This is why NQ is stuck in range. Bulls see AI growth, bears see bubble. Fed decision tomorrow will tip the scale.
TECHNICAL ANALYSIS - THE RANGE-BOUND BATTLE
Pattern: Consolidation Rectangle (4 Weeks)
Your purple boxes perfectly capture the support/resistance clusters . Let me break down what the chart is telling us:
Key Technical Levels:
🔴 RESISTANCE (Selling Zones):
26,200-26,300: Tested 4 times since November, strong rejection zone
26,500-26,700: If we break above, this is next target
27,000-27,200: Extension target if Fed is dovish
🟢 SUPPORT (Buying Zones):
25,200-25,400: Minor support, current price zone
24,900-25,100: Major support cluster (your bottom purple box)
24,700-24,800: Absolute floor, tested Nov 19
24,300-24,500: Nuclear support if range breaks
Current Position: The Nasdaq 100 Futures price has ranged from 25,657.50 to 25,693.75 today extremely tight range showing indecision.
Technical Indicators:
Moving Averages:
50-day MA: ~25,400 (acting as support)
200-day MA: ~24,200 (long-term uptrend intact)
Golden Cross: Active since October = bullish
Volume:
The current trading volume for Nasdaq 100 Futures is 6,395 very low , typical pre-Fed paralysis.
RSI:
Currently: ~52-55 (neutral)
Not overbought (room to run)
Not oversold (no panic)
MACD:
Flat, coiling for breakout
Waiting for directional catalyst
SCENARIO ANALYSIS - THREE FED OUTCOMES
SCENARIO A: Dovish Cut (55% Probability) - BULLISH
What Happens:
Fed cuts 25bps ✓
Dot plot shows 3-4 more cuts in 2026 ✓
Powell emphasizes "labor market concerns" ✓
Tech gets green light to continue AI spending ✓
Market Reaction:
Immediate: NQ pumps 1.5-2% to 26,000-26,200
Day 1-3: Breakout above 26,300, test 26,700
Week 1-2: Rally to 27,000-27,500
Month 1: Target 27,800-28,200 (+9-10%)
Winners:
Nvidia (NVDA), AMD (AMD), Broadcom (AVGO) lead
Mag 7 outperform
High-growth tech rallies hard
Trade Setup:
Enter: Current 25,650 OR breakout above 26,300
Add: On pullback to 26,000 after breakout
Target: 27,500 (+7.2%)
Stop: 25,100 (-2.1%)
Risk/Reward: 1:3.4
SCENARIO B: Hawkish Cut (35% Probability) - CHOPPY
What Happens:
Fed cuts 25bps ✓
BUT dot plot shows only 1-2 cuts in 2026 ❌
Powell says "inflation still concerning" ❌
Tech valuations questioned ❌
Market Reaction:
Immediate: NQ drops 1-1.5% to 25,200-25,400
Day 1: Volatility, test 24,900 support
Week 1-2: Choppy recovery to 25,800-26,000
Month 1: Grind back to 26,200-26,500 (+2-3%)
Losers:
High-valuation AI stocks hit hard
Stocks with high capex vs. revenue scrutinized
Small caps underperform
Trade Setup:
DO NOT chase before Fed
Buy: Dip to 24,900-25,100 (support)
Target: 26,000-26,300 (+5-6% from dip)
Stop: 24,650 (-2%)
Risk/Reward: 1:2.5
SCENARIO C: No Cut OR Very Hawkish (10% Probability) - BEARISH
What Happens:
Fed HOLDS at 3.75-4% ❌
OR cuts but says "this is the last one" ❌
Powell cites AI bubble concerns ❌
Tech sell-off accelerates ❌
Market Reaction:
Immediate: NQ crashes 2-3% to 24,700-25,000
Day 1: VIX spikes, panic selling
Week 1-2: Test 24,300-24,500
Month 1: Bottom around 23,800-24,200 (-7-8%)
Trade Setup:
Exit ALL longs immediately
Wait for capitulation
Buy: 24,000-24,300 (major support)
Target: Recovery to 25,500-26,000 (+6-8%)
High stress, high reward
THE TRADE SETUP - PROFESSIONAL EXECUTION
🟢 PRIMARY LONG SETUP: BUY NQ1!
Entry Strategy (Scale In):
Option A: Conservative (Wait for Dip):
25,000-25,200 (IF hawkish dip)
24,800-25,000 (IF deeper dip to support)
Best for: Risk-averse traders
Stop Loss: 24,650 (HARD STOP)
Below 24,650 = range break on daily
Below this = technical structure invalidated
Max loss from 25,650 entry:
Take Profit Targets:
TP1: 26,200-26,500
Range breakout + resistance retest
Action: Take 40% profit, move stop to 25,200
Gain: +2.1-3.3% | Risk/Reward: 1:2
TP2: 27,000-27,500
Momentum continuation post-Fed
Technical indicators show Strong Buy signal
TP3: 27,800-28,200
Full breakout, AI optimism returns
Long-term forecast shows potential to $28,452
Entry Confirmation Checklist:
Before entering, CHECK:
✅ Price holding above 25,200 (bull/bear line)
✅ Volume spike on bounce (15K+ contracts on 4H)
✅ Fed announces 25bps cut (as expected)
✅ Powell's tone dovish or neutral (not hawkish)
✅ Mag 7 stocks holding up (NVDA, MSFT, AAPL)
✅ VIX below 16 (fear contained)
WAIT FOR 4/6 BEFORE FULL POSITION
Use Micro E-minis (MNQ) for Better Sizing:
MNQ = $2/point (vs NQ $20/point)
Same moves, 1/10th capital
Better for risk management
Fed Day Protocol (December 10):
2:00 PM ET - Fed Statement:
Tighten stops to 25,100 before announcement
READ statement immediately
Ignore first 5 minutes (algo chaos)
2:30 PM ET - Powell Press Conference:
WATCH LIVE - tone matters more than words
Dovish = add to position on dip
Hawkish = cut 50%, tight stops
5. Emergency Exits:
❌ Daily close below 24,650 = EXIT ALL
❌ VIX spikes above 22 = EXIT 50%
❌ Fed announces NO cut = EXIT ALL
❌ Powell says "last cut for 6+ months" = EXIT 50%
❌ Mag 7 stocks crash 3%+ = EXIT 50%
FUNDAMENTAL ANALYSIS - THE AI CONUNDRUM
CATALYST #1: The Magnificent 7 Dominance
Nvidia, Microsoft, and Apple make up 20.7% of the S&P 500 and 43.6% of the Vanguard Information Technology ETF.
This concentration means:
NQ lives or dies by Mag 7 performance
Fed policy directly impacts these valuations
Any weakness cascades fast
Current Status:
Nvidia: $4.37T market cap
Apple: $4.20T market cap
Microsoft: $4T+ market cap
CATALYST #2: The AI Spending Paradox
Here's the $400 billion question :
AI capex from S&P 500 tech companies is $400 billion or more per year. The biggest AI company OpenAI has disclosed revenues of just $13 billion for 2025.
The Math Doesn't Add Up:
Spending: $400B/year
Revenue: $13B/year
Gap: $387B/year of unprofitable spending
"Can the 10 AI companies generate enough revenue to justify the capex?"
says Torsten Sløk, chief economist at Apollo Global Management.
BUT: Nvidia revenue projected to rise from $121B in 2025 to $265B by 2030 revenue IS growing, just not fast enough yet.
CATALYST #3: Earnings Growth Remains Strong
Mag 7 earnings expected to increase +12.6% on +9.5% higher revenues in 2025.
Excluding the Mag 7, total earnings for remaining S&P 500 companies expected to grow +8.7% in 2025.
Translation: Even without AI hype, earnings are solid.
CATALYST #4: Fed Policy is CRITICAL
With U.S. 10-year Treasury yields hovering just above 4% and the Fed set to decide on a widely expected rate cut, growth stocks remain sensitive to even small changes in rate expectations.
Why This Matters:
Lower rates = higher valuations for growth
Higher rates = multiple compression
Tech has highest duration risk
RISK FACTORS - THE BEAR CASE
RISK #1: AI Bubble Concerns
Nvidia's Jensen Huang says he doesn't believe we're in an AI bubble. Amazon's Jeff Bezos says we probably are in one. OpenAI's Sam Altman has invoked a bubble, adding, "I do think some investors are likely to lose a lot of money".
Even AI leaders are split!
RISK #2: Valuation Stretched
OpenAI may have lost $12 billion in Q3 2025 alone, yet is valued at $500 billion by VCs.
If valuations reset, NQ drops 15-20%.
RISK #3: Concentration Risk
Since October 2022, roughly 75% of gains in S&P 500 have come from just seven stocks.
If Mag 7 stumbles, entire index falls .
RISK #4: Technical Breakdown
Break below 24,650 = target 23,800-24,200 (-6-7%)
THE BOTTOM LINE
Here's what I KNOW on December 9, 2025:
✅ Fed expected to cut 25bps tomorrow
✅ NQ technical indicators show Strong Buy
✅ Mag 7 earnings growing +12.6% in 2025
✅ NQ in consolidation range 25,000-26,300
✅ Support at 24,900 has held 4 times
✅ Your purple boxes show clear support/resistance
Here's what I DON'T know:
Will Powell be dovish or hawkish?
How many 2026 cuts will dot plot show?
Will AI bubble concerns accelerate?
But here's the MATH:
Risk: 25,650 → 24,650
Reward: 25,650 → 27,500
Extended: 25,650 → 28,200
The Play:
Small position NOW 25,650
IF hawkish dip to 24,900-25,100
IF dovish → ADD on breakout above 26,300
Stop 24,650
Target 27,500, then 28,200
Position accordingly.
Follow officialjackofalltrades for institutional-grade futures analysis, Fed-day strategies, and professional risk management.
Drop a 📊 if you're trading NQ through the Fed decision.
Drop a 🎯 if this analysis helped your setup.
Drop a 💰 if you're ready for 27,500+ breakout.
Disclaimer: This is not financial advice. This post is for educational and informational purposes only. Always do your own research and manage your own risk.

Breaking: Wave Life Sciences Ltd. (WVE) Spike Ovr 150%In what came as a shock, Wave Life Sciences Ltd. (WVE) broke out of a bullish symmetrical triangle surging almost 150%, extending the gains to premarket session.
NASDAQ:WVE shares are up 4% in Tuesday's premarket session aiming for a move to the $50 resistant. With increased momentum NASDAQ:WVE stock is poised to continue its bullish sojourn.
In another news, Wave Life Sciences Ltd. (Nasdaq: WVE), announced today that it has commenced an underwritten public offering of $250 million in aggregate of its ordinary shares, and, to certain investors that so choose in lieu of ordinary shares, pre-funded warrants to purchase ordinary shares. In connection with the offering, Wave intends to grant the underwriters a 30-day option to purchase ordinary shares in an amount up to an additional 15% of the total amount of ordinary shares and shares underlying pre-funded warrants sold in the public offering on the same terms and conditions. All of the securities in the offering will be sold by Wave Life Sciences.
About WVE
Wave Life Sciences Ltd., a clinical-stage biotechnology company, designs, develops, and commercializes ribonucleic acid (RNA) medicines through PRISM, a discovery and drug development platform. The company’s RNA medicines platform, PRISM, combines multiple modalities, chemistry innovation, and deep insights into human genetics to deliver scientific breakthroughs that treat both rare and prevalent disorders.

AMD Hull MA Pullback: Strong Upside Projection Ahead!🔥 AMD Profit Playbook — Hull MA Pullback Power Move 🔥
Asset: AMD – Advanced Micro Devices Inc.
Market: NASDAQ
Style: Day/Swing Trade Profit Playbook
📈 Trade Thesis
The bullish structure stays intact with a clean HULL Moving Average pullback confirming continued upside momentum. The flow remains constructive as long as price respects trend behavior and avoids deep retracements.
🎯 Entry Plan
You can enter at any valid price zone based on your personal system, confirmation signals, or preferred demand levels. Traders use different timing tools — choose what aligns with your process. ⚙️📊
🛑 Stop Loss Zone
SL: 160.00
This is the “Thief SL” level — tight, sharp, and designed for aggressive traders only.
Note: Dear Ladies & Gentlemen (Thief OG’s), this is not a mandatory SL. Choose your own SL based on your risk appetite. Your money = your responsibility. Stay smart, stay safe. 💼⚠️
🎯 Take Profit Targets
Target 1 → 236.00
📌 Strong resistance + trap + liquidity pocket — smart place to escape with clean profits.
Target 2 → 260.00
📌 Heavy resistance + overbought zone + trap formation — high-reaction level, so secure profits before the crowd reacts.
Note: Dear Ladies & Gentlemen (Thief OG’s), TPs are guidance only. You decide your exits. You make money → you take money at your own risk. 💸🫡
👀 Related Pairs to Watch (Correlated / Sector Influence)
These tickers often react together due to semiconductor sector rotation, AI-demand cycles, and ETF weightings:
NASDAQ:NVDA
– Direct peer. Moves with AI spending cycles. Large swings can influence AMD sentiment.
NASDAQ:SMH (VanEck Semiconductor ETF)
– Sector trend indicator. If SMH pumps, AMD usually follows.
NASDAQ:SOXX (iShares Semiconductor ETF)
– Broad chip-market strength gauge. Market-wide chip themes impact AMD direction.
NASDAQ:QCOM
– Tech-chip correlation, especially during macro chip-cycle expansions.
NYSE:TSM
– Manufacturing leader. Capacity signals often impact AMD pricing expectations.
Watching these pairs helps you gauge risk-on/off behavior across semiconductors and improves timing on AMD entries/exits. ⚡📊
📘 Final Notes
This setup is crafted for fun with a “thief-style trading twist”, but still aligned with proper technical structure and TradingView’s rules.
Nothing here is a financial recommendation — just pure charting vibes, strategy style, and technical storytelling. 🎨📉📈
✨ “If you find value in my analysis, a 👍 and 🚀 boost is much appreciated — it helps me share more setups with the community!”
Disclaimer:
This is thief-style trading strategy just for fun. Not financial advice. Trade responsibly.
#AMD #NASDAQ #SwingTrade #DayTrade #HULLMA #BullishSetup #LiquidityZones #Semiconductors #SMH #SOXX #NVDA #TSLAstyleCharts #PriceAction #TechnicalAnalysis #ThiefStyleTrader 🚀🔥

SLDE: buyers step in earlySlide Insurance (SLDE) remains attractive due to steady revenue growth in the digital-insurance segment, rising customer volume, and expansion of partnership channels. Recent reports show improving margins, and the stock has already recovered from the sharp summer drop. The sector itself is defensive, which keeps capital flowing even during periods of volatility.
Technically, the price continues to hold the ascending channel, repeatedly confirming demand around 15-15.3. A breakout of the local trendline with confirmation formed the basis for a new upward structure. EMA 20/50 act as dynamic support, and the pullback into the 0.618 Fibonacci level matches the accumulation zone. A breakout above 16.8-17.0 would confirm the next bullish leg toward the first target at 19.8. The second target sits near 22.3 where major supply is located.
Trading plan: long entries remain valid while price holds above the 15-16 support area and reclaims 16.8. Wave structure supports the beginning of a new bullish impulse. As long as the channel remains intact, buyers keep the advantage.

NAS100 Trade Opportunity: Will Buyers Defend the Pullback?📊 NAS100 (NASDAQ-100) Swing Trade Opportunity 🚀
Bullish Pullback Setup | Super Trend ATR + TMA Confirmation
🎯 TRADE SETUP OVERVIEW
Instrument: NAS100 (NASDAQ-100 Index)
Timeframe: Swing Trade (4H-Daily)
Bias: BULLISH ✅
Setup Type: Super Trend ATR Line Pullback + Triangular Moving Average (TMA) Confirmation
🎬 ENTRY STRATEGY - "LAYERING METHOD" 📍
This strategy employs multiple limit order placement (Layer Entry Technique) to optimize entry points during the pullback phase.
Recommended Layer Entry Points:
🔵 Layer 1: 24,500
🔵 Layer 2: 24,600
🔵 Layer 3: 24,700
🔵 Layer 4: 24,800
⚡ Pro Tip: Scale layers based on your account size and risk tolerance. Each layer reduces average entry price.
🛑 STOP LOSS (SL)
Primary SL Level: 24,300
Strategy: Placed below the latest swing low + Super Trend confirmation
⚠️ DISCLAIMER: This SL is a guideline only. You must adjust based on your personal risk management strategy and account equity. Risk is YOUR responsibility.
🎁 PROFIT TARGETS (TP)
PRIMARY TARGET (TP1): 25,700 🎯
First resistance zone
Ideal for taking partial profits
Recommended exit: 30-50% position
SECONDARY TARGET (TP2): 26,200 🔥
Strong resistance + Historical overbought zone
⚠️ TRAP ALERT: Expect potential reversal or consolidation
Recommended exit: Remaining 50-70% position
Use trailing stop for final portion
📈 TECHNICAL CONFIRMATION
✅ Super Trend ATR: Aligned bullish
✅ TMA (Triangular MA): Pullback to key level confirmed
✅ Higher Lows Pattern: Intact
✅ Volume Analysis: Supporting move
🔗 RELATED PAIRS TO WATCH 💡
Positive Correlation (Move Together):
🔴 SPY (S&P 500 ETF) - $380-395 Range
Correlation: +0.92 | Often leads NAS100 lower-cap stocks
Key Point: If SPY breaks $390, expect NAS100 momentum confirmation
Watch for divergence signals
🔴 QQQ (Invesco QQQ Trust - Nasdaq 100 ETF) - $450-470 Range
Correlation: +0.99 | DIRECT tracking of NAS100
Key Point: Primary barometer for Nasdaq sentiment
Use for volume + volatility confirmation
🔴 TECH Sector ETF (XLK) - $205-215 Range
Correlation: +0.88 | Tech-heavy holdings overlap
Key Point: Tech rotation affects Nasdaq flow
Monitor for sector strength/weakness
Inverse Correlation (Move Opposite):
🔵 DXY (US Dollar Index) - $103-106 Range
Correlation: -0.65 | Stronger dollar = Risk-off mood
Key Point: If DXY spikes, expect NAS100 pullback extension
Monitor Fed rate expectations
🔵 TLT (20+ Year Treasury ETF) - $75-80 Range
Correlation: -0.58 | Rising yields hurt growth stocks
Key Point: Check 10Y yield trend for rate pressure
Watch Fed policy announcements
Key Monitoring Points:
📌 Earnings Season Impact: Tech earnings can create ±2% moves
📌 Fed Minutes/Announcements: Watch for rate guidance changes
📌 Market Breadth: Compare Advance/Decline lines for confirmation
📌 Volatility Index (VIX): Levels above 20 = Caution; Below 15 = Risk-on
📋 BEFORE YOU TRADE - CHECKLIST ✅
Is price currently at/near Layer 1 entry (24,500)?
Does current 4H chart show TMA pullback + Super Trend confluence?
Is volume confirming the setup?
Have you set your SL below 24,300?
Do you understand you're risking X to make Y?
Is this aligned with your trading plan?
🎓 FINAL NOTES
This is a mechanical swing trade setup designed for traders who use limit orders and layering technique. The confluence of Super Trend ATR + TMA creates higher probability entries during bullish pullbacks.
Remember: Trading involves substantial risk of loss. This idea is shared for educational analysis. Your trading decisions are YOUR responsibility alone.
Happy Trading! 🚀💎

SOFI Technologies — Strong 200SMA Support Sparks Swing Potential🚀 SOFI TECH STACK: The Fintech Heist - Layer Entry Swing Trade 📊💰
🎯 Executive Summary
Yo traders! 👋 Time to stack those profits like you're robbing Fort Knox! 💎 SoFi Technologies (NASDAQ: SOFI) is flashing a BULLISH CONFIRMATION signal pinned to the 200-day Simple Moving Average (SMA). This setup screams "BUY ME" for savvy swing traders! The fintech giant just crushed Q3 earnings with 36% YoY revenue growth and added 905,000 new members — that's 🔥 momentum, baby!
Current Price: $28.21 | 52-Week High: $32.57 | Market Cap: $34.02B ✅
📍 Technical Setup Breakdown
🎪 Bullish Thesis Confirmed (The Good News)
The 200-period SMA is acting like a SECURITY WALL 🛡️ supporting our bullish narrative. SOFI is respecting this key moving average on the daily chart, signaling institutional accumulation and strong bottom-forming behavior. With strong earnings tailwinds and expanding non-lending revenue (now 56% of total revenue!), this fintech is ready for liftoff! 🚀
💰 Entry Strategy: "Thief Layering" - Multiple Limit Orders 🎲
The "Thief Stacking" approach = Superior Risk Management! Instead of going all-in like a rookie, we deploy capital in tranches:
Recommended Layer Entry Zones:
🥇 Layer 1 (Buy Limit): $27.00 ← First wave of accumulation
🥈 Layer 2 (Buy Limit): $28.00 ← Secondary strength test
🥉 Layer 3 (Buy Limit): $29.00 ← Building momentum zone
💎 Layer 4 (Buy Limit): $30.00 ← Premium breakout entry (ATH proximity awareness!)
Strategy Win: This layering method scales your position while averaging down on dips — mathematically sound, emotionally smart! 📈 You can add/modify additional layers based on your risk tolerance and account size.
🛑 Stop Loss: The "Escape Route" 🏃♂️
Hard Stop Loss @ $25.00 ⚠️
This level represents ~11% downside risk from current levels and sits below major support structures. If SOFI breaks this zone with volume, the thesis is invalidated and we exit to fight another day. Remember: Protecting capital = Being alive to trade tomorrow! 💪
Disclaimer: This is YOUR trade setup. Risk management is personal — adjust your SL based on YOUR position size and account heat.
🎯 Profit Targets: "Police Barricade" Resistance Escape 🚨
Target: $37.00 📍
After crushing earnings, SOFI faces multiple headwinds at higher prices:
🚧 Overbought Confluence Zone: RSI approaching overbought territory + Fib resistance overhead
📊 Technical Resistance: Historical resistance cluster around $35-37 range
⚡ Momentum Trap Warning: Extended moves often reverse at psychological levels
Multi-Profit Take Strategy:
TP1 @ $32.50: Take 30% profits — Lock in the W! 🔐
TP2 @ $35.00: Take another 40% — Secure the bag! 💵
TP3 @ $37.00: Trail 30% with breakeven stop — Let winners run! 🎯
Pro Tip: Don't get greedy! The "Police Barricade" awaits those who overstay their welcome!
🌐 Correlated Pairs to Monitor (Market Context)
Keep your eyes on these relationships — they'll tell you if SOFI is moving on individual strength or sector momentum:
🔸 NASDAQ:UPST (Upstart Holdings) — 📈 Fintech peer correlate. Broader lending sector strength signals = SOFI momentum tailwind!
🔸 NASDAQ:COIN (Coinbase) — 🏦 Digital finance ecosystem player. Tech-forward consumer adoption trends directly impact fintech adoption rates.
🔸 SET:SQ (Block Inc) — 💳 Payments ecosystem leader. Fintech ecosystem health barometer — if SQ is strong, SOFI rides the wave!
🔸 NASDAQ:QQQ (Nasdaq-100) — 🔗 Tech sector correlate. Market risk appetite indicator — if QQQ tanks, watch for tech sector contagion signals!
🔸 NASDAQ:TLT (20+ Treasury ETF) — 🔀 Inverse relationship alert. If rates rise (TLT falls), fintech lending margins expand = bullish for SOFI profits! 📈 If rates fall hard, margin compression = caution flag! 🚨
Key Correlation Insight: Monitor these pairs in real-time during SOFI entry execution — they'll tell you if this is individual strength or sector-wide momentum! 🎯
📋 Trading Rules (Thief Code of Conduct) 🎭
✅ Entry ONLY when price touches your pre-set buy limit zones
✅ Size DOWN if fundamentals deteriorate (earnings miss, regulatory headwinds)
✅ Move stops to breakeven once TP1 is hit — Never give back free money!
✅ Take profits AT resistance — Fighting the market = broke traders
✅ Walk away if SOFI closes below $25.00 — Live to trade another day!
🔥 Why This Setup SLAPS Right Now 📱
✨ Q3 Earnings Crush: 36% revenue growth + profitability milestone achieved
🏦 Fintech Secular Trend: Younger generations ditching traditional banks for digital solutions
📈 Non-Lending Growth: 57% YoY expansion in SoFi Money, Invest, and Credit Card products
💰 Analyst Optimism: 6 of 11 analysts recommend BUY | Target range: $12-$38
🎯 Technical + Fundamental Alignment: The chart AND the fundamentals say "BUY ME"
✨ Gratitude Note
✨ If you find value in my analysis, a 👍 and 🚀 boost is much appreciated — it helps me share more setups with the community!
#SOFI #SoFiTechnologies #SwingTrade #Fintech #TradingSetup #NASDAQ #BullishSetup #TechnicalAnalysis #Daytrader #TradingIdeas #StockMarket #Crypto #FinanceGains #TradingCommunity #Bullish #EntryStrategy #RiskManagement #TP1 #SL #TradingWithBias

Market Focus on QQQ — Bullish Setup Taking Shape!🎯 QQQ ($INVESCO NASDAQ-100) Bullish Swing Trade Setup
The Layered Entry "Thief" Strategy | Profit Playbook 💰
📈 MARKET OUTLOOK
The QQQ (INVESCO QQQ TRUST) is positioned for a bullish swing trade setup. 🚀 This technical analysis focuses on strategic multi-layer entry execution with defined risk/reward parameters suitable for intermediate swing traders.
🎪 ENTRY STRATEGY: "LAYERED THIEF" METHOD
This isn't your typical entry—we're using smart limit order layering 🎯 to accumulate positions at key support zones. Think of it as a professional scale-in approach!
📍 Limit Order Entry Layers:
Layer 1: $605.00 ⭐
Layer 2: $610.00 ⭐
Layer 3: $615.00 ⭐
Layer 4: $620.00 ⭐
💡 Pro Tip: Feel free to add additional layers ($625, $630, etc.) based on your risk tolerance and account size. The thief's advantage is patience and positioning!
Entry Triggers: Volume confirmation + Support zone bounce + Institutional accumulation signals 📊
🛑 STOP LOSS (Risk Management)
⚠️ THIEF SL: $590.00
📢 DISCLAIMER: This stop loss is a suggestion only. You are responsible for setting your own risk parameters based on your trading capital, risk tolerance, and market conditions. Trade at your own risk! 🎲
🎊 PROFIT TARGETS (Exit Strategy)
PRIMARY TARGET: $650.00 ✅
SECONDARY RESISTANCE: $660.00 ⚠️
Note: The $660 zone presents strong technical resistance combined with overbought conditions and potential reversal traps. We recommend taking profits at $650 and letting a small portion run if momentum confirms. Smart money moves!
📢 DISCLAIMER: Target levels are suggestions based on technical analysis. Your profit-taking strategy should align with your personal risk/reward ratio. Final exit decisions rest with you! 🎯
🔗 CORRELATED PAIRS TO MONITOR
Keep an eye on these related assets for confirmation signals:
🔴 QQQ Constituents & Index Correlation:
NASDAQ:AAPL (Apple Inc.) — Tech sector heavyweight; if AAPL breaks support, QQQ may follow 📱
NASDAQ:MSFT (Microsoft Corp.) — AI & cloud leader; typically leads QQQ moves upward 🤖
NASDAQ:NVDA (NVIDIA Corp.) — Semiconductor bellwether; massive correlation to tech rallies 💻
NASDAQ:TSLA (Tesla Inc.) — Growth driver; watch for momentum continuation signals ⚡
NASDAQ:GOOGL (Alphabet Inc.) — Large-cap tech anchor; supports QQQ uptrend confirmation 🔍
📊 Macro-Level Pairs:
NASDAQ:NDX (NASDAQ-100 Index) — Direct parent index; should mirror QQQ closely 📈
AMEX:SPY (S&P 500 ETF) — Broader market health check; risk-on environment confirmation ⭐
AMEX:IWM (Russell 2000 Small-Cap) — Risk sentiment gauge; divergence = caution ⚠️
TVC:DXY (US Dollar Index) — Inverse correlation; strong dollar = headwind for tech 💵
Key Correlation Points: Watch for tech sector strength continuation and macro risk-on sentiment. If NDX confirms, QQQ breakout is highly probable! 🚀
💡 STRATEGY BREAKDOWN
✅ Bullish Bias with patience-based accumulation
✅ Defined Risk at the $590 level
✅ Layered Entry for optimal position sizing
✅ Technical Confluence at resistance zones
✅ Risk/Reward Potential = Approx 1:2.5 ratio
🎓 TECHNICAL VALIDATION CHECKLIST
✅ Support zone identification at $605-620 range
✅ Volume analysis at entry levels
✅ RSI divergence confirmation
✅ Moving average alignment (200 SMA positioning)
✅ Institutional order flow patterns
✅ Market structure (Higher Highs/Higher Lows)
✨ If you find value in my analysis, a 👍 and 🚀 boost is much appreciated — it helps me share more setups with the community!
#QQQ #SwingTrade #TechETF #NASDAQ100 #TradingStrategy #ThiefStrategy #LayeredEntry #ProfitPlaybook #Bullish #TechnicalAnalysis #ETFTrading #RiskManagement #ActiveTrading

Will NAS100 Sustain Its Bullish Momentum After the Pullback?NAS100 🚀 Bullish Swing Setup | SuperTrend Pullback & Layered Entry Strategy
🎯 TRADE IDEA: NAS100 (US100) BULLISH SWING
Capitalize on a structured pullback in the NASDAQ 100! This plan leverages a proven indicator confluence for a high-probability long opportunity.
📊 ANALYSIS & CONFIRMATION:
Trend: Primary Bullish Trend is intact. ✅
Trigger: Price is pulling back into a demand zone, offering a favorable risk-to-reward entry.
Indicator: The SuperTrend ATR Line is acting as dynamic support on the 4H/Daily timeframe. A bounce from this level confirms our bullish bias.
⚡ STRATEGY: "THE THIEF" LAYERED ENTRY
This method uses multiple limit orders to average into a position, perfect for volatile markets like the NASDAQ.
Entry Zone: Look for entries between 25,200 - 25,600
Layer Example:
🟢 Limit Order 1: 25,600
🟢 Limit Order 2: 25,400
🟢 Limit Order 3: 25,200
👉 You can adjust the number of layers and prices based on your capital and risk appetite.
❗ RISK MANAGEMENT:
Stop Loss (SL): A decisive break below 24,800 would invalidate the bullish structure.
⚠️ IMPORTANT NOTE: This is MY protective stop. Dear Thief OG's 👑, you MUST adjust your position size and SL based on your personal risk management strategy. Protect your capital first!
🎯 PROFIT TARGETS:
Primary Target: 25,600 (Initial resistance & profit-taking zone).
Key Reasoning: We anticipate a reaction here due to:
Moving Average resistance.
Potential overbought conditions on lower timeframes.
A "trap" for late buyers.
👉 Smart Move: Consider taking partial profits at 25,600 and trailing your stop for the remainder. Escape the trap with your profits! 💰
⚠️ REMINDER: Dear Thief OG's 👑, your Take Profit (TP) is your own decision. Secure gains based on your trading plan and market behavior.
🔍 RELATED ASSETS & MARKET CORRELATION:
Watching these related instruments can provide confirmation and a broader market view.
TVC:DXY (U.S. Dollar Index): 🟡 NEGATIVE CORRELATION
A weakening Dollar ( TVC:DXY DOWN) is generally bullish for Nasdaq. If the Dollar is falling, it adds confidence to this long thesis.
USTECH (CFD on Nasdaq 100): 🟢 DIRECT CORRELATION
Moves in sync with NAS100. Perfect for cross-verifying price action and volume.
NASDAQ:AAPL , NASDAQ:MSFT , NASDAQ:TSLA (Mega-Caps): 🟢 HIGH IMPACT
These heavily weighted Nasdaq components drive the index. Bullish momentum in these stocks supports a rising NAS100.
FOREXCOM:SPX500 (S&P 500): 🟢 POSITIVE CORRELATION
A strong S&P 500 often lifts the Nasdaq. Monitor for overall U.S. market strength.
💬 Let me know your thoughts in the comments!
What's your entry strategy for the NAS100 this week?
#NAS100 #US100 #TradingView #SwingTrading #Bullish #SuperTrend #TradingStrategy #IndexTrading #LayeredEntry #ThiefStrategy

QQQ Structured Bullish Scenario • Compression Into MA Support📌 Asset: QQQ — Invesco QQQ Trust Series 1 (NASDAQ ETF)
🔎 Style: Swing / Day-Trade Profit Playbook
🎨 Theme: Bullish Pullback Setup using Triangular Moving Average + Layered Entry Strategy
📈 Bullish Pullback Plan — “Thief Layering Strategy” Edition 🕵️♂️💰
QQQ is pulling back into a Triangular Moving Average zone, forming a clean bullish reaction area. Price behavior shows controlled momentum, healthy retracement, and a potential continuation toward the upper supply zone.
To keep it fun — Thief OG Style is included but in TradingView-permitted language and friendly terms.
🎯 Entry Plan (Layered Limit Entries — “Thief Style but TV-Friendly”)
Using a layered entry method (multiple limit orders placed at different levels to reduce average cost and control risk):
Buy Limit Layer 1: 605
Buy Limit Layer 2: 610
Buy Limit Layer 3: 615
Buy Limit Layer 4: 620
(Traders may increase or reduce the number of layers based on their own strategy and risk tolerance.)
🛑 Stop Loss (Risk Control Zone)
📍 Proposed Risk Level: 600
This is shared for educational insight only — every trader must select their own SL depending on risk appetite.
🎯 Target Zone (Resistance + Police Force Zone 🚓😆)
Projected upside target: 650
The resistance zone has strong reaction history + signs of overbought conditions + possible liquidity traps.
So take profit smartly and exit with gains before “police force” catches late buyers.
(Again: this TP is optional — traders should decide their own TP levels.)
📚 Market Context & Correlation Watchlist 🔍🌐
QQQ is heavily correlated with major US tech indices & megacap tech stocks. Watching related pairs helps understand volatility, liquidity shifts, market strength, and trend momentum.
🔗 Related Pairs to Watch (Cross-Checks & Correlation Insight)
💠 NASDAQ:NDX / PEPPERSTONE:NAS100
Direct parent index of QQQ
Moves almost identically
Great for trend confirmation
💠 SP:SPX / AMEX:SPY
Broader market risk sentiment
If SPY + QQQ align in bullish direction → strength confirmed
💠 TVC:VIX
Volatility meter
Lower VIX supports bullish continuation
💠 NASDAQ:AAPL , NASDAQ:MSFT , NASDAQ:NVDA , NASDAQ:AMZN , NASDAQ:GOOGL
These top components control majority of QQQ weighting
Bullish tech megacaps = higher probability QQQ reaches target
💠 TVC:DXY (Dollar Index)
Strong USD = pressure on equities
Weak USD = supportive for QQQ rallies
💠 NASDAQ:TLT / US10Y
Bond yields inverse to growth stocks
Falling yields can provide additional bullish fuel for QQQ
🧠 Key Technical Points 🛠️🔥
Triangular MA acting as dynamic support
Healthy pullback with controlled selling
Layering entries reduces average cost & improves RR
Resistance zone at 650 aligns with prior structure
Megacaps still holding bullish bias
Volatility decreasing → favorable for continuation
✨ “If you find value in my analysis, a 👍 and 🚀 boost is much appreciated — it helps me share more setups with the community!”
⚠️ Disclaimer
This is a thief-style trading strategy just for fun.
#QQQ #NASDAQ #ETF #SwingTrade #DayTrading #TechnicalAnalysis #TriangularMA #LayeringStrategy #LimitOrders #MarketAnalysis #TradingPlaybook #USMarkets #Stocks #TraderLifestyle #Investing #BullishSetup #TrendContinuation #RiskManagement #ChartAnalysis
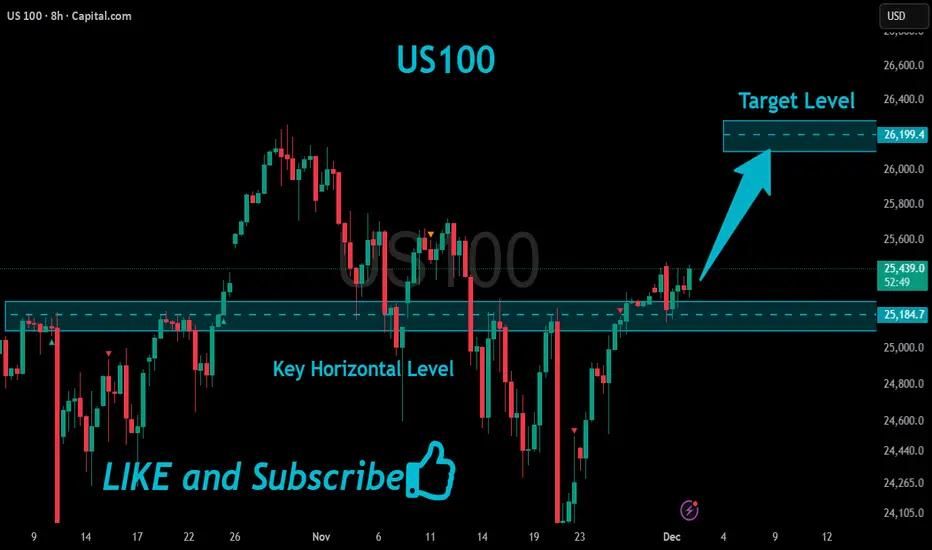
US100 Bullish Breakout!
HI,Traders !
#US100 is going up now
And made a bullish
Breakout of the key horizontal
Level of 25184.7 and the breakout
Is confirmed so we are bullish
Biased and we will be
Expecting a further
Bullish move up !
Comment and subscribe to help us grow !
Fitell Corporation ($FTEL) Spike 25% Eyeing the $100 MarkThe price of Fitell Corporation ( NASDAQ:FTEL ) saw a noteworthy uptick of 25% today amidst market condition. The asset looks set to reclaim the $100 resistant point amidst bullish sentiments.
NASDAQ:FTEL Relative Strength Index (RSI) is 44, indicating ample of opportunity for NASDAQ:FTEL to reclaim recent highs.
Eversince losing over 90% of market value, the asset has been in oversold region for almost a year.
In recent News, Fitell Corporation (NASDAQ: FTEL) announced that its board of directors (the “Board”) has approved a share repurchase program (the “Share Repurchase Program”) under which the Company may repurchase up to $3 million of its ordinary shares over the next 24 months. The Share Repurchase Program is designed to enhance shareholder value and foster a stronger sense of community among our supporters.
Financial Performance
In 2025, Fitell's revenue was $5.20 million, an increase of 16.42% compared to the previous year's $4.47 million. Losses were -$682,724, -92.67% less than in 2024.
About FTEL
Fitell Corporation, through its subsidiary, GD Wellness Pty Ltd, operates as an online retailer of gym and fitness equipment for personal training studios and commercial gyms chains in Australia and Southeast Asia. The company markets and sells fitness equipment, including home gym and commercial strength-training equipment.

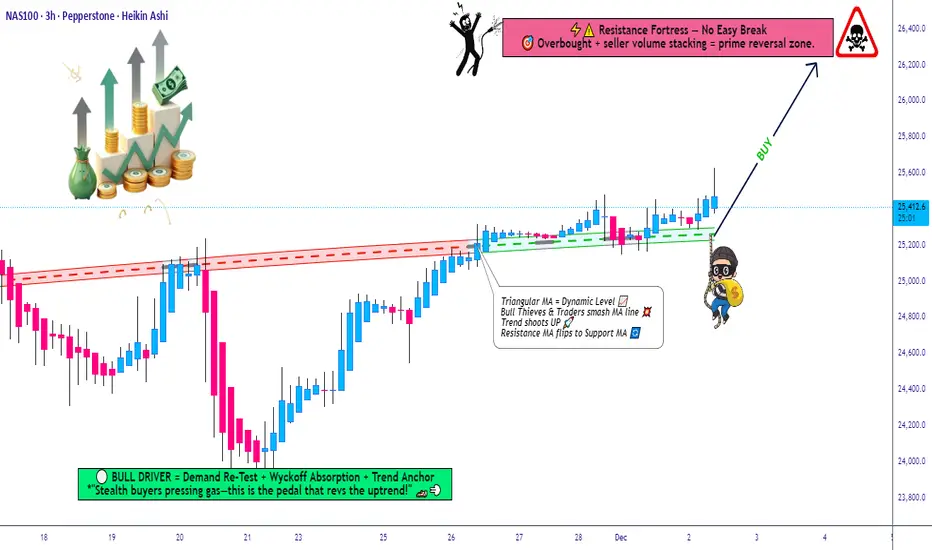
NASDAQ100 Breakout Watch — Is a New Upside Leg Starting Now?📈 NASDAQ100 Swing Trade Opportunity — Bullish Breakout Play
🟩 Asset: NASDAQ100 (Index CFD)
⚡ Trade Type: Swing Trade — Bullish Plan Confirmed
🧭 Trade Thesis
The index has confirmed a bullish setup following a Triangle + Moving Average breakout, strengthening upward momentum and favoring dip-buying behavior.
To reflect the Thief layering method, this plan uses multiple staggered limit orders to accumulate positions efficiently across volatility pockets.
📌 Entry Plan (Thief Layering Method)
💰 Entry Style: “Any price level allowed — Thief uses layers”
Buy Limit Layers:
24,900
25,000
25,100
25,200
(Feel free to increase or customize layers to fit your personal risk and liquidity preference.)
🛑 Stop-Loss (SL)
🔻 Thief SL: 24,500
Dear Ladies & Gentlemen (Thief OG’s), adjust SL based on your personal risk and strategy.
This is not a fixed recommendation, only a reference zone.
🎯 Target (TP)
⚡ The High-Voltage Electric Gate Zone around 26,200 acts as major resistance because of:
Overbought readings
High-liquidity trap behavior
Historical reversal probability
Exit with profits before heavy sellers activate.
Again — you decide your own TP based on your risk tolerance, not mine.
📊 Market Logic Behind the Move
Breakout structure confirmed
Trend continuation supported by triangle compression
Index ETF flows show short-covering + rotation back into tech
Momentum accelerates above 25,200 zones
Cleaner upside path until liquidity wall at 26,200
🔎 Related Pairs to Watch (Correlation Insight)
1️⃣ NASDAQ:NDX / NASDAQ:QQQ
Direct ETF mirror of NASDAQ100
Useful for checking volume, market depth, and real-time breakout confirmation
2️⃣ SP:SPX / NYSE:ES (S&P 500)
High correlation (approx. 0.85+)
A strong SPX supports tech continuation; weakness warns of index-wide pullback
3️⃣ TVC:VIX (Volatility Index)
Inverse correlation
If VIX stays below key volatility thresholds, bullish NASDAQ continuation is more reliable
4️⃣ FX:USDOLLAR / DXY
Tech usually performs better when the Dollar weakens
A rising Dollar can slow or cap NASDAQ bullish momentum
5️⃣ TVC:US10Y / Yields
NASDAQ moves inversely with yields
If yields drop, NASDAQ accelerates
If yields spike, prepare for turbulence or failed breakouts
📘 Summary
Bullish plan confirmed via Triangle + MA Breakout
Thief layering entries positioned smartly into volatility
SL/TP guidance flexible for trader customization
Strong correlation checks available across SP:SPX , TVC:VIX , TVC:DXY & yields
NASDAQ NAS100 Analysis and My Trade Plan📊 Currently analysing NAS100 (NASDAQ), we can see that price has broken structure to the upside, confirming bullish intent. Right now, NAS100 is retesting the value area and the Point of Control (POC) on the volume profile — a critical zone to watch 👀📈
⚠️ Price action is a bit precarious. After a strong impulsive move, we’ve now seen a deep and aggressive retracement, which opens the door for potential bearish movement this week.
📆 However, my higher-timeframe bias remains bullish, with the weekly chart still supporting upward continuation.
📌 My plan:
If price holds above the current POC, then breaks and retests cleanly, I’ll be looking for long opportunities. If it breaks below the POC, I will step aside and abandon the long bias 🚫
This is not financial advice — just my personal market outlook. 💬📉📈

Breaking; Direct Digital Holdings, Inc. ($DRCT) Spike 37% TodayThe price of Direct Digital Holdings, Inc. (NASDAQ; NASDAQ:DRCT ) Spike 33% today gearing for a move to the $1 resistant amidst general market turmoil that saw notable tech stocks down with CRYPTOCAP:BTC dipping to the $80k zone.
NASDAQ:DRCT is looking poised to reclaim the $1 resistant as the relative strength index (RSI) is at 43 giving it ample of opportunity to capitalise on the dip.
In recent news, Direct Digital Holdings, Inc. (Nasdaq: DRCT) announced that it has received notice from the Listing Qualifications Department of The Nasdaq Stock Market notifying the Company that it has regained compliance with the minimum stockholders' equity requirement for continued listing on The Nasdaq Capital Market under Nasdaq Listing Rule 5550(b)(1), which requires listed companies to maintain stockholders' equity of at least $2,500,000.
Financial Performance
In 2024, Direct Digital Holdings's revenue was $62.29 million, a decrease of -60.35% compared to the previous year's $157.11 million. Losses were -$6.24 million, 184.2% more than in 2023.
Analyst Summary
According to one analyst, the rating for DRCT stock is "Strong Buy" and the 12-month stock price target is $6.0
About DRCT
Direct Digital Holdings, Inc. operates as an end-to-end full-service advertising and marketing platform. The company’s platform primarily focuses on providing advertising technology, data-driven campaign optimization, and other solutions to underserved and less efficient markets on both the buy- and sell-side of the digital advertising ecosystem. It serves various industry verticals, such as travel, education, healthcare, financial services, consumer products, and other sectors with a focus on small and mid-sized businesses.

NAS100 — Bearish Below 25,333 with Target at 25,054Price remains capped below the 25,333 key level, keeping the market in a clear bearish structure. As long as price trades under this zone, bullish attempts are likely to fail, and any rebounds should be viewed as corrective only. A sustained move below the intermediate supports at 25,181 and 25,166 strengthens the downside momentum and confirms continuation toward the primary bearish target at 25,054. Momentum and structure remain aligned to the downside while the key level holds.

Tech bubble burst?The Head and Shoulders (H&S) pattern is a classic reversal formation, typically found after a mature uptrend. It represents a gradual loss of buying pressure and a transition toward a potential downward move.
The H&S pattern often signals the exhaustion of bullish momentum, a shift in control toward sellers, and the possible beginning of a deeper reversal (sell-off).

Week 48 Market Update — $SPXStrong week for the SP:SPX index. After two weeks of hesitation candles, price finally shifted back into strength and pushed decisively higher. This week’s candle not only reclaimed momentum but fully erased last week’s cooling-off behavior.
Price also moved well above the key mid-range levels that traders usually watch to define trend health. It’s now sitting firmly above the major risk zone and continues building distance away from it — a clear sign of strength. From the moment this week’s upside break triggered, the index has gained roughly 1.9%, and that kind of move typically translates into solid returns for options traders playing directional setups.
Major support zones sit lower around 5900, 5100, and the deeper structural support near 4000. As long as price holds above the upper layers of support, momentum remains intact.
On the higher-timeframe monthly chart, the trend has been active for eight straight months with no signs of exhaustion. Price is still far above the level where the monthly trend began, and even further above the long-term midline — showing how dominant the larger trend still is.
The 2-day chart continues to support the overall bullish structure, breaking above short-term levels and maintaining strength after multiple confirmations earlier in the week.
This week was a clean continuation of the broader uptrend — strong candle, strong momentum, and strong positioning above every major structural region.
Elite clarity. Elite precision. More coming soon.
