NASDAQ NAS100 Trade Plan: VWAP & Volume Profile StrategyI’m currently watching the NASDAQ #100 (#NDX) 📊. After a strong correction due to geopolitical turmoil 🌍, the market rebounded just as aggressively. Right now, price is trading above VWAP 📈. If it stays above VWAP, I’ll be looking for a long opportunity.
In the video, we zoom into a 30-minute timeframe ⏱️, using VWAP and Volume Profile to plan the trade. If price respects these levels, we can take a long. If it falls below the support level ❌, we abandon this idea.
⚠️ Disclaimer: This is for educational purposes only and not financial advice.
Nasdaq100

Nasdaq - Clearly heading to $30.000!🎉Nasdaq ( TVC:NDQ ) points much higher:
🔎Analysis summary:
Yes, we witnessed a short term correction over the past couple of days. But no, this does not mean that the bullrun is now entirely over. In fact, looking at the longer term rising channel pattern, the Nasdaq can still rally higher until it will retest the upper trendline.
📝Levels to watch:
$25.000, $30.000
SwingTraderPhil
SwingTrading.Simplified. | Investing.Simplified. | #LONGTERMVISION

NASDAQ 100 (NQ1!): Still Bullish! Wait For Valid Buys!Welcome back to the Weekly Forex Forecast for the week of Oct. 13 - 17th.
In this video, we will analyze the following FX market: NASDAQ (NQ1!) NAS100
The NASDAQ dumped last Friday with the Trump tariffs on China announcement. His latest tweet seems to have lowered the temperature on the tension. The markets have opened with a gap up.
The plan: look for valid buy setups, and stay with the overall trend. Avoid selling this market.
Simple.
Enjoy!
May profits be upon you.
Leave any questions or comments in the comment section.
I appreciate any feedback from my viewers!
Like and/or subscribe if you want more accurate analysis.
Thank you so much!
Disclaimer:
I do not provide personal investment advice and I am not a qualified licensed investment advisor.
All information found here, including any ideas, opinions, views, predictions, forecasts, commentaries, suggestions, expressed or implied herein, are for informational, entertainment or educational purposes only and should not be construed as personal investment advice. While the information provided is believed to be accurate, it may include errors or inaccuracies.
I will not and cannot be held liable for any actions you take as a result of anything you read here.
Conduct your own due diligence, or consult a licensed financial advisor or broker before making any and all investment decisions. Any investments, trades, speculations, or decisions made on the basis of any information found on this channel, expressed or implied herein, are committed at your own risk, financial or otherwise.

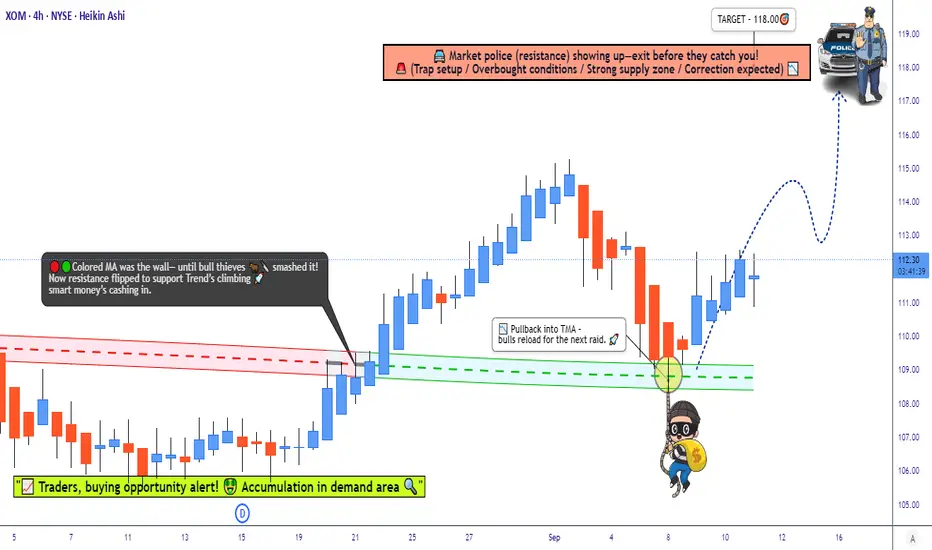
Exxon Mobil Stock Outlook: Fundamentals + Technicals Aligned📌 Exxon Mobil Corporation (XOM) — Bullish Master Plan (Swing / Scalping Trade)
🛠️ Plan Setup (Thief Strategy)
Bias: Bullish — Triangular Moving Average Pullback 📈
Entry: Multiple layered limit orders at 🔹 $110.00 🔹 $111.00 🔹 $112.00 (You can adjust layers based on your own strategy).
Stop Loss (Protective Layer): $108.00 (adjust to your own risk preference).
Target Zone: Around $118.00 (key resistance area).
⚠️ Note: These levels are not financial advice. Manage risk carefully and adjust according to your own strategy.
❓ Why This Plan?
This Thief Plan Strategy uses layered limit orders for flexible entries. It combines technical pullback signals with fundamental, macro, sentiment, and fear/greed insights to build a confluence-based trade idea.
📊 Stock Price Overview
Daily Change: -0.20% (from $112.50 previous close)
1-Month Trend: +5.66% (from $106.27 on Aug 12)
1-Year Trend: -4.21% (from $117.22 in Sep 2024)
Year-to-Date: +2.26% (from $109.57 in 2024)
😊 Investor Sentiment
Retail Investors: 50.76% bullish 😄
Institutional Investors: 47.25% bearish 😕
Overall Mood: Mixed ⚖️
😨 Fear & Greed Index
Current Level: 39 (Fear)
Interpretation: Cautious tone, may signal undervaluation.
📈 Fundamental Score (7.55/10) ✅
Strong revenue: $340.57B in 2024 (+1.16% YoY) 💰
Stable dividend: $0.99/share quarterly 🎉
Weaknesses: Net profit -6.47% in 2024, higher operating costs 📉
🌍 Macro Score (6.8/10) 🌎
Oil demand projected to rise 20% by 2050 🛢️
Geopolitical risks support oil prices 🔥
OPEC+ output hike could moderate momentum 📉
🐂🐻 Market Outlook
Consensus: Neutral → Mildly Bullish ⚖️
Analyst Ratings: Moderate Buy (12 Buy, 7 Hold, 0 Sell)
Key Drivers: Stable fundamentals + oil price volatility = balanced setup.
🔑 Takeaway
Exxon Mobil (XOM) offers a layered-entry bullish opportunity with mixed sentiment but strong long-term fundamentals.
Fear-dominated mood may provide contrarian opportunities.
Keep an eye on oil prices & geopolitics for momentum triggers.
Layering strategy provides flexibility across multiple levels. 🚀
🔗 Related Pairs to Watch (in USD)
Chevron Corporation (CVX): Another oil major with similar exposure to crude prices. 🛢️
United States Oil Fund (USO): Tracks WTI crude oil prices, a key driver for XOM. 📈
Energy Select Sector SPDR Fund (XLE): Broad energy sector ETF for context. 💡
✨ “If you find value in my analysis, a 👍 and 🚀 boost is much appreciated — it helps me share more setups with the community!”
#XOM #ExxonMobil #EnergyStocks #SwingTrade #Scalping #StockMarket #Oil #Fundamentals #TechnicalAnalysis #Macro #FearGreedIndex #TradingStrategy #LayeredEntry #StockIdeas
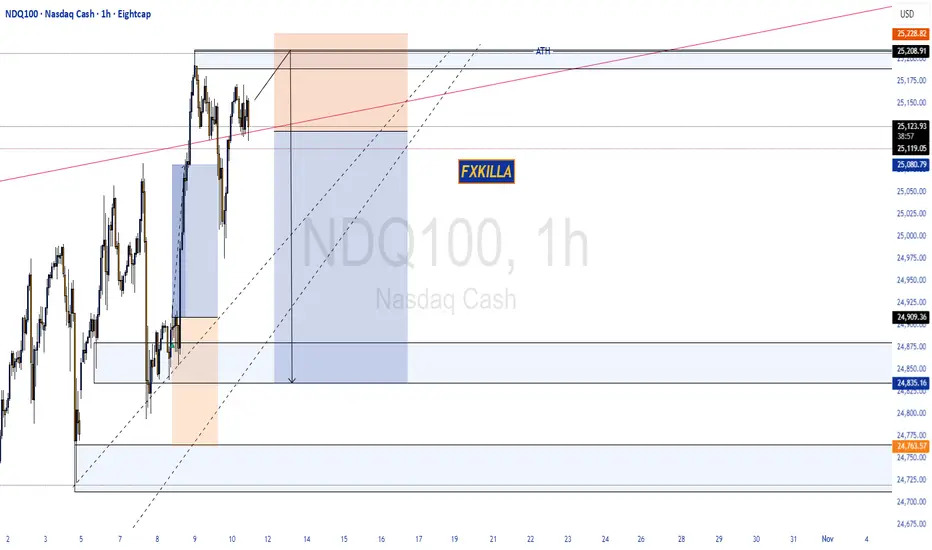
NASDAQ100 HIGH PROBABILITY SETUP SOON!!!🚨 NAS100 HIGH PROBABILITY SELL SETUP 🚨
* Here We Can See Clearly The Next Potential Move For US100 Coming Hours/Days.
* Keep Your Eyes Close On Your Trading Positions.
* Happy PIP Hunting Traders.
FXKILLA.

NASDAQ100 HIGH PROBABILITY SETUP SOON!!!🚨 NAS100 HIGH PROBABILITY BUY SETUP 🚨
* Here We Can See Clearly The Next Potential Move For US100 Coming Hours/Days.
* Keep Your Eyes Close On Your Trading Positions.
* Happy PIP Hunting Traders.
FXKILLA.

NAS100 Analysis: Trend, VWAP, Three-Drive Pattern, and Fibonacci📹 In this video, we take a detailed look at the NASDAQ/NAS100, which is currently in a strong bullish trend 📈. While the momentum is impressive, price may now be overextended, so caution is important ⚠️.
🔎 I share how I incorporate the VWAP, three-drive patterns, and the Fibonacci retracement tool to help plan high-probability trades 🎯.
📊 We also cover trend analysis, price action, and market structure, giving you a full breakdown of how these indicators work together to identify potential setups 🚀.
⚠️ Disclaimer: This content is for educational purposes only and not financial advice. Always trade responsibly and manage your risk.

Micron (MU) Trade Plan | Resistance, Pullback & Thief Setup📊 Micron Technology (MU) | Thief Plan Swing/Day Trading Setup
⚡ Why This Plan?
Micron Technology (MU) has been showing strong momentum in 2025, driven by AI demand, DRAM revenue growth, and favorable fundamentals. The Thief Plan Strategy (layering entries + tactical exits) is designed to adapt to both swing & day trading setups, balancing technical signals with fundamental catalysts.
🎯 Thief Technical Trading Plan
Strategy: Hull Moving Average Pullback ➝ Bullish Bias
Entry Method (Layering Style): Multiple buy limit layers
$122.00
$124.00
$126.00
$128.00
(You may increase/decrease layers based on your own plan & risk)
Stop Loss: Thief SL reference @ $115.00
Adjust based on your own risk tolerance & style.
Target Zone: $146.00 (resistance barricade / overbought trap zone — best to “escape” before exhaustion).
⚠️ Note: These levels are educational references. Manage your own SL/TP — trade at your own risk.
📈 Fundamental & Sentiment Insights
52-Week Range: $61.54 – $131.41
Market Cap: $147.02B
YTD Performance: +50.4% 🚀
Investor Sentiment:
Analyst Consensus: Moderate Buy 🟢
21 Buy | 5 Hold | 1 Sell | 2 Strong Buy
Avg. PT: $147.54 (+12.3% Upside)
Institutional Ownership: 80.84%
Fear & Greed Index: 39/100 → Fear 😨
Earnings & Growth:
Q3 FY2025 EPS: $1.91 (Beat by $0.34)
Revenue Growth YoY: +58.2%
DRAM Revenue: +51% YoY (AI-driven)
Net Margin: 18.41%
Debt-to-Equity: 0.30 (healthy)
Dividend Yield: 0.4%
🌍 Macro & Market Drivers
AI Boom: HBM demand projected at $10B run-rate.
Data Center DRAM: +63% YoY expected in Q4 FY2025.
US CHIPS Act & Tariffs: Long-term tailwinds for domestic semiconductor players.
Competition: Samsung & SK Hynix applying pressure on margins.
🐂 Bullish vs 🐻 Bearish Outlook
Bullish Case (Long):
AI/Data Center demand ➝ strong revenue trajectory.
Valuation attractive (PE 23.6x vs peers 32x).
Analyst PTs reach as high as $200.
Bearish Case (Risk):
Memory market cyclicality ➝ volatile pricing.
Fear & Greed shows low confidence (39/100).
DCF suggests stock could be overvalued short-term.
📌 Summary
Outlook: Neutral ➝ Bullish short-term (AI strength offsets macro fear).
Catalyst: Q4 FY2025 Earnings (Sept 23, 2025).
Risk: Moderate (High Beta 1.47).
🔗 Related Assets to Watch
NASDAQ:NVDA - AI semiconductor sentiment indicator
NASDAQ:AMD - Semiconductor sector momentum
NASDAQ:SOXX - Semiconductor ETF for sector strength
NASDAQ:SMH - Alternative semiconductor ETF
NASDAQ:WDC - Memory sector correlation
✨ “If you find value in my analysis, a 👍 and 🚀 boost is much appreciated — it helps me share more setups with the community!”
#MU #Micron #Stocks #SwingTrade #DayTrading #ThiefPlan #Semiconductors #AI #TechStocks #TradingView

META Platforms — Can Bulls Escape With $800 Loot?📈 META Money Heist: Bullish Thief Swing/Day Trade Plan! 💰🔥
Date: 08 September 2025
Asset: META Platforms, Inc.
Trading Style: Money Heist Plan with Thief Strategy (Swing/Day Trade) 🦹♂️
Plan: Bullish (Pullback in the LSMA Moving Average) – Bulls charging for upside momentum! 🚀
🎯 Entry: Any Price Level – Thief Using Layer Strategy
Deploy multiple limit orders (layering style entries) at $730.00, $740.00, $750.00 (scale up layers based on your preference).
Be a stealthy trader, sniping entries during pullbacks for max profits! 🕵️♂️
🛑 Stop Loss: Thief SL at $710.00
Dear Ladies & Gentlemen (Thief OG's), adjust your SL based on your strategy and risk tolerance. Protect your loot! 🛡️
Please adapt your SL to your own strategy, risk appetite, and style — take profits when it makes sense for you.
🎯 Target: Resistance + Overbought Zone + Trap Ahead
Escape with your stolen profits before the trap! Aim for $800.00 target. 🏃♂️💨
📝 Note: Dear Thief OG's
I’m not dictating your TP – it’s your heist! Take profits at your own risk and make the market your playground. 💸
💡 Why This Plan? Thief Strategy + Market Edge
The Thief Plan is a cunning, layered approach to "steal" profits from market pullbacks, aligning with META’s bullish technicals (near 52-week highs, above 200-day SMA). By stacking limit orders, you capitalize on dips in the LSMA moving average, riding the bulls’ strength with precision. Backed by strong fundamentals, macro trends, and greedy sentiment, this setup is primed for a high-reward heist! 🤑
📊 META Stock Sentiment & Market Outlook (08 Sept 2025)
🔢 Real-Time Data Overview
📈 Day Change: +0.51% (↑ $3.80)
📏 52-Week Range: $479.80 - $796.25
💰 Market Cap: $1.89T 🏆
😊 Investor Sentiment Outlook
Retail & Institutional Mood
🟢 Consensus Sentiment: Bullish (Greed Phase)
Analysts’ Price Target Avg: $822.41 (9.30% upside).
42/47 analysts rate META as "Buy" 🟢.
Institutions love AI-driven ad growth + strong cash flow. 💪
Fear & Greed Index
⚖️ Stock Market Sentiment Score: 53/100 (Neutral to Greed)
Driven by market momentum, options activity, and low volatility.
🔄 Crypto Sentiment: Neutral (53/100).
📉 Fundamental & Macro Score Points
Fundamental Strength ✅
💸 Valuation:
P/E Ratio: 27.32 (below peers’ avg 35.47).
Free Cash Flow: $57.63B (projected to hit $198.64B by 2035).
Profit Margin: 39.99% (industry leader).
🚀 Growth Catalysts:
AI boosting ad engagement.
Reality Labs innovation (long-term bet).
⚠️ Risks:
Regulatory scrutiny (antitrust/data privacy) 🚨.
High reliance on ad revenue (98% of total).
Macroeconomic Factors 🌍
📅 Upcoming Events:
CPI Inflation Report (11 Sept).
Fed Meeting (16-17 Sept) 🏦.
📊 Market Volatility: VIX stable (low fear).
🐂 Overall Market Outlook: BULLISH (LONG)
⏳ Short-Term: ✅
Price near 52-week high + above 200-day SMA.
Target upside: $900+ (Bank of America, DBS Bank).
📅 Long-Term: ✅
AI monetization + metaverse potential.
Undervalued by 29% (DCF model).
🎯 Key Takeaways
😊 Sentiment: Greed-driven optimism (institutional + retail).
💰 Fundamentals: Strong cash flow + EPS growth ($27.54).
🌍 Macro: Monitor CPI/Fed for volatility triggers.
⚠️ Risk: Regulatory risks offset by growth bets.
✅ Verdict: Bullish alignment across sentiment, fundamentals, and technicals.
📡 Related Pairs to Watch (in USD)
NASDAQ:AAPL
NASDAQ:GOOGL
NASDAQ:MSFT
NASDAQ:AMZN
NASDAQ:NVDA
✨ “If you find value in my analysis, a 👍 and 🚀 boost is much appreciated — it helps me share more setups with the community!”
#META #MoneyHeistTrade #BullishSetup #ThiefStrategy #SwingTrading #DayTrading #AIStocks #TechStocks #TradingView #StockMarket #FearAndGreed #BullMarket

Can COIN's $330 Breakout Reach $380? ~ Tactical Entry Plan📈 COINBASE GLOBAL, INC. (COIN) - Money Heist Plan (Swing/Day Trade) 🕵️♂️
🚨 Ready to execute the ultimate heist on COIN? This Money Heist Plan uses the Thief Strategy, a layered limit order approach to catch the breakout at $330.00 ⚡. Below, I've outlined the setup, technicals, fundamentals, and macro insights to help you navigate this trade like a pro. Set your alarms, plan your escape, and let’s dive into the details! 🔒
🛠️ Trade Setup: The Thief Strategy
The Thief Strategy is a tactical approach using multiple limit order layers to enter the trade post-breakout, maximizing flexibility and precision. Here’s how to execute it:
Asset: COINBASE GLOBAL, INC. (COIN) 💰
Entry Trigger: Breakout above $330.00 ⚡
Set a price alert on TradingView to catch the breakout in real-time! 🔔
Layered Entries (Thief Style): Place multiple buy limit orders to scale in:
$310.00
$315.00
$320.00
$325.00
$330.00
Pro Tip: Adjust layers based on your risk tolerance and strategy. Confirm entries only after the breakout at $330.00! ✅
Stop Loss (SL): Place at $295.00 post-breakout 🛑
Note: Adjust SL based on your risk management. The Thief Strategy is flexible—manage risk at your discretion, dear Traders (Thief OGs)! 😎
Take Profit (TP): Target $380.00 🎯
Resistance and overbought levels signal a potential police barricade 🚔. Escape with profits before the trap! Adjust TP based on your strategy.
Disclaimer: TP is not fixed—take profits at your own risk and preference.
📊 Why This Plan? Technical & Fundamental Breakdown
🔍 Technical Analysis: The Thief’s Blueprint
Breakout Catalyst: COIN is testing the $330.00 resistance. A confirmed breakout signals strong bullish momentum 📈.
Thief Strategy Advantage: Layered entries reduce risk of false breakouts and allow scaling into the move.
Key Levels to Watch:
Support: $295.00 (SL zone)
Resistance/Target: $380.00 (overbought zone)
Setup Confirmation: Use volume spikes and RSI for breakout confirmation. Set TradingView alerts to stay sharp! 🔔
📉 Fundamental & Macro Insights
Market Cap: $81.47B
PE Ratio (TTM): 30.52 (above industry avg., signaling high valuation)
EPS (TTM): $10.39
Revenue Growth (YoY): +12.36% (2025 est.) 💪
Profit Margin: 42.67% 🔥
Cash Reserves: $7.54B (strong balance sheet)
Risks:
Q2 profit drop to $33.2M vs. $294.4M YoY 📉
High P/E (30.71) and Price/Sales (12.61) raise valuation concerns
Macro Drivers:
Genius Act: Boosted crypto optimism 🚀
Crypto Market Trends: Bitcoin’s record highs in July 2025 fuel COIN’s upside potential
😰 Fear & Greed Index
Current Sentiment: Neutral to Greedy (Crypto Fear & Greed Index: 0-100)
Trend: Mixed emotions due to crypto volatility and regulatory developments
Takeaway: Greed supports breakout potential, but stay cautious of volatility spikes.
🧠 Investor Sentiment
Retail Traders: Cautiously optimistic 😊, holding for long-term crypto growth but cautious of short-term volatility.
Institutional Traders: Mixed 🤔—some see overvaluation, others bet on crypto adoption and regulatory clarity.
🐂 Bullish vs. Bearish Outlook
Bullish Score: 60% 🐂
Why? Strong revenue growth (+13.72% YoY est. for 2026), crypto adoption, and institutional interest.
Bearish Risks: 40% 🐻
Why? Profit volatility, high valuation, and crypto market dependence.
Key Watch: Q3 earnings (Sep 2025) and crypto market trends.
💡 Why Trade COIN Now?
Short-Term: Neutral to slightly bearish due to profit concerns, but the $330.00 breakout could spark a quick swing/day trade.
Long-Term: Bullish on COIN’s role in crypto infrastructure and regulatory tailwinds.
Thief Strategy Edge: Layered entries and disciplined risk management make this setup ideal for volatile markets.
🔗 Related Pairs to Watch (USD)
BITSTAMP:BTCUSD : Bitcoin’s momentum drives COIN’s price action.
BITSTAMP:ETHUSD : Ethereum’s performance impacts COIN’s trading volume.
BITSTAMP:XRPUSD : Watch for altcoin rallies tied to regulatory news.
AMEX:SPY : Broader market trends influence COIN’s beta (3.69).
📅 Market Data Snapshot (10 Sep 2025)
Previous Close: $318.78
Day’s Range: $315.88 - $328.67
52-Week Range: $142.58 - $444.65
Avg. Volume: 13.43M shares
✨ “If you find value in my analysis, a 👍 and 🚀 boost is much appreciated — it helps me share more setups with the community!”
#TradingView #COIN #SwingTrading #DayTrading #CryptoTrading #TechnicalAnalysis #ThiefStrategy #MoneyHeist

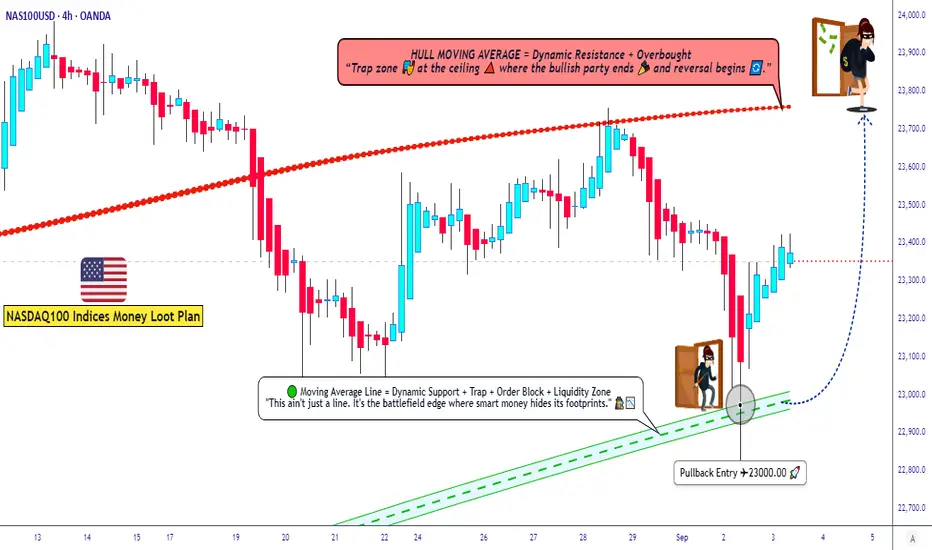
US100 Trading Plan ¦ Layering Strategy + Macro Sentiment Drivers🚀 NASDAQ100 / US100 Index – Thief Money Heist Plan 🎭
📌 Plan: Bullish Swing / Scalping Setup
Dear Ladies & Gentlemen (Thief OG’s), here’s the heist-style breakdown for US100 🔑:
🏴☠️ Entry Style (Thief Layering Strategy)
Using layered limit orders for flexibility & precision:
• 23200.0
• 23250.0
• 23300.0
• 23350.0
(You may increase limit layers based on your strategy & risk appetite)
📉 Moving Average Pullback Entry Plan
• Buy entries on pullbacks to the Fibo level 382 Triangular Moving average zone.
• Look for bullish candles confirming the bounce from these MAs.
• This offers better risk-to-reward by catching momentum on retracements instead of chasing highs.
❓ Why This Works?
• Moving averages often act as dynamic support/resistance in trending markets.
• Institutional traders & algos track them heavily, making them high-probability zones.
• Combining with layering entries = higher flexibility + reduced risk of mistimed single entry.
🛡️ Stop Loss (Protect the Vault)
• Thief SL: @23000.0
• Reminder: Adjust your SL based on your own strategy & risk tolerance.
🎯 Target (Escape Zone)
• Overbought + Trap Zone ahead!
• Escape target: @23750.0
• Note: Don’t rely only on my TP — secure profits at your own pace and risk.
📊 US100 Index CFD Real-Time Data Sep 03
📈 Daily Change: +133.47 (+0.57%)
📅 Monthly Performance: +0.76%
📆 Yearly Performance: +23.48%
😰😊 Fear & Greed Index
📊 Current Reading: 53/100 (Neutral)
🧐 Interpretation: Market sentiment is balanced, showing neither extreme fear nor greed. Investors are cautious but not panicked.
🧠 Retail vs. Institutional Sentiment
👥 Retail Traders: Moderately bullish (55% Long, 45% Short)
🏦 Institutional Traders: Slightly cautious (50% Long, 50% Short)
🔑 Key Drivers: Mixed signals from manufacturing data and upcoming labor market reports.
📉📈 Fundamental & Macro Score
📊 Macro Score: 6/10
Manufacturing PMI (48.7) still in contraction but improving.
Labor market data (JOLTS) awaited for clarity.
⚡ Volatility Score: 5/10 (Moderate)
VIX near average levels, indicating stable expectations.
💧 Liquidity Score: 7/10
Strong volume and breadth in large-cap tech stocks.
🐂🐻 Overall Market Outlook
✅ Bullish (Long): 60%
Supported by strong yearly gains and resilience in big tech.
⚠️ Bearish (Short): 40%
Concerns over manufacturing contraction and inflation pressures.
💡 Key Takeaways
📈 US100 is trending mildly positive today (+0.57%).
😐 Sentiment is neutral—no extreme fear or greed.
📊 Macro data hints at cautious optimism but watch for upcoming labor reports.
🐂 Overall bias leans slightly bullish for long-term holders.
📊 Related Pairs to Watch
FOREXCOM:SPX500
TVC:DJI
TVC:VIX
NASDAQ:NDX
FX:USDOLLAR
✨ “If you find value in my analysis, a 👍 and 🚀 boost is much appreciated — it helps me share more setups with the community!”
#NASDAQ100 #US100 #NDX #SPX500 #DJI #TradingView #SwingTrade #ScalpTrading #LayeringStrategy #MarketAnalysis
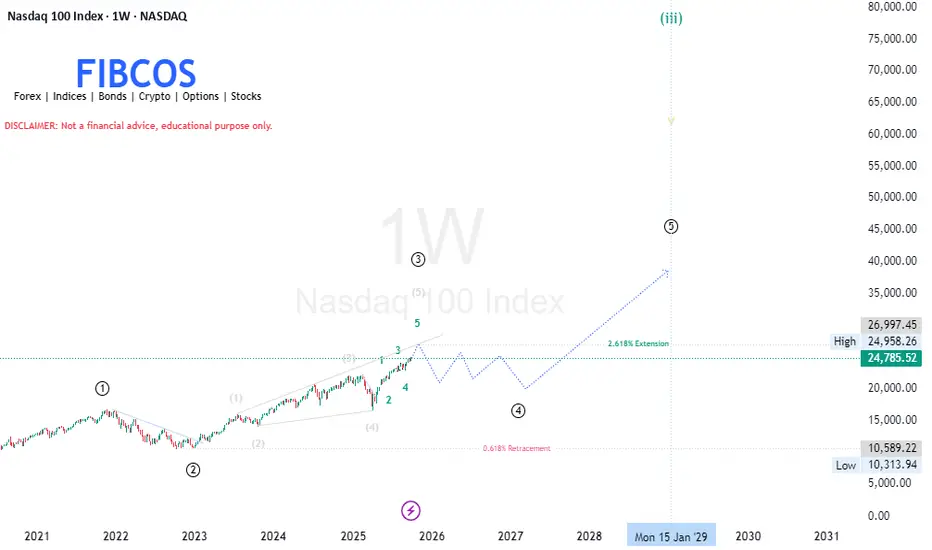
NASDAQ 100 (1W) – Elliott Wave + Smart Money Analysis by FIBCOSThe index (NASDAQ) continues its macro impulsive structure, now expanding through Wave (3) — targeting the 2.618 Fibonacci extension near 26,997( 27K ).
Smart Money is driving this leg with clear bullish order flow, creating multiple Fair Value Gaps and Breaks of Structure along the way.
After this expansion, we expect a Wave (4) correction between 22,000–17,500, where institutional demand zones await for re-accumulation before the next macro bullish leg (Wave 5) toward 35,000–38,000.
📊 Confluence Highlights:
Wave (3) → 2.618 extension (target zone: 26.9K–27K)
Wave (4) → 0.382–0.618 retracement (zone: 22K–18K)
Wave (5) → 1.618 projection (target zone: 35K–38K)
🧠 Elliott Wave Theory Interpretation
① Wave (1) — The Initial Expansion (2020–2021)
Early bullish impulse following pandemic recovery.
Represents Smart Money accumulation followed by a breakout.
Retail participation remains limited; institutional footprints dominate.
② Wave (2) — Corrective Pullback (2022–2023)
Sharp decline toward the 0.618 Fibonacci retracement zone.
This phase was a liquidity grab — Smart Money re-entering after shaking out weak hands.
Price formed a higher low , maintaining long-term bullish structure.
③ Wave (3) — The Power Leg (2023–2026)
The strongest and most extended wave — aligned perfectly with the 2.618 Fibonacci extension (~26,997 zone).
Confirms institutional markup phase , where:
Retail short sellers are trapped.
Fair Value Gaps (FVGs) are created during impulsive moves.
Continuous Break of Structure (BOS) validates bullish order flow.
Smaller degree sub-waves (1–5) visible inside, confirming internal impulse rhythm.
④ Wave (4) — The Upcoming Correction (2026–2027)
Expected macro re-accumulation zone , likely between 22,000 – 17,500 .
Market may enter a sideways complex correction (W–X–Y)/(W-X-Y-X-Z) pattern.
This is the Smart Money re-accumulation phase — liquidity collection before the next macro expansion.
Demand zones: previous unmitigated order blocks around 20,000–18,000 area.
⑤ Wave (5) — The Final Expansion (2028–2029)
After consolidation, the index may aim for new all-time highs toward 35,000–38,000 range.
This represents a distribution phase , where Smart Money offloads positions near cycle tops.
Expect divergence in momentum indicators , hinting at the end of the 5-wave structure.
---
💡 Smart Money Concept (SMC) Confluence
Concept | Observation | Implication
Liquidity Sweep - Below 2022–2023 lows (Smart Money accumulation confirmation)
Order Blocks - 22,000–18,000 zone {Institutional demand zone for Wave (4)}
Fair Value Gaps (FVGs) During Wave (3) impulsive rise {Will likely get mitigated during Wave (4)}
Break of Structure (BOS ) Continuous bullish BOS confirms institutional intent
Premium/Discount Zones Current price at premium (above equilibrium) Ideal region for institutional profit-taking
🧭 Smart Money Flow:
Accumulation → Expansion → Re-accumulation → Final Distribution
---
📐 Fibonacci Confluence Levels
Wave (3) → 2.618× extension of Wave (1–2) → ~26,997 (expected macro resistance).
Wave (4) → retracement likely between 0.382–0.618 → 22,000–17,500 zone.
Wave (5) → projected 1.618× of Wave (1–3) → 35,000–38,000 .
---
🧭 Market Outlook Summary
Timeframe | Bias | Expectation
Short-Term (2025–2026) 📈 Bullish Continuation toward 26,900–27,000
Medium-Term (2026–2027) ⚠ Corrective Re-accumulation phase, smart money reloads
Long-Term (2028–2029) 🚀 Bullish Wave (5) macro expansion toward 35K–38K
---
🔖 FIBCOS Summary
> NASDAQ 100 Weekly Chart (Elliott + SMC)
Currently expanding through a powerful Wave (3) toward the 2.618 Fibonacci extension (~27K).
After completion, a macro correction (Wave 4) is expected, providing the next Smart Money accumulation zone between 22K–18K before the final Wave 5 expansion toward new highs beyond 35K.
📘 Disclaimer: Not financial advice. Educational purpose only.
#FIBCOS #NASDAQ100 #ElliottWave #SmartMoneyConcept #MarketAnalysis #MarketCycle #Fibonacci
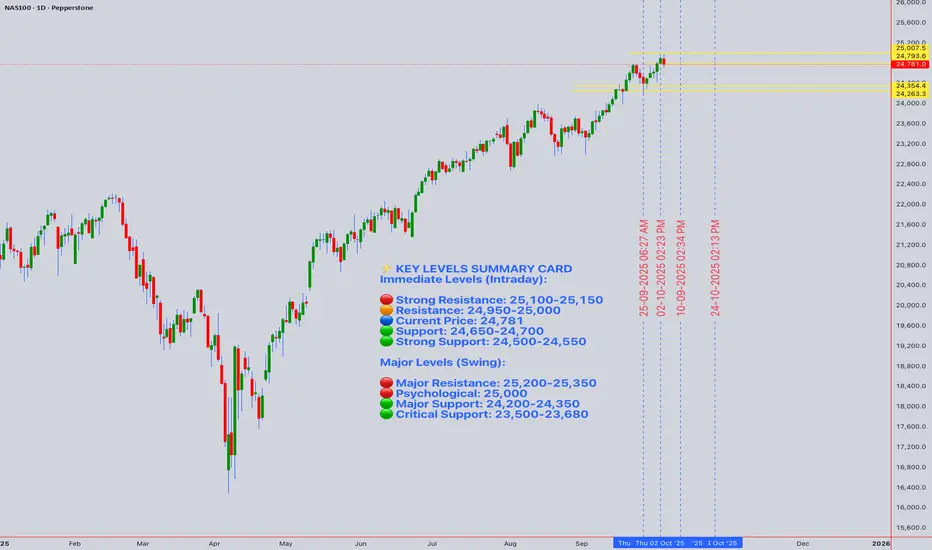
NASDAQ 100 Technical Analysis & ForecastNASDAQ 100 (NAS100) Technical Analysis & Forecast
Current Price: 24,781.00 | Date: October 4, 2025, 12:54 AM UTC+4
📊 EXECUTIVE SUMMARY
The NASDAQ 100 is currently trading at 24,781.00, showing resilience near all-time highs. This comprehensive analysis integrates multiple technical frameworks to provide actionable insights for both intraday and swing traders navigating the tech-heavy index.
Key Takeaway: NAS100 exhibits a cautious bullish bias with critical support at 24,650 and resistance at 25,100. Traders should monitor for potential consolidation before the next directional move.
🔍 MULTI-TIMEFRAME TECHNICAL ANALYSIS
Monthly & Weekly Outlook (Swing Trading Perspective)
Long-term Trend Assessment:
Primary Trend: Bullish structure remains intact with higher highs and higher lows established since Q4 2024
Elliott Wave Count: The index appears to be in Wave 5 of a larger impulse structure from the 2022 lows, suggesting a mature bull cycle
Ichimoku Cloud (Weekly): Price trading above the cloud with Tenkan-sen (9-period) above Kijun-sen (26-period), confirming bullish momentum
Key Weekly Levels:
Major Resistance: 25,200 - 25,350 (psychological level and prior consolidation zone)
Major Support: 24,200 - 24,350 (former resistance turned support, 20-week EMA)
Critical Support: 23,500 (50-week EMA, must hold for bull trend continuation)
Gann Analysis:
Square of 9 calculation from recent lows suggests the next significant price target at 25,088 (45° angle)
Time cycle analysis indicates potential volatility window October 8-12, 2025
Price-time squaring suggests equilibrium at current levels, with break expected by mid-October
Daily Chart Analysis (Swing & Position Trading)
Trend & Momentum:
50-day SMA: 24,420 (acting as dynamic support)
200-day SMA: 23,680 (long-term trend anchor)
RSI (14): Currently at 64, showing bullish momentum without overbought conditions
MACD: Positive histogram with signal line above zero, indicating upward momentum
Chart Patterns Identified:
Ascending Triangle Formation: Consolidation between 24,650 support and 25,100 resistance suggests a bullish continuation pattern
Wyckoff Analysis: Signs of re-accumulation phase (Trading Range) after the spring rally, indicating smart money positioning
Harmonic Patterns:
Potential Bullish Bat pattern completing near 24,650, with PRZ (Potential Reversal Zone) offering strong support
Fibonacci retracement from recent swing shows 61.8% level at 24,580, aligning with multiple support factors
Volume Profile:
VWAP (Anchored from Sept 1): 24,695 - price maintaining above VWAP indicates institutional buying
Volume Analysis: Above-average volume on up days suggests strong bullish participation
High Volume Node (HVN): 24,750-24,800 represents fair value area
4-Hour Chart (Transitional Timeframe)
Technical Indicators:
Bollinger Bands: Price trading in upper band (24,950), suggesting near-term overbought conditions but strong trend
RSI (14): 68 - approaching overbought but no bearish divergence yet
Stochastic Oscillator: %K at 82, %D at 76 - overbought territory, watch for crossover
Ichimoku System:
Price above cloud (bullish)
Lagging span above price (confirming bullish sentiment)
Cloud ahead is thin, suggesting potential resistance at 25,050-25,100
Support & Resistance:
Immediate Resistance: 24,950 → 25,100 (psychological and technical confluence)
Immediate Support: 24,650 → 24,500 (previous consolidation and EMA cluster)
1-Hour Chart (Intraday Swing Reference)
Short-term Momentum:
20 EMA: 24,745
50 EMA: 24,680
100 EMA: 24,620
Price trading above all key EMAs indicates short-term bullish control
Candlestick Patterns:
Recent formation of bullish engulfing patterns on hourly suggests buying pressure
No immediate reversal patterns detected
Warning Signs:
Potential Bear Trap: If price briefly breaks below 24,650 with low volume, expect quick recovery (trap for shorts)
Bull Trap Risk: Break above 25,100 without volume confirmation could reverse quickly
📈 INTRADAY TRADING STRATEGY (Week of October 4-11, 2025)
15-Minute & 30-Minute Chart Focus
Monday-Tuesday Bias: Consolidation expected between 24,650-24,950
Long Entry Strategies:
Setup 1: Support Bounce Play
Entry Zone: 24,650-24,700
Stop Loss: 24,580 (below harmonic PRZ)
Target 1: 24,850 (Risk:Reward 1:2)
Target 2: 24,950 (Risk:Reward 1:3.5)
Confirmation: RSI (15-min) oversold below 30, bullish candlestick reversal pattern
Setup 2: Breakout Play
Entry: Break and retest of 24,950 with volume
Stop Loss: 24,870
Target 1: 25,050
Target 2: 25,150 (ascending triangle measured move)
Confirmation: Volume 20% above average, 15-min candle close above 24,950
Setup 3: VWAP Reversion
Entry: Price touches VWAP (currently ~24,695) from above on 5-min chart
Stop Loss: 24,650
Target: 24,800-24,850
Confirmation: Volume spike on touch, bullish divergence on 5-min RSI
Short Entry Strategies:
Setup 1: Resistance Rejection
Entry Zone: 25,050-25,100
Stop Loss: 25,150
Target 1: 24,850
Target 2: 24,700
Confirmation: Bearish engulfing or shooting star on 15-min chart, RSI divergence
Setup 2: Failed Breakout (Bull Trap)
Entry: Price breaks 25,100 but closes back below within 2 candles (15-min)
Stop Loss: 25,130
Target: 24,800
Confirmation: High volume on breakout but no follow-through
🎯 SWING TRADING STRATEGY (October-November 2025)
Bullish Scenario (60% Probability)
Primary Strategy: Ascending Triangle Breakout
Entry Plan:
Aggressive Entry: Current levels (24,780) with tight risk management
Conservative Entry: Pullback to 24,500-24,650 support zone
Breakout Entry: Confirmed break above 25,100 with volume
Position Sizing:
Risk 1-2% of capital per trade
Scale in: 50% at first entry, 30% on confirmation, 20% on continuation
Price Targets:
Target 1: 25,350 (measured move from triangle)
Target 2: 25,800 (Fibonacci extension 1.618)
Target 3: 26,200 (psychological and Gann Square of 9 target)
Stop Loss Management:
Initial Stop: Below 24,500
Trail Stop: Move to breakeven once Target 1 is reached
Final Stop: Trail with 4-hour 20 EMA
Time Horizon: 3-6 weeks
Bearish Scenario (40% Probability)
Invalidation Triggers:
Break below 24,500 on daily close
Head and Shoulders pattern develops (left shoulder at 25,200, head forming now, right shoulder anticipated)
MACD bearish crossover on daily chart
Short Strategy (Swing):
Entry Conditions:
Daily close below 24,500
RSI breaks below 50 on daily
Death cross forming (50 SMA crossing below 200 SMA - currently not present)
Targets:
Target 1: 24,200 (weekly support)
Target 2: 23,850 (50-day SMA)
Target 3: 23,500 (major support and 50-week EMA)
Stop Loss: Above 24,800
📉 RISK FACTORS & MARKET CONTEXT
Technical Risk Factors:
Overextension: Weekly RSI approaching 70 suggests limited upside without consolidation
Volume Divergence: If breakout occurs with declining volume, suspect false move
Elliott Wave: If in Wave 5, expect exhaustion and correction before new highs
External Market Considerations:
Macroeconomic Factors to Monitor:
Federal Reserve policy statements (October FOMC meeting expectations)
Q3 2025 earnings season for mega-cap tech (starting mid-October)
Geopolitical tensions and their impact on risk sentiment
US Dollar strength affecting multinational tech companies
Sector-Specific Catalysts:
AI technology developments and adoption rates
Semiconductor supply chain updates
Regulatory environment for big tech
Interest rate trajectory impacts on growth stocks
🛡️ RISK MANAGEMENT RULES
For All Trading Timeframes:
Position Sizing: Never risk more than 2% of capital on single trade
Stop Loss: Mandatory on every trade, no exceptions
Take Profits: Scale out at predetermined levels (50% at T1, 30% at T2, 20% at T3)
Maximum Daily Loss: Stop trading if down 4% in single day
Correlation Risk: NAS100 correlates with QQQ, SPX, and major tech stocks - monitor for divergences
Trading Journal Requirements:
Document all entries with screenshots
Record reasoning and technical setup
Track hit rate and average risk:reward
Weekly performance review and strategy adjustment
📅 WEEKLY INTRADAY ROADMAP
Monday, October 7:
Bias: Neutral to slightly bullish
Key Level: 24,750 (Friday's close area)
Strategy: Wait for direction after Asian/European session
Action: If holds above 24,700, look for longs on 15-min pullbacks
Tuesday, October 8:
Bias: Testing resistance at 24,950
Gann Time Cycle: Potential volatility day
Strategy: Breakout or rejection trades
Action: High-probability setups at extremes
Wednesday, October 9:
Bias: Continuation or reversal confirmation day
Strategy: Follow Tuesday's direction with momentum
Action: Trail stops on profitable positions
Thursday, October 10:
Bias: Mid-week profit-taking possible
Strategy: Mean reversion trades if overextended
Action: Watch for VWAP reversion setups
Friday, October 11:
Bias: Week-end positioning, reduced size
Strategy: Close most intraday positions before weekend
Action: Only high-conviction swing trades held over weekend
🎓 INDICATOR CONFLUENCE SUMMARY
Bullish Signals (Current):
✅ Price above 50-day, 100-day, and 200-day SMAs
✅ Ichimoku cloud bullish on daily and weekly
✅ MACD positive on multiple timeframes
✅ Volume profile shows accumulation
✅ Ascending triangle continuation pattern
✅ Gann angles supporting upward trajectory
Bearish Warnings:
⚠️ RSI approaching overbought on 4-hour
⚠️ Potential Elliott Wave 5 exhaustion
⚠️ Bollinger Bands showing overextension
⚠️ Stochastic overbought on shorter timeframes
Neutral/Watch:
🔍 Volume needs to increase on breakout attempts
🔍 Wyckoff accumulation phase requires confirmation
🔍 Head and Shoulders pattern could develop if resistance holds
🎯 FINAL TRADING RECOMMENDATIONS
For Intraday Traders:
Focus on the 24,650-25,100 range for the next week. Best opportunities exist at range extremes with clear risk management. Favor long setups given the broader bullish context, but remain nimble and respect stop losses.
Best Intraday Timeframes: 5-min for entries, 15-min for trend confirmation, 1-hour for bias
For Swing Traders:
The ascending triangle offers an excellent risk:reward setup. Consider building positions on pullbacks to 24,500-24,650 with stops below 24,450. Target the 25,350-25,800 zone over the next 4-6 weeks. Monitor daily candle closes for trend confirmation.
Best Swing Timeframes: Daily for entries, 4-hour for momentum, weekly for trend validation
⚡ KEY LEVELS SUMMARY CARD
Immediate Levels (Intraday):
🔴 Strong Resistance: 25,100-25,150
🟠 Resistance: 24,950-25,000
🔵 Current Price: 24,781
🟢 Support: 24,650-24,700
🟢 Strong Support: 24,500-24,550
Major Levels (Swing):
🔴 Major Resistance: 25,200-25,350
🔴 Psychological: 25,000
🟢 Major Support: 24,200-24,350
🟢 Critical Support: 23,500-23,680
📝 DISCLAIMER
This analysis is for educational and informational purposes only. Trading financial instruments carries substantial risk and may not be suitable for all investors. Past performance does not guarantee future results. Always conduct your own research and consult with licensed financial advisors before making trading decisions. The author is not responsible for any trading losses incurred based on this analysis.
Next Update: October 11, 2025
Analysis Valid Through: October 18, 2025
Prepared using advanced technical analysis incorporating Wyckoff, Elliott Wave, Gann, Harmonic Patterns, Ichimoku, and modern momentum indicators.RetryClaude can make mistakes. Please double-check responses.
BUY NASDAQOn the Nasdaq Futures, we went long on the market since it grabbed the minor sellside liquidity and gave us a FVG to ride, our target is the buyside liquidity.
Follow for more!

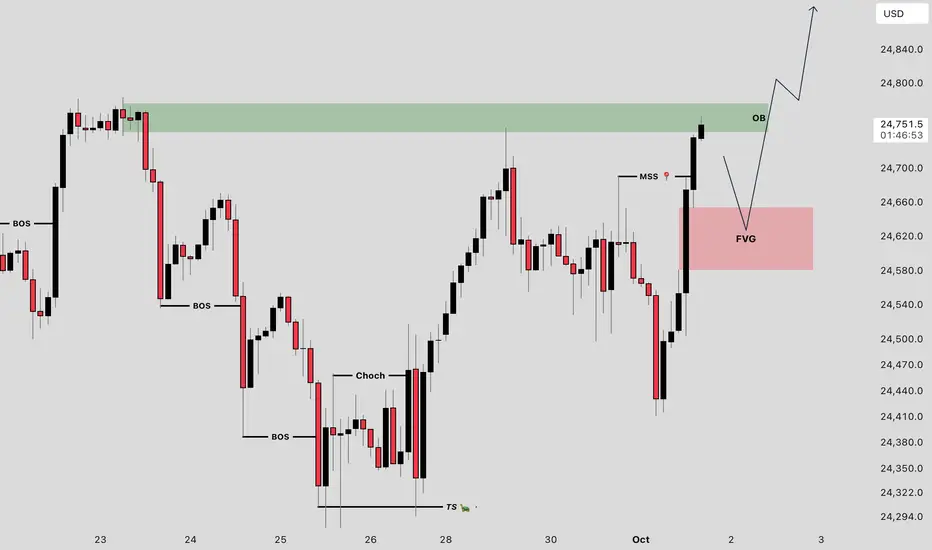
NASDAQ H2 OUTLOOK ! Sell NASDAQ At Ob
Buy NASDAQ At Fvg
These Two Setups We Have Now
Follow Us For More Trades
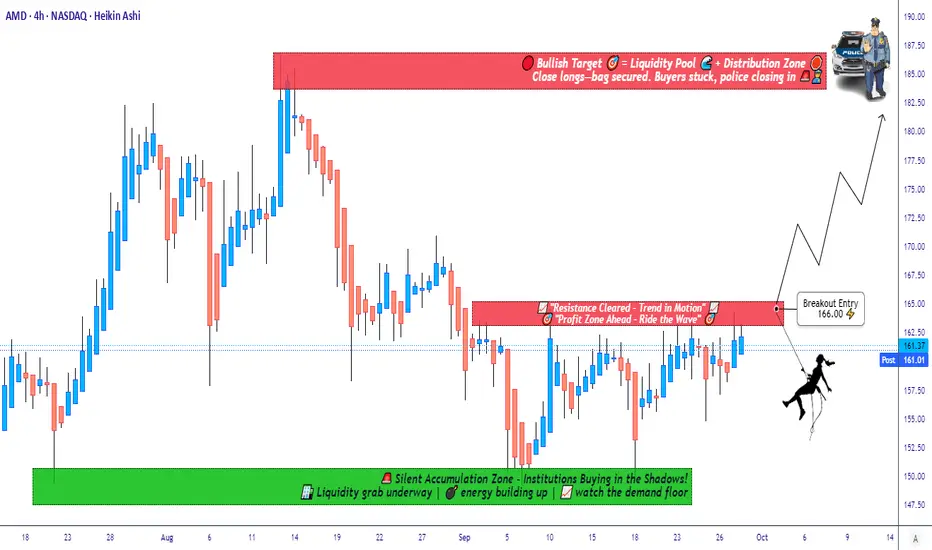
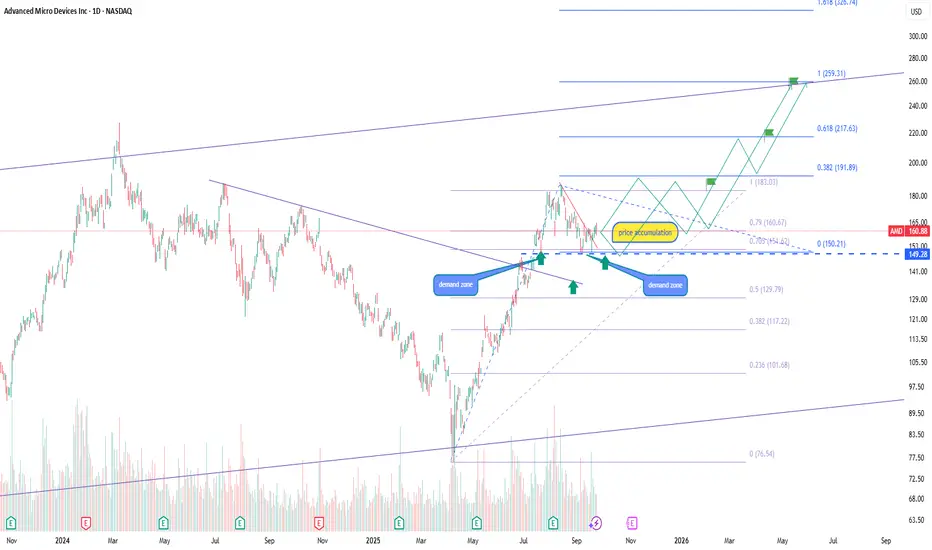
Breakout or Fakeout? Watching AMD Resistance for Next Big Move📈 AMD “Advanced Micro Devices, Inc” – Wealth Strategy Map (Swing/Day Trade)
🗺️ Plan:
I’m tracking AMD with a bullish strategy — waiting for a resistance level breakout to confirm momentum. Once price breaks the key barrier, entry opportunities open up.
🎯 Entry Setup (Thief Strategy Layering Method):
Instead of one entry, I’m applying a layering strategy with multiple buy limit orders. This approach helps average entries across different levels.
Buy limit layers: 155.00, 158.00, 160.00, 162.00, 163.00. 164.00
(💡 You can increase layers based on your own risk & comfort.)
Breakout confirmation: Entry after breakout price level mentioned.
🛑 Stop Loss (Thief SL):
Suggested stop loss @150.00
⚠️ Note: Dear Ladies & Gentlemen (Thief OG’s), this is my SL level, but you are not required to follow it. Manage risk according to your own plan.
🎯 Profit Target (Police Barricade Zone 🚨):
Price faces a strong resistance around 186.00 — this area acts as a trap zone with overbought conditions.
Target @186.00 (escape with profits before police catch you 🚔).
⚠️ Note: Again, TP is personal. Take profit when satisfied — your money, your choice.
🔗 Related Assets to Watch (Correlation Insight):
AMD tends to move in line with broader tech sentiment and semiconductors:
NASDAQ:NVDA (NVIDIA) – Direct sector competitor, often mirrors momentum.
NASDAQ:SMH (VanEck Semiconductor ETF) – Strong correlation, broader chip market direction.
NASDAQ:QQQ (NASDAQ 100 ETF) – AMD is a major component; index momentum often drives AMD.
NASDAQ:INTC (Intel) – Rival stock; negative news on INTC can boost AMD sentiment.
Watching these pairs helps confirm breakouts & avoid false signals.
✨ “If you find value in my analysis, a 👍 and 🚀 boost is much appreciated — it helps me share more setups with the community!”
⚠️ Disclaimer:
This is a Thief Style Trading Strategy — shared for fun & educational purposes only.
Not financial advice. Trade at your own risk.
#AMD #SwingTrade #DayTrade #Stocks #Semiconductors #TradingStrategy #BreakoutSetup #StockMarket #NVDA #QQQ
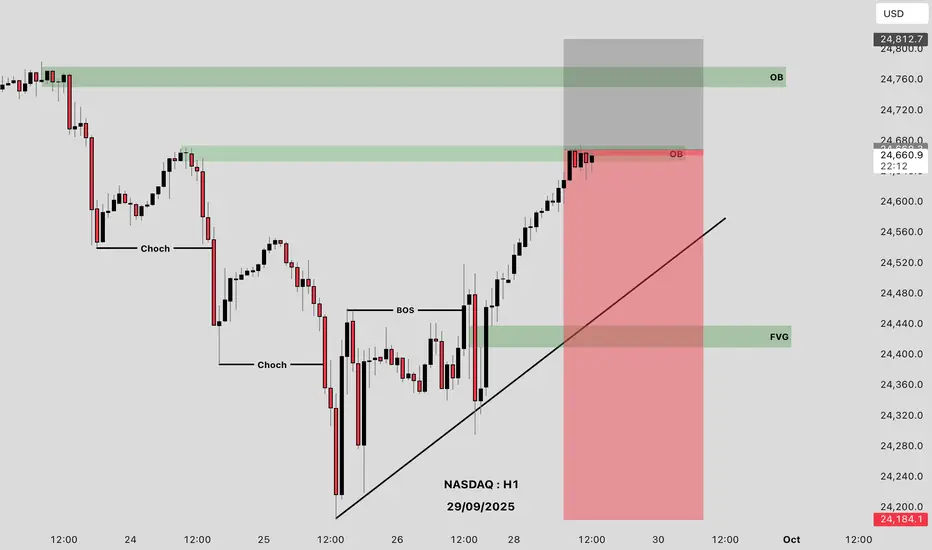
NASDAQ H1 OUTLOOKLets Nasdaq Sell
Reasons
Bearish Order Block
Who Is With Me Comment Your Opinion
Good Luck Guys
NASDAQ100 HIGH PROBABILITY SETUP SOON!!!🚨 NAS100 HIGH PROBABILITY BUY SETUP 🚨
* Here We Can See Clearly The Next Potential Moves For US100 Coming Hours/Days.
* Keep Your Eyes Close On Your Trading Positions.
* Happy PIP Hunting Traders.
FXKILLA.

NASDAQ100 HIGH PROBABILITY SETUP SOON!!!🚨 NAS100 HIGH PROBABILITY BUY SETUP 🚨
* Here We Can See Clearly The Next Potential Move For US100 Next Hours/Days.
* Keep Your Eyes Close On Your Trading Positions.
* Happy PIP Hunting Traders.
FXKILLA.

AMD reversal pattern and long-term growth potentialOn the AMD chart price holds the key support around 149–150 forming a base for continuation of the bullish trend. Above the consolidation zone at 160 targets open at 183, 217 and 259. In the longer-term perspective the structure points toward 326 and even higher as the trend remains bullish. Should a correction occur the 129 zone acts as major support to preserve the upward structure.
AMD keeps strengthening its market share in processors and GPUs, expanding rapidly in the server and AI segments. Strong demand for company products and its growing role in the AI ecosystem continue to attract institutional investors. Looking ahead to 2026, some analysts expect the stock to potentially reach levels around 900 per share.
Both the technical setup and fundamentals support further upside with near-term targets at 183, 217 and 259 while in the long-term a scenario above 300 and potentially up to 900 stays in focus for strategic investors. Risk-to-reward conditions provide a strong basis for holding existing positions and considering new entries. Additionally, investors may also look at opportunities through the AMD-linked ETF (AMDL).
SMH Bullish Setup – Breakout Plan for the Perfect Heist!🔥🚀 THIEF TRADER ALERT: SMH BULLISH HEIST PLAN! 🚀🔥
Asset: VANECK SEMICONDUCTOR ETF (SMH)
Plan: BULLISH BREAKOUT HEIST 🎯 (Resistance wall breakout candle close above 298.00)
🎯 THIEF ENTRY STRATEGY (LAYERING METHOD) 🎯
"Steal the dip like a PRO!" 💰🔪
Multiple Limit Orders (Layer Entry) 👇
1st Layer: 298.00 (Breakout Confirmation)
2nd Layer: 292.00 (Pullback Steal)
3rd Layer: 288.00 (Aggressive Discount)
4th Layer: 284.00 (Max Pain = Max Gain)
(Add more layers if you’re a risk-loving THIEF!)
⚠️ WARNING: DO NOT place SL or orders before breakout! (Only real THIEFS wait for confirmation!)
🛑 THIEF STOP LOSS (OG STYLE) 🛑
"Protect your loot or get wrecked!" 💣
SL @ 280.00 (Hard floor – adjust based on your risk appetite!)
Place SL ONLY AFTER breakout! (No premature stops – patience = profit!)
🎯 TARGET: 324.00 🚀 (OR ESCAPE EARLY IF MARKET TURNS)
Scalpers: Ride the waves, but stay LONG ONLY! 🌊
Swing Thieves: Hold & rob big! Use Trailing SL to lock gains! 🔐💰
📢 THIEF PRO TIPS:
✅ Set Alerts! (Don’t miss the breakout!) 🔔
✅ Watch for News! (Avoid getting caught in volatility traps!) 📉📈
✅ Boost & Support! (More boosts = more heists!) 💖🚀
🔥 FINAL MESSAGE:
"The market is a casino, and WE are the robbers! 🎰💰 Steal smart, escape rich! 🏴☠️💸"
👉 LIKE, BOOST & FOLLOW FOR MORE HEIST PLANS! 👈
🚀 NEXT HEIST COMING SOON… STAY TUNED! 🚀
#ThiefTrader #SMH #BreakoutHeist #LayerEntry #LimitOrderBandit 🎯🔥

NASDAQ NAS100 Analysis: Three-Drive Pattern, VWAP & Trade Plan📊 The NASDAQ 100 has been riding a strong bullish trend, pushing higher with relentless momentum. On the daily timeframe, price now looks heavily overextended 📈.
🔎 Zooming into the 4-hour chart, the overextension is even more apparent. In trending markets, we often observe a three-drive pattern (sometimes a fourth) before an aggressive correction occurs.
⚡ I’m keeping an eye out for a sharp pullback. If price finds support and confirms with a bullish break of market structure, this could present a high-probability long entry setup 🚀.
📹 In the video, I also dive into how I use the VWAP and Fibonacci retracement tools. Both are powerful indicators that provide valuable insight and a trading edge 🔧.
⚠️ Disclaimer: This analysis is for educational purposes only and not financial advice. Always trade responsibly and manage your risk.
