NASDAQ Inverse Head and Shoulders reboundI have been following this Falling Wedge pattern on Nasdaq (NDX) on the 1D time-frame for a month. My most recent post on this was the following:
As the price almost reached the 0.236 Fibonacci retracement level, which is a symmetrical Support, it is time to update my outlook on the index. The 1D RSI made a bounce on its Higher Lows trend-line since January 25 and in doing so, a new pattern has emerged, an Inverse Head and Shoulders (IH&S). It appears that we are currently on the Right Shoulder, which should push for a rebound.
As mentioned before, the natural barrier is the Lower Highs trend-line of the December 28 2021 High and then the technical Resistance of the 1D MA200 (orange trend-line) and the 0.618 Fibonacci retracement level within 15,250 - 15,280. A break above, restores the long-term trend on Nasdaq, and should target the 0.786 Fib (15,870) and then the 16,670 High. A break below the 0.236 Fib, should make one more leg downwards to re-test the 1W MA100 (red trend-line).
--------------------------------------------------------------------------------------------------------
Please like, subscribe and share your ideas and charts with the community!
--------------------------------------------------------------------------------------------------------
Nasdaqsignals

NAS100 bullish forecast but first look out for this!Hello traders,
Happy to be back here after a short break. Let's start of with Nas100 as usual.
Technically, we have seen significant developments the past couple of weeks. With U.S. stocks rising tremendously the past weeks due to the Federal Reserve approving to hike interest rate for the first time in more than three years since December 2018. Recently we saw downward slight correction in giant stocks that also sent Nas100 down from its recent high of 15270.00, correcting with at least -7.50% as of time of writing.
At this very moment, we are not fully certain if the downward move will still continue and where it will end.
Meanwhile, I have spotted some signs of price reversal at around 14000.00-14200.00.
First: Looking at Daily or 4 hour time-frames I spotted a triple bottom, obviously a market structure that sponsored the move to the upside on 15 March 2022, fueled by FED interest rate hike. The market currently trading in the vicinity of the previous broken high that we can consider as our neckline. If this means a retest of the neckline we could see price reacting at this level and market resume its bullish move.
Second, on lower time-frame. I have spotted a broadening Descending Wedge, a classic pattern considered as a reversal sign. If all these play out accordingly, we could see price reversing up to resume the upward momentum that will eventually even take price higher. For proper buy entries, it is best to wait for the broadening descending wedge broken to the top to confirm buyers strength.
30 Minutes timeframe: Broadening Descending Wedge
We should still carefully consider how the market will respond during the New York session opening today. We can expect fake moves to the downside or we can expect a strong impulse to the downside if sellers continue to press harder. If bears do press harder and break the 14000 psychological level and defend it, then our next support will be 13840.00 and 12950.
Traders, if you find this idea helpful please do show your support with likes. If you have any suggestion please do share it in the comment section below.
Trade smart❤️

NASDAQ going according to last week's plan. Eyes on 1D MA50/100.Nasdaq (NDX)has is following exactly last week's suggested trading plan so far, as it pulled-back from the 1D MA200 (orange trend-line) and today reached the 1D MA50 (blue trend-line):
This pull-back took place primarily because the index failed to break above the Lower Highs trend-line of the December 28 High and got rejected two times. So far, as I displayed with the green Triangle, this is a neutral zone. Some scalping value can be found within. However the medium-term trend is about to be revealed:
* A break below the 1D MA50 (needs a 1D candle closing below), which is also the 0.382 Fibonacci retracement level, opens the way for more selling towards Fib 0.236 (13815) and the 1W MA100 (red trend-line), which supported twice before on February 24 and March 15.
* A break above the Lower Highs or better yet the 1D MA200, which is also the 0.618 Fibonacci retracement level, restores the bullish trend aiming at Fib 0.786 (15870) and the 16670 High. The 1D RSI so far favors the bullish scenario.
--------------------------------------------------------------------------------------------------------
** Please support this idea with your likes and comments, it is the best way to keep it relevant and support me. **
--------------------------------------------------------------------------------------------------------
NASDAQ SHORTS 📉📉📉📉 NASDAQ/US100 - Market Analysis for the upcoming week.
What do you think ? Comment below..

NASDAQ is looking for a buyNASDAQ break the structure and now looking for a buy to target 15600.
we have to manage risk, price can go into the opposite direction.

NASDAQ last barrier to break. Consolidation until then.On my most recent Nasdaq analysis 2 weeks ago, I laid out the key pressure levels of the uptrend that started after the March 15 bottom:
As you see, the index invalidated the Channel Down and by breaking above the 1D MA50 (blue trend-line), it naturally reached as high as the 1D MA200 (orange trend-line), which broke yesterday. However, it is clear that the wider pattern has been a Falling Wedge and not surprisingly, the index is currently struggling to break above its Lower Highs (top) trend-line.
If the news of this week (starting today with the GDP and completing on Friday with the Nonfarm Payrolls) turn out bullish enough to manage a break above the Wedge, then NDX will target the next Fib in line, the 0.786 retracement level (15870) and then complete the correction's recovery at 16670 (requirement is for one 1D candle to close above each Resistance level). Notice how yesterday's top came exactly on the 0.618 Fib.
If however the price gets rejected on the Lower Highs (and 0.618 Fib), expect a short-term consolidation within the two MA periods, with the 1D MA50 in support. Breaking below the 1D MA50 will be far from ideal, putting at risk the 0.236 Fib and the March 15 Support.
--------------------------------------------------------------------------------------------------------
** Please support this idea with your likes and comments, it is the best way to keep it relevant and support me. **
--------------------------------------------------------------------------------------------------------

Is it time to buy technology? - NQ1!
We can see that a resistance of more than 10 years was broken, which would now be a strong support.

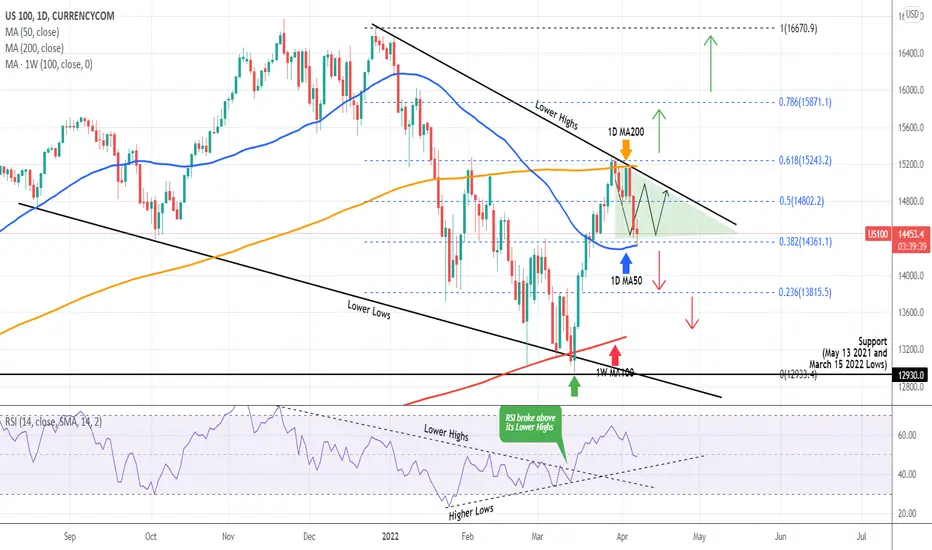
NASDAQ Still bearish despite the RSI break-outNasdaq has been trading within a Channel Down since the January 24 Low. The index is approaching today the top (Lower Highs trend-line) of the Channel and will remain bearish, unless it breaks above the 1D MA50 (blue trend-line), which comfortably sits just above the top of the Channel. That should target the 1D MA200 (orange trend-line), which trends just below the 0.618 Fibonacci retracement level.
If the price is rejected though at the top of the Channel Down or on the 1D MA50, expect a re-test of the 12930 Support and if broken the -0.236 Fibonacci extension. It has to be said though that the 1D RSI broke yesterday above the Lower Highs trend-line since November 04. That is the first bullish sign since the correction started.
--------------------------------------------------------------------------------------------------------
** Please support this idea with your likes and comments, it is the best way to keep it relevant and support me. **
--------------------------------------------------------------------------------------------------------


Nasdaq 100 What Now?So it's a new week in Nasdaq and I can tell the bears are not done. we've got the market still struggling at the 13750/700 support level here on the 240.
Guys I've got a theory and trading plan. it all depend on the opening a bearish opening leave room for speculations likewise a bullish.
However, on the daily, we've got a cross where if the ears break, then we've got a wick to fill and if not, then another bullish divergence that takes us to create a higher-high
Levels to consider:
13750/13700---Our current deciding factor.
13500-13000---If the ears break past the 13700 support that should be a new target.
13700-14000---The bulls would prove their strength once these levels are broken.
Be sure to follow me, like and comment to keep the community of Nasdaq100 lovers alive.
Love,
Lazyluchi.

Nas100 bearish outlook and NFP expectationTraders, due to the tension between Russia and Ukraine the stock market was left volatile the past days and without clear indication as to where it is heading. But looking at the technical aspect of Nas100 we can only tell that it is in a strong bearish momentum and bulls are finding it hard to push price further high. Price dropped at around 14400 and we see it again trading within the falling channel. My expectations in few minutes during NFP are to see price rolling down and perhaps bears pushing price lower targeting 13200 or at least 13000 if possible.
Please support this idea with likes.❤️
Please trade smart.

NAS100 - Next Swing Low for Potential Buyers😍Previously -
Simple, we like to see price drop for us to add to our long positions
Use our analysis as a sentiment
Analysis is only 1 piece of the puzzle 🧩
Our analysis is a sentiment for the upcoming week, month.
Use this as a weather forecast, you are the person that has to put on a jacket when it’s raining.
Trade this sentiment based off your own entry strategy at the right time.
Flow with the Devil 😈
Trade with the manipulation👾
STAY UPDATED BELOW!

NASDAQ changing channel bands for the next 10 years?This is Nasdaq on the 1M time-frame since the recovery from the sub-prime mortgage crisis was set in motion in 2010.
As shown, the index has been trading within a Channel Up (log chart) from 2010 until mid 2020. Then in July 2020, it appears that NDX switched bands to one zone higher, illustrated perfectly by using the Fibonacci Channel extensions. As you see, since July 2020, the Fib 1.0 level which was previously the Resistance (top/ Higher Highs trend-line) of the former 2010 - 2020 Channel, has turned into a Support (bottom/ Higher Lows trend-line), and is being currently tested by the current 1M candle of February.
Every such Channel bottom test, has been a unique long-term buy opportunity during these +10 years. With the 1M MA50 (blue trend-line) rising rapidly towards the 1.0 Fib level, do you think that will turn into a Support for the next 10 years? Based on this pattern, that looks like the most probable scenario.
P.S. Check also the very consistent Resistance and Support levels on the RSI.
--------------------------------------------------------------------------------------------------------
** Please support this idea with your likes and comments, it is the best way to keep it relevant and support me. **
--------------------------------------------------------------------------------------------------------

NASDAQ - WEEK 9NASDAQ - WEEK 9
The stock market pushed higher as commodities fell. I have no confidence in the stock market due to its extreme vulnerability. NASDAQ is moving between lines marked and I will be interested in a sell from 14500.

Nas100 remains under pressure and downward move is more likelyNas100 remains under pressure and downward move is more likely to happen. Same applies to US 30 and S&P 500.
Looking at market structure with lower highs and lower lows getting printed we can expect bulls to still have a challenging moment. As I mentioned last time in my previous idea bears are still in domination and they eye the 13000 psychological level.
Only if 14000 should be breached above and bulls defend this level we can see price reaching to the nearest high of 14600. At this moment there's high possibility that bears will push price lower at least printing a new low.
We will wait for proper confirmation to confirm the direction of the market. My bias is still bearish at the moment.
Let me know in the comment section below if you have different idea on this.
Please show your support with likes. ❤️

$NQ Top is In on the 1M - $9007$NQ top is clearly in on the 1M chart. Bearish engulfing candle with key resistances needing to be retested. The global economic picture is becoming more gloomy as the US defaults on its debt for the first time ever this winter (2021).
As an investor and avid study of the markets, I look for value buys with high probabilities of long term triple digit returns. I will look to back the truck up in $NQ at $9007, until then every bounce is just a distraction.
- PennyBags
CME_MINI:NQ1!

NAS100 Buy AnalysisPrice has broke out of the trendline on 1H timeframe
Currently looking for long potential positions which confluence with the retest of the level the market broke out

Nasdaq Analysis 16.02.2022Hello Traders,
welcome to this free and educational analysis.
I am going to explain where I think this asset is going to go over the next few days and weeks and where I would look for trading opportunities.
If you have any questions or suggestions which asset I should analyse tomorrow, please leave a comment below.
I will personally reply to every single comment!
If you enjoyed this analysis, I would definitely appreciate it, if you smash that like button and maybe consider following my channel.
Thank you for watching and I will see you tomorrow!

NASDAQ UP Trend.!#NASDAQ Looking for Buy trade setup as I mentioned in the Chart.!
Keep Supporting LIKE, COMMENT And FOLLOW.!
Thank You.!

NDX Nasdaq W shaped recovery ???We might see an euphoric W shaped recovery after Russia reported pullback of military troops.
Some military units will start returning to their permanent bases after completing drills near the Ukrainian border, said the Russian Defense Ministry.
Looking forward to read your opinion about it.

Nasdaq 100 Analysis/ Ideas ShortNasdaq 100 is on the long run to test the major resistant zone again after its bullish break out from the regression channel. And it has been cleanly rejected twice at the same level with 200 SMA which also corresponded to the 61.8 fib level. Looking at the current up trend towards the resistant level, the trend has bounced up the the support line twice, first at 13863.75 and the second one at 14499.50 and there is every tendency that the third retest will be at 14779.00 bottom of the line before an impulse move to the resistant zone. At this point, we are expecting a massive bearing move to the first TP point @14499.50, and then the next fib level 61.8 which 14287.50..
Please be warned, this is not a financial advise, if you must take this, wait for clear confirmation before entry. Like, share and leave a review.

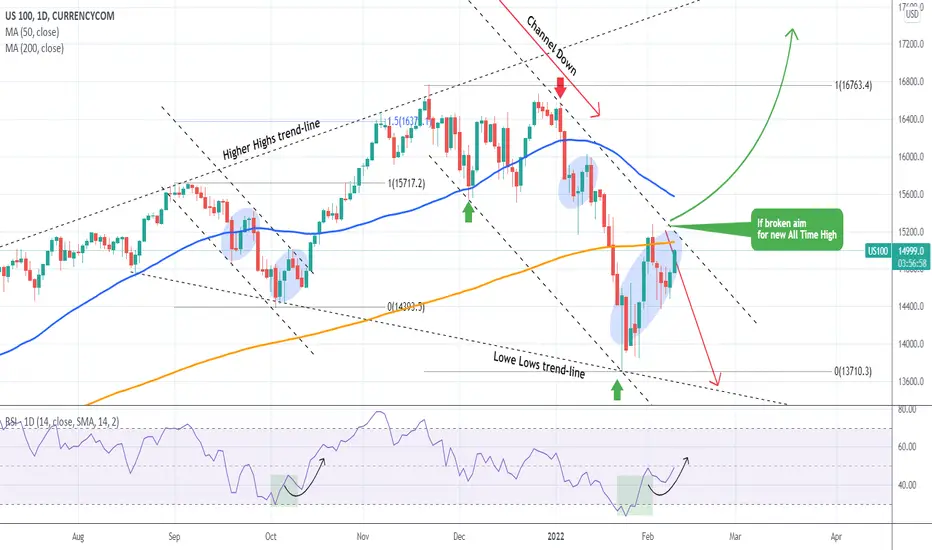
NASDAQ is about to break into long-term bullish territory again.Basically this is a quick update to my January 31 analysis on NDX where I made a case for the importance of this Channel Down:
Initially the price got rejected near the top (Lower Highs) trend-line of the Channel Down but since yesterday, it is staging a comeback. As mentioned before, a break above it, will most likely restore the long-term bullish trend on Nasdaq and will aim for new All Time Highs (potentially near the 1.5 Fibonacci extension long-term).
The finding of the current idea though, is that the current Channel Down resembles that of the previous correction during September 06 - October 13 2021. For a better illustration, see that Channel below on the 12H time-frame, where th MA50 and the MA200 trend-lines are similar to those of the current Channel Down on the 1D time-frame:
Breaking above the 1D MA50 this time, most likely confirms the above.
--------------------------------------------------------------------------------------------------------
** Please support this idea with your likes and comments, it is the best way to keep it relevant and support me. **
--------------------------------------------------------------------------------------------------------
Buy NasdaqLooking at the bigger timeframes (TF) Nasdaq looks like it broke the downtrend starting the movement to the upside.
Confluences:
1- MACD giving buys signals
2- Moving averages about to cross to the up side (4H)
3- Price is currently at 0.38 fib level (daily) which for me indicates the end of retracement.
