cup with handle pattern on the 1-hour time frameWelcome to today's analysis! Let’s break down the current price action on NASDAQ:NVDA and potential trade setups.
🌐 Overview: NASDAQ:NVDA Forming a Cup with Handle Pattern
📈 NASDAQ:NVDA is currently forming a cup with handle pattern on the 1-hour time frame. This pattern is typically bullish and could indicate a potential upward move.
🔄 Current Scenario:
NASDAQ:NVDA has formed a cup shape and is now developing the handle. The handle is a consolidation phase before a potential breakout.
The key level to watch is the resistance at the top of the handle. A breakout above this level could signal a bullish continuation.
🔑 Key Levels to Watch
🔴 Resistance: Top of the Handle (Needs breakout for continuation)
🟢 Target: Measured move equal to the depth of the cup, projected from the breakout point.
🛠️ Trade Scenarios
📌 Bullish Scenario (Breakout Above Resistance)
If NASDAQ:NVDA breaks and holds above the handle resistance, it could move toward the target level.
This breakout would confirm the cup with handle pattern and suggest a potential upward trend.
📌 Bearish Scenario (Failure to Breakout)
If NASDAQ:NVDA fails to break out and instead moves lower, it could retest the support levels within the cup or handle.
A failure to hold above key support levels could indicate a potential reversal or further consolidation.
📌 Conclusion
NASDAQ:NVDA is forming a cup with handle pattern on the 1-hour time frame. A breakout above the handle resistance could signal a bullish move toward the target level. If the price fails to break out, further consolidation or a retest of support levels may be necessary.
Nasdaqsignals

Nasdaq market analysis: 23-APRIL-2025Good morning Dear Traders! Join me for Nasdaq market analysis for today. Share your charts, ask questions, and let's discuss trading strategies.

NASDAQ Decision making becomes easy after seeing this chart.NASDAQ (NDX) is currently on the 3rd straight red month (1M candle), following the February High and subsequent sell-off due to the Trade War. This has been analyzed extensively in previous analyses and how the fundamental scene is only now starting to show some positive progress but still has a long way to go.
Technically though, the picture is very clear and favors long-term investing. The market has been trading within a Fibonacci Channel Up since the U.S. Housing Crisis in 2008 and along with the 2022 Inflation Crisis, those have been the only real Bear Cycle events in the past 18 years.
In between those there have been another 5 shorter term corrections, that offered great buying opportunities for the long-term and the recent 3-month one classifies as one.
There reasons are three. First it has come very close to the 1M MA50 (blue trend-line), which only broke during the Major Corrections. Second, the 1M RSI hit the 50.50 Symmetrical Support, which has held during all those 5 prior Minor Corrections. Third, those corrections only range between two Fibonacci levels.
The current correction fulfills all those conditions. And since the 'weakest' rally we've have on this 5 event sample has been +37.57% and the strongest +96.77%, we have a medium-term Target on Nasdaq at 22800 and a long-term one at 32500.
Do you still reserve doubts at investing long-term after seeing this macro chart?
-------------------------------------------------------------------------------
** Please LIKE 👍, FOLLOW ✅, SHARE 🙌 and COMMENT ✍ if you enjoy this idea! Also share your ideas and charts in the comments section below! This is best way to keep it relevant, support us, keep the content here free and allow the idea to reach as many people as possible. **
-------------------------------------------------------------------------------
💸💸💸💸💸💸
👇 👇 👇 👇 👇 👇

US100 Will Grow !
HI,Traders !
US100 is trading in an
Uptrend and the price is
Now consolidating above
The horizontal support
Of 18178.2 and as we are
Bullish biased we will be
Expecting a further bullish
Move up !
Comment and subscribe to help us grow !

NQ! Short Idea (MMXM, Quarterly Theory) LONDON REVERSALHello everyone, today you will see my current Short Idea on the Nasdaq. I want to see the reaction of the 15M OB that we are sitting in, if we show Disrespect of that Area, I will be looking for Shorts.
Praise be to God
-T-

NAS100 Rebound Setup – Bulls Gaining Strength Again?The NAS100 has bounced strongly from the high-volume demand zone (16,700 – 17,800) highlighted by LuxAlgo's Supply and Demand indicator. The current price is consolidating near 18,700, building momentum for a potential breakout.
Key Technical Zones:
Demand Zone: 16,700 – 17,800 (high buy interest)
Support Level: 17,828.9
Resistance 1: 20,350.6 (first upside target)
Major Supply Zone: 21,775.4 (big decision point for bulls)
Bullish Outlook:
Price has reclaimed the 17,828.9 support and is forming higher lows.
A strong break above 19,000 could send price to test 20,350, then possibly 21,775.
Green arrows show the bullish potential if price holds above support.
Bearish Risk:
A breakdown below 17,828.9 could signal a return to the demand zone.
Watch for rejection candlesticks or divergence signals near resistance.
Volume Profile Insight:
LuxAlgo's visible range shows strong buyer interest below 18,000, indicating institutions may be accumulating positions.
---
Trade Idea: Look for a confirmed breakout above recent highs near 18,800 for long entries. Conservative traders may wait for a pullback to 17,800 for better risk-reward.
---
What’s your take on NAS100? Will buyers push it to 20K+ or is this just a trap rally? Share your thoughts below!
#NASDAQ #US100 #NAS100 #IndexTrading #SupplyAndDemand #LuxAlgo #ForexAnalysis #StockMarket #TradingView #TechnicalAnalysis #BullishSetup

NASDAQ Trump's 2 TRADE WARS are identical! What you need to knowNASDAQ (NDX) had a massive bullish reversal 1W candle last week as, despite a Lower Low opening, the intra-week rebound surpassed the opening of the previous week. The sell-off reached almost as low as the 1W MA200 (orange trend-line) , which has been the Support level of the late 2022 Inflation Crisis bottom and has been untouched for more than 2 year.
This is not the first time we see this pattern. In an interesting twist of events, we saw the exact same formation during Trump's 1st Trade War, which bottomed on the week of December 24 2018, near the 1W MA200 as well and exactly on the 0.382 Fibonacci retracement level from the Top.
The similarities don't stop there as both Trade War periods were manifested within Megaphone patterns. Their sell-off/ Bearish Leg was -25% (now) and -23% (2018) respectively, while the set-up leading to those Megaphones was a +103.50% and +113.50% Bull Cycle respectively. Also both sell-offs got an oversold (30.00 or lower) 1W RSI bottom.
So, since NDX has currently completed a -25% correction near the 1W MA200 and the 0.382 Fib with the 1W RSI bouncing off the oversold barrier, it is very likely that we've formed the pattern's bottom, especially if the global fundamentals point towards trade deals.
If this Low remains intact, we expect a similar +35% short-term Top at 22500 within a 3-4 month period and then long-term rally near the -0.382 Fibonacci extension at 29000.
-------------------------------------------------------------------------------
** Please LIKE 👍, FOLLOW ✅, SHARE 🙌 and COMMENT ✍ if you enjoy this idea! Also share your ideas and charts in the comments section below! This is best way to keep it relevant, support us, keep the content here free and allow the idea to reach as many people as possible. **
-------------------------------------------------------------------------------
💸💸💸💸💸💸
👇 👇 👇 👇 👇 👇

Nasdaq market analysis: 14-APRIL-2025Good morning! Happy New Week! Here's your daily Nasdaq market analysis. Learn, grow, and trade wisely.

"NAS100/US100" Index Market Money Heist Plan (Day / Scalping)🌟Hi! Hola! Ola! Bonjour! Hallo! Marhaba!🌟
Dear Money Makers & Robbers, 🤑💰✈️
Based on 🔥Thief Trading style technical and fundamental analysis🔥, here is our master plan to heist the "NAS100/US100" Index CFD Market. Please adhere to the strategy I've outlined in the chart, which emphasizes short entry. Our aim is the high-risk Green MA Zone. Risky level, oversold market, consolidation, trend reversal, trap at the level where traders and bullish robbers are stronger. 🏆💸"Take profit and treat yourself, traders. You deserve it!💪🏆🎉
Entry 📈 : "The heist is on! Wait for the MA breakout then make your move at (16400) - Bearish profits await!"
however I advise to Place sell stop orders above the Moving average (or) after the Support level Place sell limit orders within a 15 or 30 minute timeframe most NEAREST (or) SWING low or high level.
📌I strongly advise you to set an "alert (Alarm)" on your chart so you can see when the breakout entry occurs.
Stop Loss 🛑: "🔊 Yo, listen up! 🗣️ If you're lookin' to get in on a sell stop order, don't even think about settin' that stop loss till after the breakout 🚀. You feel me? Now, if you're smart, you'll place that stop loss where I told you to 📍, but if you're a rebel, you can put it wherever you like 🤪 - just don't say I didn't warn you ⚠️. You're playin' with fire 🔥, and it's your risk, not mine 👊."
📌Thief SL placed at the nearest/swing High or Low level Using the 4H timeframe (17300) Day/Scalping trade basis.
📌SL is based on your risk of the trade, lot size and how many multiple orders you have to take.
Target 🎯: 15300 (or) Escape Before the Target
"NAS100/US100" Index CFD Market Heist Plan (Scalping / Day Trade) is currently experiencing a Bearish trend.., driven by several key factors.👇👇👇
📰🗞️Get & Read the Fundamental, Macro, COT Report, Geopolitical and News Analysis, Sentimental Outlook, Intermarket Analysis, Index-Specific Analysis, Positioning and future trend targets... go ahead to check 👉👉👉🔗🔗
Detailed Explanation 📝
Fundamentals: Growth stalls 📉, valuations adjust—bearish shift 🐻.
Macro: Cooling economy 🌍, sticky inflation 🔥—downward pressure.
COT: Speculators flee 📉, hedgers dig in—bearish signal 🐻.
Index: Correction deepens 📉, support tests near—technical bear 🐻.
Intermarket: Yields/USD crush risk assets 💪—bearish tide.
Geopolitical: Trade wars ⚔️, regulation 🔍—negative catalysts pile up.
Sentiment: Fear takes hold 😟—bearish consensus builds.
Trends: Near/medium-term declines 📉, long-term hinges on recovery ⚖️.
Outlook: Moderately bearish 🌩️—tough sledding ahead.
⚠️Trading Alert : News Releases and Position Management 📰 🗞️ 🚫🚏
As a reminder, news releases can have a significant impact on market prices and volatility. To minimize potential losses and protect your running positions,
we recommend the following:
Avoid taking new trades during news releases
Use trailing stop-loss orders to protect your running positions and lock in profits
💖Supporting our robbery plan 💥Hit the Boost Button💥 will enable us to effortlessly make and steal money 💰💵. Boost the strength of our robbery team. Every day in this market make money with ease by using the Thief Trading Style.🏆💪🤝❤️🎉🚀
I'll see you soon with another heist plan, so stay tuned 🤑🐱👤🤗🤩

BIG BIG weekI think 7 FED speakers,
A lot of tension in the markets, tops mean polarisation, considering reflexivity theory extreme volatility will ensue.
A lot of people might think the -0.786 ATH we got before the holidays is the top. I think they are mistaken as seen in the analysis below.
There is still legroom for higher, this is a big bet on my part.
I have a few contracts on the mag7 (GOOGL, TSLA and META) focusing on GOOGL since they seem to be in the same headwind as S&P
Let's see how this plays out

Nasdaq insights: 10-APRIL-2025Rise and shine, traders! Start your day with actionable Nasdaq insights. Let's grow your skills together, one chart at a time.

Nasdaq market analysis: 09-APRIL-2025Good morning, traders! Welcome to today's Nasdaq market analysis. Compare my price action insights with your own charts and enhance your trading skills.

NASDAQ Black Monday or a Massive Rally??Nasdaq (NDX) opened on early Monday futures trade below both its August 05 2024 and April 19 2024 Lows. All technical Supports have been broken and the market made new 12-month Lows. The market sentiment is extremely bearish, technically oversold, even the 1W RSI is below the 30.00 oversold barrier and the prevailing fundamentals regarding the back-and-forth Tariffs between nations don't leave much room for encouragement.
The index is more than -25% off the February 17 2025 All Time High (ATH), technically Bear Market territory, and the last time it dropped more this fast is during the lockdowns of the COVID crash (February 20 - March 23 2020). The market dropped by -32%, below also all known technical Supports (including its August low) before finding support and forming a bottom just above the 1W MA200 (red trend-line).
The two time events are virtually identical with the only notable difference is that Nasdaq is about to form the 1D Death Cross now while in 2020 it did about 1 month after the low.
The only technical development that leaves room for encouragement is that the 1W RSI during COVID got oversold just a day before the eventual market bottom.
Does today's 1W RSI drop into oversold territory mean that we are about to form a bottom? Unknown. But what we do know is that on March 03 and 16 2020 on two urgent, out-of-schedule meetings, the Fed stepped in to save the market from the free-fall (and save they did) by cutting the Interest Rates to near zero (first to 1.25% and then to 0.25% subsequently from 1.75% previously).
Perhaps that is the only thing that can restore investor confidence (certainly the only action that the Fed can do) and avoid a Black Monday below the 1W MA200, which would be catastrophic. On the other hand, if the U.S. government reach indeed trade deals with the rest of nations and the Fed do what they can from their end, we may even hit new ATH by August!
So what do you think it's going to be? Black Monday or Massive Rally?
-------------------------------------------------------------------------------
** Please LIKE 👍, FOLLOW ✅, SHARE 🙌 and COMMENT ✍ if you enjoy this idea! Also share your ideas and charts in the comments section below! This is best way to keep it relevant, support us, keep the content here free and allow the idea to reach as many people as possible. **
-------------------------------------------------------------------------------
💸💸💸💸💸💸
👇 👇 👇 👇 👇 👇

"NAS100 / US100" Index CFD Market Heist Plan (Day or Swing)🌟Hi! Hola! Ola! Bonjour! Hallo! Marhaba!🌟
Dear Money Makers & Robbers, 🤑 💰💸✈️
Based on 🔥Thief Trading style technical and fundamental analysis🔥, here is our master plan to heist the "NAS100 / US100" Index CFD Market. Please adhere to the strategy I've outlined in the chart, which emphasizes long entry. Our aim is the high-risk Red Zone. Risky level, overbought market, consolidation, trend reversal, trap at the level where traders and bearish robbers are stronger. 🏆💸"Take profit and treat yourself, traders. You deserve it!💪🏆🎉
Entry 📈 : "The heist is on! Wait for the MA breakout (20000) then make your move - Bullish profits await!"
however I advise to Place Buy stop orders above the Moving average (or) Place buy limit orders within a 15 or 30 minute timeframe most recent or swing, low or high level.
📌I strongly advise you to set an alert on your chart so you can see when the breakout entry occurs.
Stop Loss 🛑:
Thief SL placed at the recent/swing low level Using the 1H timeframe (19400) swing trade basis.
SL is based on your risk of the trade, lot size and how many multiple orders you have to take.
🏴☠️Target 🎯: 20800 (or) Escape Before the Target
🧲Scalpers, take note 👀 : only scalp on the Long side. If you have a lot of money, you can go straight away; if not, you can join swing traders and carry out the robbery plan. Use trailing SL to safeguard your money 💰.
"NAS100 / US100" Index CFD Market Heist Plan (Swing/Day) is currently experiencing a bullishness,., driven by several key factors.
📰🗞️Get & Read the Fundamental, Macro, COT Report, Geopolitical and News Analysis, Sentimental Outlook, Intermarket Analysis, Index-Specific Analysis, Positioning and future trend targets.. go ahead to check 👉👉👉
📌Keep in mind that these factors can change rapidly, and it's essential to stay up-to-date with market developments and adjust your analysis accordingly.
⚠️Trading Alert : News Releases and Position Management 📰 🗞️ 🚫🚏
As a reminder, news releases can have a significant impact on market prices and volatility. To minimize potential losses and protect your running positions,
we recommend the following:
Avoid taking new trades during news releases
Use trailing stop-loss orders to protect your running positions and lock in profits
💖Supporting our robbery plan 💥Hit the Boost Button💥 will enable us to effortlessly make and steal money 💰💵. Boost the strength of our robbery team. Every day in this market make money with ease by using the Thief Trading Style.🏆💪🤝❤️🎉🚀
I'll see you soon with another heist plan, so stay tuned 🤑🐱👤🤗🤩

Bitcoin vs. Nasdaq: BTC Shows Signs of Decoupling Amid US Stock
For years, the narrative surrounding Bitcoin’s price action has been inextricably linked to the performance of traditional financial markets, particularly the tech-heavy Nasdaq Composite. Often moving in lockstep, Bitcoin was viewed by many as a high-beta asset, amplifying the gains during bullish periods and suffering even steeper losses when risk sentiment soured in equities. However, recent market movements have sparked a crucial question among investors and analysts alike: is Bitcoin finally beginning to forge its own path, decoupling from the gravitational pull of U.S. stocks as they face mounting headwinds?
The past few weeks have witnessed a notable divergence. While U.S. stock markets, reeling from a confluence of factors including escalating geopolitical tensions stemming from a potential “Trump tariff war,” persistent inflation concerns highlighted by Federal Reserve Chair Jerome Powell’s hawkish warnings of “higher inflation and slower growth,” and broader macroeconomic anxieties, have experienced a significant downturn – shedding a staggering $3.5 trillion in value – Bitcoin has demonstrated a surprising degree of resilience, even posting gains in some instances. This nascent divergence has ignited a wave of optimism among Bitcoin proponents who have long yearned for the digital asset to be recognized and traded based on its own fundamental merits, rather than as a mere proxy for risk-on sentiment in the equity markets.
The concept of Bitcoin decoupling from traditional assets has been a recurring theme in the cryptocurrency space. The original thesis for Bitcoin, after all, positioned it as a decentralized, censorship-resistant store of value and a hedge against traditional financial system vulnerabilities. Its finite supply, its independence from central banks and government policies, and its inherent scarcity were touted as key differentiators that would eventually lead it to trade independently. However, the reality of the past few years has often painted a different picture, with institutional adoption bringing increased correlation with established asset classes.
The current shift, however tentative, offers a glimmer of hope for those who believe in Bitcoin’s unique value proposition. The factors contributing to the stock market slump – trade war anxieties, inflation fears, and the prospect of tighter monetary policy – arguably strengthen the case for Bitcoin as an alternative asset. In times of economic uncertainty and currency debasement concerns, the fixed supply and decentralized nature of Bitcoin could become increasingly attractive to investors seeking a safe haven outside the traditional financial system.
Furthermore, the increasing maturity of the Bitcoin market, with the development of more sophisticated trading instruments, greater institutional participation, and a deeper understanding of its underlying technology, may be contributing to its growing independence. As Bitcoin gains broader acceptance as a legitimate asset class, its price discovery mechanisms may become less reliant on the sentiment driving traditional equity markets.
However, it is crucial to approach this apparent decoupling with a degree of caution. While the recent divergence is encouraging for Bitcoin bulls, it is too early to definitively declare the long-awaited break has finally arrived. Market correlations can be fluid and influenced by a multitude of factors. A sudden shift in global risk sentiment or a significant negative event specific to the cryptocurrency space could easily re-establish the link between Bitcoin and traditional assets.
Adding a layer of complexity to the current narrative is the warning from some analysts regarding a potential Bitcoin price correction. Despite the recent resilience, multiple BTC price forecasting models have pointed towards a scenario where Bitcoin could fall back to its 2021 all-time high of around $70,000 in a relatively short timeframe – some even suggesting this could occur within the next ten days. This potential “crash risk,” as one analyst termed it, is attributed to various technical and market cycle indicators.
The notion that $70,000 could represent Bitcoin’s “practical bottom,” as suggested by some, highlights the inherent volatility and speculative nature of the cryptocurrency market. Even if Bitcoin is beginning to decouple from traditional equities, it remains susceptible to its own unique set of risks and price swings. Factors such as regulatory developments, network security concerns, and shifts in investor sentiment within the crypto space can still exert significant influence on its price.
Therefore, while the current divergence between Bitcoin and the struggling U.S. stock market offers a compelling narrative and fuels the hopes of long-term Bitcoin holders, it is essential to maintain a balanced perspective. The confluence of factors driving the stock market decline could indeed be creating an environment where Bitcoin’s unique characteristics become more appealing, leading to a sustained period of independent price action. However, the inherent volatility of the cryptocurrency market and the potential for a significant correction remind investors that the journey towards true decoupling is likely to be a complex and potentially bumpy one.
In conclusion, the recent market dynamics present a fascinating juncture for Bitcoin. The initial signs of decoupling from the crumbling U.S. stock market, driven by a confluence of macroeconomic anxieties and the potential for Bitcoin to act as an alternative store of value, are undeniably encouraging for those who believe in its long-term potential. However, the warnings of a potential price correction underscore the inherent risks within the cryptocurrency space. Whether this nascent decoupling marks a definitive shift in Bitcoin's market behavior or proves to be a temporary divergence remains to be seen. Investors would be wise to monitor these trends closely, remaining cognizant of both the potential for independent growth and the ever-present risks associated with this dynamic and evolving asset class. The coming weeks and months will be crucial in determining whether Bitcoin can truly forge its own path in the face of traditional market turmoil.

NasqaqAll our World busy on Tarrif but after many weeks Nasdaq now at Attractive zone .
Plz don't add new sell position here .
Grab this Opportunity

NQ! Short Idea (MXMM, Quarterly Theory)Dear Traders,
today I present you once again my current idea on the Nasdaq. We have swept a High Liquidity Area marked as my lower HTF PDA. Because of that we might see a stronger Pullback as shown on my Chart.
However, I will still keep my eyes open and wait for the 9:30 (UTC-4) Manipulation to look for a Market Maker Sell Model which I will only consider a after a Pullback into my Key Areas and Price Action showing interests of a bearish continuation.
(09:30 Manipulation, Liquidity Sweep + SMT Divergence, Break Of Structure, Any PD-Array)
Praise be to God
-T-

NAS100 Testing Demand Zone – Major Reversal or More Drops? 📊 Market Overview:
The NASDAQ 100 (NAS100) just tested a strong demand zone (18,900 - 18,950) and is showing signs of a potential reversal. Can buyers push the price higher, or will bears take control?
🔹 Key Resistance Levels: 19,568 | 20,160
🔹 Current Price: 18,977
🔹 Key Support Levels: 18,896 (demand zone)
📉 Price Action Breakdown:
1️⃣ Sharp Drop into Demand Zone
Price recently fell from 19,568 after failing to break higher.
Buyers are now defending the 18,900 support zone, which has historically held strong.
2️⃣ Bullish Reversal Setup?
If the price holds above 18,900, we could see a bullish rally toward 19,568.
A breakout above 19,568 may open the way for 20,160+.
3️⃣ Bearish Breakdown Risk
If the price drops below 18,896, expect further downside towards 18,600 - 18,500.
Sellers would regain control, confirming a bearish continuation.
📊 Trading Plan:
📍 Bullish Case:
🔹 Look for bullish confirmation in the 18,900 - 18,950 zone.
🔹 A strong bounce could target 19,568, then 20,160.
📍 Bearish Case:
🔹 If price fails to hold 18,896, a short setup targeting 18,600 - 18,500 is possible.
🔹 Wait for a clean break & retest before shorting.
🔥 Will NAS100 bounce back from this demand zone, or will sellers dominate? Drop your thoughts in the comments! 👇
📊 Like & Follow for more trade insights! 🚀
#NASDAQ100 #TechStocks #Trading #StockMarket #SupplyAndDemand #Forex #PriceAction

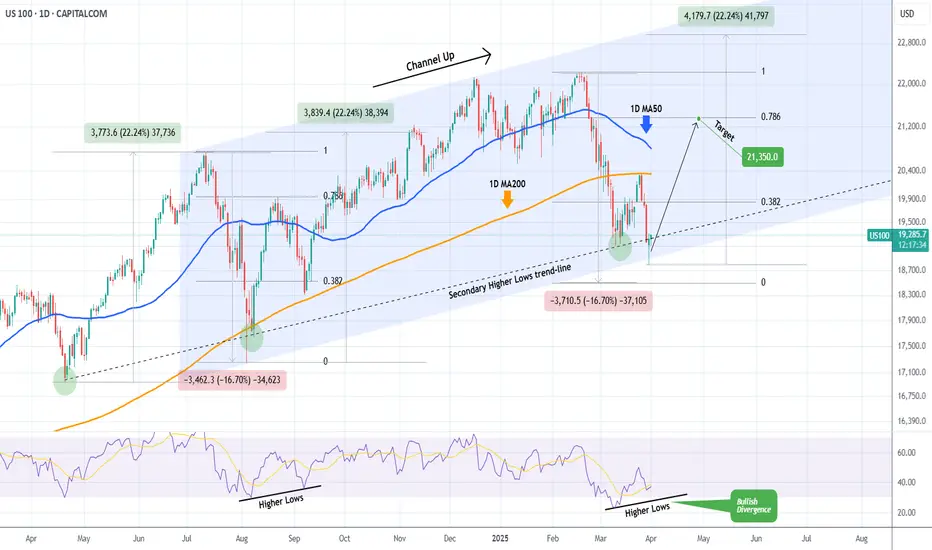
NASDAQ Huge Bullish Divergence points to 21350 inside April.Nasdaq (NDX) has been trading within a Channel Up pattern since the July 11 2024 High. The latest rally that started on March 11 2025 after a brutal 3-week downtrend/ Bearish Leg, got rejected on the 1D MA200 (orange trend-line) as the market digested the disappointing PCE.
Despite this aggressive rejection, the price hit and rebounded yesterday exactly at the bottom of the Channel Up with the previous such contact going back to the August 05 2024 Low. Not to mention that both the March 11 2025 and August 08 2024 Lows were formed exactly on the secondary Higher Lows trend-line.
What's perhaps more critical than any of these though, is that the 1D RSI didn't make a new Low last week and remains above the oversold barrier on a Higher Low trend-line that is a huge technical Bullish Divergence against the price's Lower Lows.
As with the August 22 2024 High, our first short-term Target is on the 0.786 Fibonacci retracement level at 21350.
-------------------------------------------------------------------------------
** Please LIKE 👍, FOLLOW ✅, SHARE 🙌 and COMMENT ✍ if you enjoy this idea! Also share your ideas and charts in the comments section below! This is best way to keep it relevant, support us, keep the content here free and allow the idea to reach as many people as possible. **
-------------------------------------------------------------------------------
💸💸💸💸💸💸
👇 👇 👇 👇 👇 👇
Nasdaq market analysis: 01-APRIL-2025Good morning! Happy New Day! Here's your daily Nasdaq market analysis. Learn, grow, and trade wisely.

NASDAQ Bullish Reversal (Potential Tariff Resolution?) NASDAQ price action went through a massive correction with a drop from the top worth approx. 14%.
However after the passing of the latest FOMC Meeting, we may finally see a direction towards the resolution of widespread tariff based uncertainty across the macro economic landscape.
This presents us with a potential Reversal opportunity if we see the formation of a credible Higher High (given a potential proper break out) on the 4 HR and shorter timeframes.
Trade Plan :
Entry @ 20045
Stop Loss @ 19070
TP 0.9 - 1 @ 20923 - 21020

$NQ CorrectionPrice clearly is going towards Sellside Liquidity.
The standard deviation shows -2 to -2.5 is where price would reverse from and its also aligned with Sellside liquidity.
Idea: Bearish.

NAS - time to go longTeam, i wish i could show you my real account
time to go long on NAS - double bottom - retested
looking at 90-150 points recover
