Heatwave Fuels Breakout as Fundamentals AlignNatural Gas has reclaimed the spotlight with a sharp move above $3.56, breaking through a key resistance level as a heatwave grips large parts of the United States. With above-average temperatures forecast to persist into late July, demand for cooling remains elevated, significantly boosting power consumption across the board.
Supply remains tight despite elevated production levels. Liquefied Natural Gas (LNG) feedgas volumes are rising as export demand holds strong, keeping domestic stockpiles in check. While some temporary relief in demand could arrive next week, the broader outlook remains bullish. Weather models suggest persistent heat, and traders are increasingly positioning for sustained tightness in the balance of supply and demand.
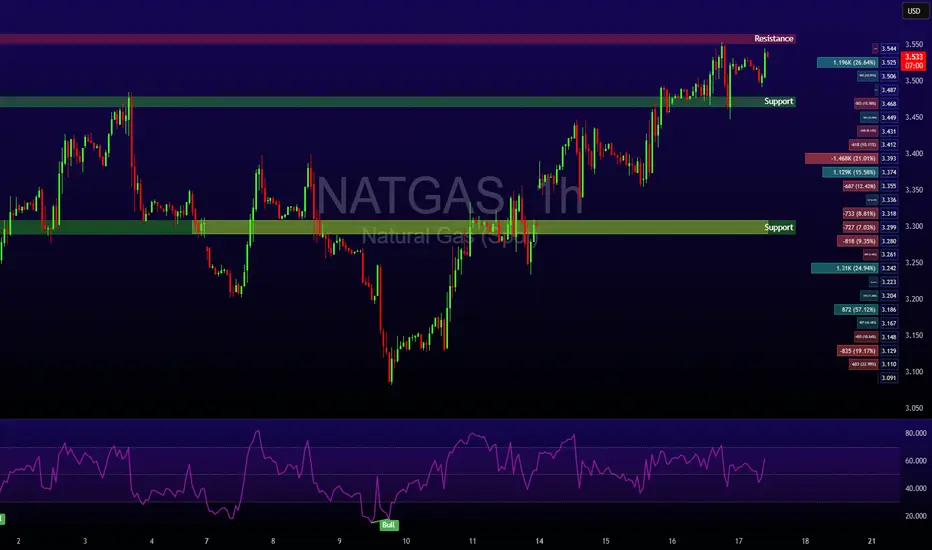
Technical Setup:
• Key level breached: $3.48 (100-day EMA) decisively broken
• Current price zone: Approaching $3.57, the next major pivot
• Momentum: If bulls secure a weekly close above $3.57, the market could enter a longer-term uptrend with $3.65 and $3.80 in sight.
Takeaway: Natural gas traders should monitor weather patterns and storage data closely. Sustained heat could keep the rally intact, but short-term pullbacks may offer entry points for trend-followers.
Natualgas
Natural Gas: At decision point. On 12.17.22 I thought natural gas may soon turn up at around 5.18. (see link below if interested). Clearly that was premature. It stayed in a down trend until now. A clear example why when something is in a up or down trend you best wait for price action (candle stick pattern, trend line break) to support that a turn around is about to occur. Then you have the recent low or high to be a stop point if wrong.
The overall pattern has not changed. But if this EWT count is correct wave 3 should not cross below the high of wave 1. We still have a bullish divergence in the daily RSI. We still have an expanding triangle at wave 3. with the last wave down current having .a=.c. and ending at a possible support/resistance area. So this would seem like a good place to finally so up. BUT wait for price action to support this idea.
Best to you. Have a great week.

Natural Gas Futures (QG1!), H4 Potential for Bearish DropType: Bearish Momentum
Resistance: 627.2
Pivot: 580.7
Support: 424.6
Preferred Case: The H4 price is in a downward trend. The price may drop form the pivot at 580.7, which is in line with the 23.6% fibonacci retracement to the 1st support at 424.6, where the swing and target price of shoulder head pattern is.
Alternative scenario: If the bullish momentum continues, price will move to 627.2, where the 38.2% Fibonacci line is located.
Fundamentals: There are no major news.

Natural Gas Futures ( QG1! ), H4 Potential for Bearish Momentum
Type: Bearish Momentum
Resistance: 573.8
Pivot: 520.5
Support: 424.6
Preferred Case: The H4 price is in a downward trend. The price may drop form the pivot at 520.5, which is in line with the 78.6% fibonacci retracement to the 1st support at 424.6, where the swing and target price of shoulder head pattern is.
Alternative scenario: If the bullish momentum continues, price will move to 573.8, where the 23.6% Fibonacci line is located.
Fundamentals: There are no major news.

$NG1! ~ Natural Gas still pushing...Natural Gas continues to push higher in its 5th leg. Normally commodities have their 5th legs extend as shown. Expect Natural Gas to push to over 11 as shown in chart. Extension would satisfy 1.168 blow off top as expected.
