Natural Gas consolidates nearby support level of 3.0000Natural Gas consolidates nearby support level of 3.0000
U.S. Natural Gas has been declining since mid-June, forming the bullish wedge. Since the end of July 4-h RSI shows us bullish divergence, the price consolidates nearby the 3.0000 support level. The price is expected to rise towards 3.4000 level as a first target with 3.6000 as a final target. Additionally, according to seasonals, since the second half of the august, natural gas prices go bullish due to the beginning of the shoulder season, which may be an extra support factor for the asset.
Naturalgasanalysis

Natural Gas XNG: Trend Reversal or Just a Retracement?Natural Gas (XNG) has been trending bearish 🔻, but we’re now witnessing a bullish market structure shift ⚡— particularly visible on the 4H timeframe ⏱️. At present, price is overextended and pressing into a key resistance zone 📈🧱. I’m watching closely for a retracement back into equilibrium 🔄 within the previous price swing. This could offer a short-term scalp or day trade short setup 🎯.
Should price hold firm at support after the pullback 🛑, we could then begin building a bullish bias and look for long opportunities 📊— depending on how price action develops from there. 🚨 This is not financial advice.

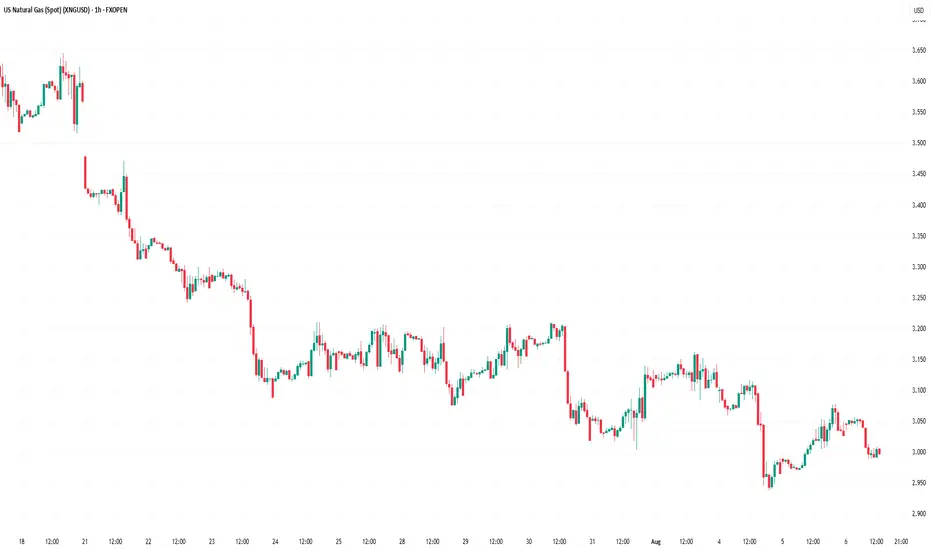
U.S. Hot temperature boosted natural gas prices. For how long?U.S. Hot temperature boosted natural gas prices. For how long?
U.S. natural gas futures rose ~2% August 6 due to near-record LNG export flows and forecasts of hotter-than-normal weather through late August, boosting air conditioning demand and gas use by power plants (over 40% of U.S. electricity). Despite a hot summer, record production has kept gas stockpiles ~6% above normal, with storage likely to grow further.
Technically, price seems to form bullish wedge since mid - August. Price successfully tested the level of 3.0000, still can go on a retest of this level soon once again before some mid-term bullish momentum occurs. Additionally, according to seasonals, since the second half of the august, natural gas prices go bullish due to the beginning of the shoulder season.

Natural Gas Prices Fall to Yearly LowNatural Gas Prices Fall to Yearly Low
Analysing the chart on 22 July, we constructed a descending channel and assumed that natural gas prices would continue to form a bearish market structure of lower highs and lower lows. Since then, the market has declined by almost 10%.
As the XNG/USD chart shows today, natural gas prices are hovering around the psychological level of $3.000/MMBtu. Earlier this week, gas was trading around $2.940/MMBtu — the lowest level of 2025.
According to media reports, the price decline is driven by both high production levels and favourable weather forecasts for August, the hottest month of the year. What might happen next?
Technical Analysis of the XNG/USD Chart
We have updated the descending channel, taking into account the recent fluctuations in natural gas prices.
The chart shows that bearish momentum remains intact — the rise from point B to C appears to be a corrective rebound within the prevailing downward trend, with the following developments:
→ point C formed in the 0.5–0.618 area, which corresponds to classic Fibonacci retracement levels following the A→B impulse;
→ the former support at 0.365 has now become resistance.
Bulls may hope that the current sentiment could shift following tomorrow’s natural gas storage report (scheduled for 17:30 GMT+3). A drop in inventories could potentially trigger a bullish impulse on the XNG/USD chart.
This article represents the opinion of the Companies operating under the FXOpen brand only. It is not to be construed as an offer, solicitation, or recommendation with respect to products and services provided by the Companies operating under the FXOpen brand, nor is it to be considered financial advice.
Natural Gas Price Drops by 7%Natural Gas Price Drops by 7%
As the XNG/USD chart shows today, natural gas is trading around $3.333/MMBtu, although yesterday morning the price was approximately 7% higher.
According to Reuters, the decline in gas prices is driven by:
→ Record-high production levels. LSEG reported that average gas output in the Lower 48 rose to 107.2 billion cubic feet per day so far in July, surpassing the previous monthly record of 106.4 billion cubic feet per day set in June.
→ Favourable weather forecasts. Although the peak of summer heat is still anticipated, forecasts indicate that temperatures over the next two weeks may be lower than previously expected.
As a result, today’s XNG/USD chart appears bearish.
Technical Analysis of the XNG/USD Chart
The chart indicates that since mid-May, natural gas prices have been fluctuating within a descending channel (marked in red), with July’s peak (E) highlighting the upper boundary of the pattern.
A key resistance area is now represented by a bearish gap, formed between:
→ the former support level at $3.525;
→ the $3.470 level – which, as the arrow suggests, is already showing signs of acting as resistance.
Under these conditions, it is reasonable to assume that the price may continue forming a downward market structure A-B-C-D-E, consisting of lower highs and lows, potentially moving towards the channel’s median – which approximately corresponds to July’s low (around the $3.200 level).
This article represents the opinion of the Companies operating under the FXOpen brand only. It is not to be construed as an offer, solicitation, or recommendation with respect to products and services provided by the Companies operating under the FXOpen brand, nor is it to be considered financial advice.

U.S. NATURAL GAS - BEARISH WEDGE WORKED OUT. WHAT'S NEXT?U.S. NATURAL GAS - BEARISH WEDGE WORKED OUT. WHAT'S NEXT?
Today, the market opened 2.66% below its closing price on Friday. The current price has already fallen on 4.8% since the closing on Friday, and it is now above the 3.400 support level. I expect further decline, however, with a possible rebound from the current level and pullback towards the SMA50, with a final target of 3.000.

LNG Bull Market: How Geopolitics and Demand Are Fueling XNG🔥 The Natural Gas market presents a compelling risk/reward opportunity with strong fundamental support from ⚖️ supply/demand imbalances and 🌍 geopolitical factors. The technical chart shows a healthy 📊 consolidation after the explosive 🚀 February–March rally, with the potential for another leg higher.
📌 Key Investment Thesis:
• 📈 Structural bull market driven by demand growth outpacing supply
• 🌐 Geopolitical premium supporting price floor
• 🌦️ Weather-driven volatility creating trading opportunities
• 🛳️ LNG export growth providing long-term demand foundation
🧭 Recommended Approach:
• 💰 Accumulate positions on weakness near $3.00–$3.40 levels
• 🎯 Target initial resistance at $4.00, with extended targets at $5.00+
• ⚠️ Maintain disciplined risk management with stops below $2.60
• 👀 Monitor weather patterns and geopolitical developments closely
📊 Risk Rating: MODERATE TO HIGH (due to volatility)
💵 Return Potential: HIGH (⏫ 50–100% upside potential over 12–18 months)
❗ This analysis is for informational purposes only and should not be considered as financial advice.
⚠️ Natural gas trading involves significant risk and volatility.
📚 Always consult with a qualified financial advisor and conduct your own research before making investment decisions.

NATURALGAS at Best Support Zone This is the 4 hour chart of Natural Gas.
Natural Gas having a good Support Zone at 290-295 range.
Natural Gas has shown a reversal from its support zone.
Natural Gas is trading within a parallel channel support at 293 level Natural Gas.
Thank You !!

Natural Gas Prices on the RiseNatural Gas Prices on the Rise
As shown on the XNG/USD chart today, natural gas prices are trading around $3.960 per MMBtu — the highest level in over a month. This week’s series of bullish candles confirms strong demand.
Natural gas is becoming more expensive due to concerns over the military conflict between Iran and Israel. According to media reports:
→ Israel has attacked Iran’s South Pars gas field, and Donald Trump has called for the evacuation of Tehran.
→ Market participants fear that a blockade of the Strait of Hormuz could disrupt oil and natural gas supply chains.
In addition, forecasts of extreme heat in the US and increased demand for gas-powered air conditioning are also pushing prices higher.
Technical Analysis of the XNG/USD Chart
The chart shows that since mid-May, natural gas price movements have formed a narrowing triangle, suggesting a temporary balance between supply and demand.
However, the triangle has been broken to the upside — a sign of demand strength — with the price:
→ breaking through resistance at $3.800 per MMBtu;
→ forming the outlines of an ascending channel (shown in blue).
The following factors could act as resistance to the current upward move in natural gas prices:
→ the upper boundary of the channel;
→ the psychological level of $4.000 per MMBtu, near the May peak.
However, given that the hottest months of summer lie ahead and the situation in the Middle East remains highly volatile, it is reasonable to assume that the upward trend may continue.
This article represents the opinion of the Companies operating under the FXOpen brand only. It is not to be construed as an offer, solicitation, or recommendation with respect to products and services provided by the Companies operating under the FXOpen brand, nor is it to be considered financial advice.

Naturalgas long tradeNaturalgas is resisting downside movement as witnessed on chart.
If you see the downward movement of Naturalgas, it is with relatively high volume but it is not coming down as expected from sellers and bouncing back up again as seen 3 times.
Now naturalgas has reached short term resistance zone of 307-310 from which it took support on 9th June, broke it on 10th June, took resistance on 11th and 12th June.
This might be a Change of Character zone for Naturalgas.
And now that Naturalgas is resisting downward movement, we might see breakout of this zone and probable upside movement.
Lastly it is also forming Ascending triangle which is still premature but just for reader's consideration.
Let's watch it on coming days.

NATGAS is Bearish: A Consolidation Phase Could be AheadFenzoFx—NATGAS dipped below $3.43 support on April 14, trading at approximately $3.22. The Stochastic Oscillator exited oversold territory, signaling possible consolidation before a downtrend resumes.
Bearish trends persist below $3.66, with potential price dips toward $3.08.
>>> No Deposit Bonus
>>> %100 Deposit Bonus
>>> Forex Analysis Contest
All at F enzo F x Decentralized Forex Broker

Natural Gas Naturally coming down to $2.5 insane drop if soNot only is the world markets showing downside to come, but so are many different commodities.
With so many investors flocking out of natural gas, stocks and even crypto they are most likely trying to find the safer havens to invest in these times.
Right now it looks like Natural Gas wants to come down a whole lot more due to.
🔻 Demand's lower 'cause winter's over and heating needs dropped.
📦 Storage levels are high, so no one's rushing to buy.
💨 Production's still strong, especially in the U.S. — too much supply!
🇨🇳 China's using less energy, so global demand dipped.
💸 Traders taking profits after recent spikes — classic pullback move
And the Technicals also confirm it.
Inverse Cup and Handle
Downtrend Strong
Price>20
Target $2.593
Disclosure: I am part of Trade Nation's Influencer program and receive a monthly fee for using their TradingView charts in my analysis.

"XNG/USD Natural Gas" Energy Market Heist Plan (Scalping/Day)🌟Hi! Hola! Ola! Bonjour! Hallo! Marhaba!🌟
Dear Money Makers & Robbers, 🤑 💰💸✈️
Based on 🔥Thief Trading style technical and fundamental analysis🔥, here is our master plan to heist the "XNG/USD Natural Gas" Energy Market. Please adhere to the strategy I've outlined in the chart, which emphasizes long entry. Our aim is to escape near the high-risk ATR Zone. Risky level, overbought market, consolidation, trend reversal, trap at the level where traders and bearish robbers are stronger. 🏆💸"Take profit and treat yourself, traders. You deserve it!💪🏆🎉
Entry 📈 : "The vault is wide open! Swipe the Bearish loot at any price - the heist is on!
however I advise to Place sell limit orders within a 15 or 30 minute timeframe most nearest or swing, low or high level for Pullback Entries.
Stop Loss 🛑:
📌Thief SL placed at the nearest/swing High or Low level Using the 2h timeframe (3.800) Day/Scalping trade basis.
📌SL is based on your risk of the trade, lot size and how many multiple orders you have to take.
🏴☠️Target 🎯: 3.200
🧲Scalpers, take note 👀 : only scalp on the Long side. If you have a lot of money, you can go straight away; if not, you can join swing traders and carry out the robbery plan. Use trailing SL to safeguard your money 💰.
⛽💨"XNG/USD Natural Gas" Energy Market Heist Plan (Scalping/Day) is currently experiencing a bullishness,., driven by several key factors. 👇👇👇
📰🗞️Get & Read the Fundamental, Macro Economics, COT Report, Inventory and Storage Analysis, Seasonal Factors, Sentimental Outlook, Intermarket Analysis, Future trend targets & Overall Outlook Score... go ahead to check 👉👉👉🔗🔗
⚠️Trading Alert : News Releases and Position Management 📰 🗞️ 🚫🚏
As a reminder, news releases can have a significant impact on market prices and volatility. To minimize potential losses and protect your running positions,
we recommend the following:
Avoid taking new trades during news releases
Use trailing stop-loss orders to protect your running positions and lock in profits
💖Supporting our robbery plan 💥Hit the Boost Button💥 will enable us to effortlessly make and steal money 💰💵. Boost the strength of our robbery team. Every day in this market make money with ease by using the Thief Trading Style.🏆💪🤝❤️🎉🚀
I'll see you soon with another heist plan, so stay tuned 🤑🐱👤🤗🤩

NATGAS Found Support at $3.43: Next Target Could be $3.084FenzoFx—NATGAS failed to stabilize below the $3.43 support, resulted in the prices to bounce. As of this writing, Natural Gas trades slighlty above the support.
From a technical perspective. The recent bounce in the price couldn't form a new higher high. Therefore, it is expected for the prices to fall. But, bears must close and stabilize below the $3.43 support for the downtrend to resume.
>>> Win $160.0 weekly by participating FenzoFx Forex Contest for free.

NATGAS is Bearish amid Oversold SignalsFenzoFx—NATGAS is in a downtrend, broke below the $3.66 support. The primary trend is bearish, but a consolidation phase is expected.
In this scenario, Natural Gas may test the 50.0% Fibonacci retracement level at $3.866 before the downtrend resumes. Watch this level for bearish signals, like candlestick patterns.
>>> Trade NATGAS without swap at FenzoFx Decentralized Broker

XNG/USD Analysis: Natural Gas Price Drops to March LowXNG/USD Analysis: Natural Gas Price Drops to March Low
On 27 January, our analysis of the natural gas chart highlighted the formation of an ascending channel. Later, on 10 March, we noted that the sharp price increase had created technical conditions for a correction.
Since then, as indicated by the arrow on the XNG/USD chart, natural gas prices have declined by approximately 19%.
Why Is the Price of Natural Gas Falling?
- Unseasonably Warm Weather: Atmospheric G2 reported on Wednesday that forecasts now indicate significant warming across the eastern half of the U.S. from 31 March to 4 April. This could reduce demand for natural gas used in heating.
- Rising Inventories: According to the EIA’s forecast, weekly natural gas storage levels are expected to increase by +33 billion cubic feet over the past week.
Technical Analysis of XNG/USD Chart
Looking at the broader trend since the start of the year, the ascending channel (marked in blue) remains relevant. However, bears have pushed the price below its median line, shifting movement into a short-term downward channel (marked in red).
Currently, natural gas is trading near the $3.780/MMBtu level, a key price point that has previously acted as both support and resistance. Whether a bearish breakdown or a bullish rebound occurs largely depends on the upcoming EIA report, scheduled for release at 17:30 GMT+3.
This article represents the opinion of the Companies operating under the FXOpen brand only. It is not to be construed as an offer, solicitation, or recommendation with respect to products and services provided by the Companies operating under the FXOpen brand, nor is it to be considered financial advice.

#NATURAL GAS (Supply Zone)In technical analysis, a Supply Zone is an area on a price chart where selling pressure is expected to be strong, causing the price to potentially reverse or stall. This concept is often used in trading strategies to identify potential areas where price might decline.

Natural Gas Price Hits Highest Level Since January 2023Natural Gas Price Hits Highest Level Since January 2023
The XNG/USD chart today shows that natural gas prices have surpassed the December 2024 peak, breaking through the key psychological level of $4.000/MMBtu. Since early February, prices have surged by over 20%.
Why Is Natural Gas Price Rising?
According to The Wall Street Journal, the bullish sentiment is driven by:
→ Weather models confirming forecasts of a significant cold spell.
→ LNG exports remaining at record highs.
Additionally, US gas exports may increase further after President Trump lifted the pause imposed by the Biden administration on new LNG export projects. Bloomberg reports that Trump’s administration is close to approving its first LNG export project.
Technical Analysis of XNG/USD
The price movements are forming an upward channel (marked in blue) on the chart:
→ Prices are currently near the upper boundary of this channel.
→ The RSI indicator is in the overbought zone.
→ The price briefly exceeded the $4.000/MMBtu psychological level.
→ Buyers may look to secure profits after the recent sharp gains.
Given these factors, traders may anticipate a potential pullback, which—if it occurs—could bring natural gas prices back towards the channel’s median level.
Trade on TradingView with FXOpen. Consider opening an account and access over 700 markets with tight spreads from 0.0 pips and low commissions from $1.50 per lot.
This article represents the opinion of the Companies operating under the FXOpen brand only. It is not to be construed as an offer, solicitation, or recommendation with respect to products and services provided by the Companies operating under the FXOpen brand, nor is it to be considered financial advice.

Natural Gas Short: Testing the $4 Barrier – Opportunity Knocks!Natural Gas (XNG/USD) has spiked to revisit the $4 price zone, activating my short trade. This marks the second time in two years that the price has reached this significant resistance area. The $4 level is pivotal, serving as a key psychological barrier and a historic zone of strong price action. With the position now live, I am leveraging the resistance for a retracement opportunity.
Fundamentals:
• Weather and Seasonal Demand: Short-term spikes in demand are driven by cold weather in the U.S., but with futures traders starting to focus on spring, we may see waning bullish momentum in the coming weeks.
• Russian Gas Supply Constraints: Limited Russian gas flows to the EU continue to add uncertainty to the market, but the current rally seems to be pricing in short-term factors rather than long-term structural changes.
• Historical Levels: The $4 spot price has attracted significant attention as a resistance zone, with $3.40 acting as a key support in recent months. The bounce from this level earlier this year highlights its importance.
• Market Behavior: Futures traders’ sentiment and seasonality are critical drivers. As winter progresses, reduced speculative demand may favor a bearish pullback.
Technicals:
• Entry: $4.00 (Resistance Zone)
• Target: $2.60 - 2.70
• Partials: From $3,19
• Stop Loss: $4.40 (Above Recent Highs)
• Timeframe: 12H
This short trade aligns with technical, fundamental, and seasonal narratives. As the price has shown rejection at this zone, I will actively monitor for a breakdown toward the $3.40 level while managing risk prudently. Stay disciplined, follow your trading plan, and remember to pay yourself as the market unfolds.
Note: Please remember to adjust this trade idea according to your individual trading conditions, including position size, broker-specific price variations, and any relevant external factors. Every trader’s situation is unique, so it’s crucial to tailor your approach to your own risk tolerance and market environment.

XNG/USD "Natural Gas" Energy Market Bearish Heist Plan🌟Hi! Hola! Ola! Bonjour! Hallo!🌟
Dear Money Makers & Robbers, 🤑 💰
Based on 🔥Thief Trading style technical and fundamental analysis🔥, here is our master plan to heist the XNG/USD "Natural Gas" Energy Metal market. Please adhere to the strategy I've outlined in the chart, which emphasizes short entry. Our aim is the high-risk Green Zone. Risky level, oversold market, consolidation, trend reversal, trap at the level where traders and bullish robbers are stronger. 👀 Be wealthy and safe trade.💪🏆🎉
Entry 📉 : Traders & Thieves with New Entry A Bear trade can be initiated at any price level.
however I advise placing sell limit orders within a 15 or 30 minute timeframe. Entry from the most recent or closest high level should be in retest.
Stop Loss 🛑: Using the 4h period, the recent / nearest high level
Goal 🎯: 2.950 (or) Before escape in the market
Scalpers, take note : only scalp on the Short side. If you have a lot of money, you can go straight away; if not, you can join swing traders and carry out the robbery plan. Use trailing SL to safeguard your money 💰.
📰🗞️Fundamental, Macro, Sentimental Outlook:
The XNG/USD "Natural Gas" Energy market is expected to move in a bearish direction, driven by several key factors.
Based on current market conditions, the XNG/USD Natural Gas market is expected to move in a Bearish direction.
🔆Fundamental Factors:
-Supply and Demand Balance: The natural gas market is expected to move into a supply surplus, driven by increasing production and decreasing demand.
-US Natural Gas Production: US natural gas production is expected to increase, putting downward pressure on prices.
-LNG Export Capacity: Increasing LNG export capacity from the US is expected to put downward pressure on natural gas prices.
🔆Macroeconomic Factors:
-Mild Winter Weather: Warmer-than-expected winter weather in the US is expected to decrease demand for natural gas, putting downward pressure on prices.
-Global Economic Slowdown: Slowing global economic growth, particularly in China, is expected to decrease demand for natural gas.
-US Dollar Strength: A stronger US dollar is expected to put downward pressure on natural gas prices, making them more expensive in international markets.
🔆Trader/Market Sentimental Analysis:
-Trader Sentiment: The CoT report shows that speculative traders are net short natural gas, indicating a bearish sentiment.
-Market Sentiment: The market sentiment is bearish, with many analysts expecting natural gas prices to decline due to the supply and demand balance.
-Technical Analysis: The technical analysis shows that natural gas is in a downtrend, with a bearish breakdown below the $3.00 level.
🔆Sentimental Outlook:
Bearish Sentiment: 65%
Bullish Sentiment: 20%
Neutral Sentiment: 15%
🔆Overall, the bearish outlook is driven by a combination of macroeconomic and fundamental factors, with a 60% chance of a bearish move, 20% chance of a bullish move, and 20% chance of a neutral move.
⚠️Trading Alert : News Releases and Position Management 📰 🗞️ 🚫🚏
As a reminder, news releases can have a significant impact on market prices and volatility. To minimize potential losses and protect your running positions,
we recommend the following:
Avoid taking new trades during news releases
Use trailing stop-loss orders to protect your running positions and lock in profits
🚨Please note that this is a general analysis and not personalized investment advice. It's essential to consider your own risk tolerance and market analysis before making any investment decisions.
🚨Keep in mind that these factors can change rapidly, and it's essential to stay up-to-date with market developments and adjust your analysis accordingly.
💖Supporting our robbery plan will enable us to effortlessly make and steal money 💰💵 Tell your friends, Colleagues and family to follow, like, and share. Boost the strength of our robbery team. Every day in this market make money with ease by using the Thief Trading Style.🏆💪🤝❤️🎉🚀
I'll see you soon with another heist plan, so stay tuned 🫂

"NATURAL GAS" Commodities Market Bullish Heist PlanHello!! My Dear Robbers / Money Makers & Losers, 🤑 💰
This is our master plan to Heist "NATURAL GAS" Commodities Market based on Thief Trading style Technical Analysis.. kindly please follow the plan I have mentioned in the chart focus on Long entry. Our target is Red Zone that is High risk Dangerous level, market is overbought / Consolidation / Trend Reversal / Trap at the level Bearish Robbers / Traders gain the strength. Be safe and be careful and Be rich.
Entry 📈 : Can be taken Anywhere, What I suggest you to Place Buy Limit Orders in 15mins Timeframe Recent / Nearest Low Point take entry should be in pullback.
Stop Loss 🛑 : Recent Swing Low using 2H timeframe
Target 🎯 : 3500.0
Attention for Scalpers : Focus to scalp only on Long side, If you've got a lot of money you can get out right away otherwise you can join with a swing trade robbers and continue the heist plan, Use Trailing SL to protect our money 💰.
Warning : Fundamental Analysis news 📰 🗞️ comes against our robbery plan. our plan will be ruined smash the Stop Loss 🚫🚏. Don't Enter the market at the news update.
Loot and escape on the target 🎯 Swing Traders Plz Book the partial sum of money and wait for next breakout of dynamic level / Order block, Once it is cleared we can continue our heist plan to next new target.
💖Support, Like and follow our Robbery plan we can easily make money & take money 💰💵 Follow, Like & Share with your friends and Lovers. Make our Robbery Team Very Strong Join Ur hands with US. Loot Everything in this market everyday make money easily with Thief Trading Style.
Stay tuned with me and see you again with another Heist Plan..... 🫂

"NATURAL GAS" Commodities Market Bullish Heist PlanHola! Ola! My Dear Robbers / Money Makers & Losers, 🤑 💰
This is our master plan to Heist "NATURAL GAS" Commodities Market based on Thief Trading style Technical Analysis.. kindly please follow the plan I have mentioned in the chart focus on Long entry. Our target is Red Zone that is High risk Dangerous level, market is overbought / Consolidation / Trend Reversal / Trap at the level Bearish Robbers / Traders gain the strength. Be safe and be careful and Be rich.
Entry 📈 : Can be taken Anywhere, What I suggest you to Place Buy Limit Orders in 15mins Timeframe Recent / Nearest Low Point take entry should be in pullback.
Stop Loss 🛑 : Recent Swing Low using 2H timeframe
Target 🎯 : 3.500
Attention for Scalpers : Focus to scalp only on Long side, If you've got a lot of money you can get out right away otherwise you can join with a swing trade robbers and continue the heist plan, Use Trailing SL to protect our money 💰.
Warning : Fundamental Analysis news 📰 🗞️ comes against our robbery plan. our plan will be ruined smash the Stop Loss 🚫🚏. Don't Enter the market at the news update.
Loot and escape on the target 🎯 Swing Traders Plz Book the partial sum of money and wait for next breakout of dynamic level / Order block, Once it is cleared we can continue our heist plan to next new target.
💖Support our Robbery plan we can easily make money & take money 💰💵 Follow, Like & Share with your friends and Lovers. Make our Robbery Team Very Strong Join Ur hands with US. Loot Everything in this market everyday make money easily with Thief Trading Style.
Stay tuned with me and see you again with another Heist Plan..... 🫂

Turbulent Times Ahead for Natural Gas MarketNatural gas prices began the week with a gap-up, driven by forecasts of colder weather increasing demand, but have since faced strong selling pressure, making traders cautious.
◉ Technical Analysis
● A bullish turnaround seems imminent for Natural Gas prices, highlighted by the appearance of an Inverted Head & Shoulder pattern on the daily chart.
● After breaking out, the price momentarily reached the $3.290 resistance level before retreating and revisiting the breakout point.
● The price is now attempting to breach the resistance zone again, with expectations of exceeding the level soon.
● However, a drop below $2.800 could trigger a further correction.
◉ Overall Outlook
Natural gas prices are poised for a volatile week as traders weigh colder weather expectations against bearish technical signals. Thursday's inventory data will be crucial in determining the next price move.
