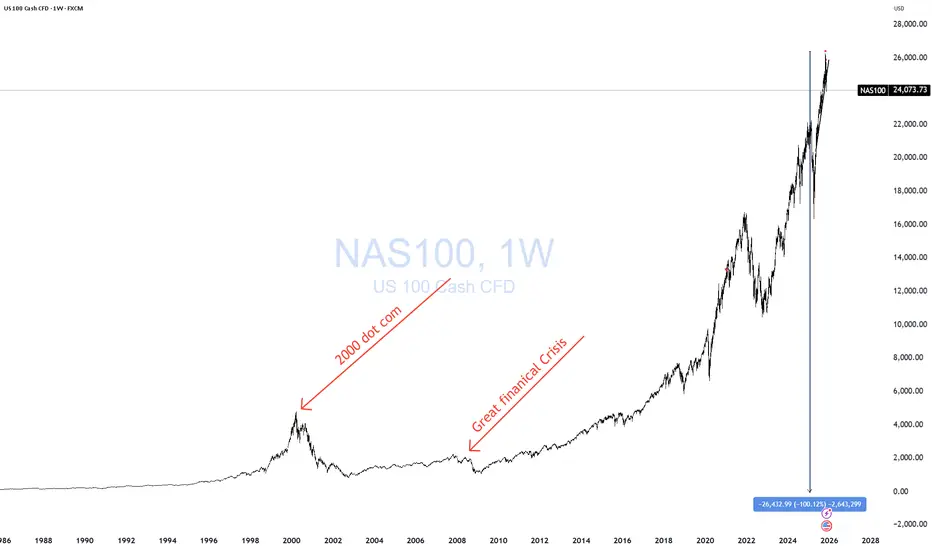
NASDAQ Time to correct hard until it reaches this level again.Exactly 6 months ago (June 20, see chart below), we posted the following analysis on Nasdaq (NDX), which helped us ride the rally following the April 07 2025 market low:
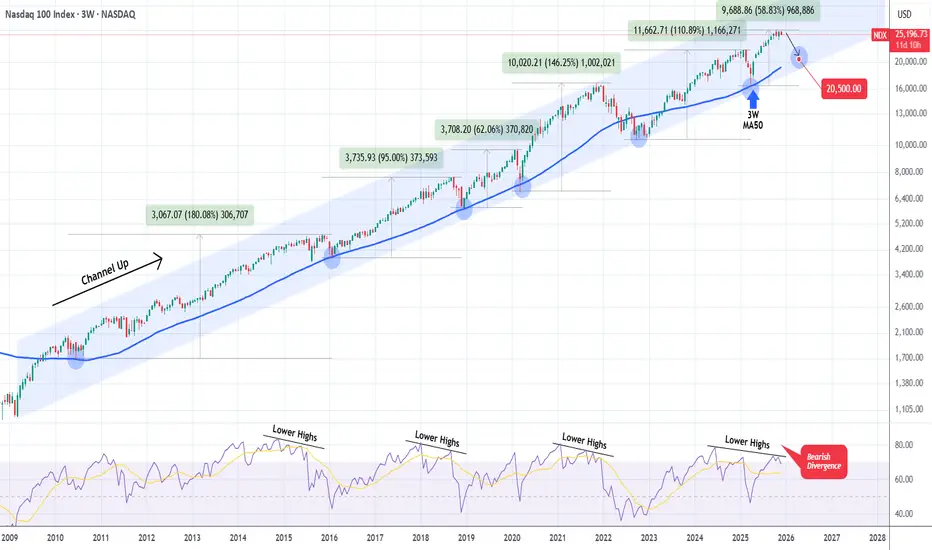
The reasoning behind this was that Nasdaq's low was on its 3W MA50 (blue trend-line), a key Support level which since 2009 and the start of the market's dominant multi-year Channel Up following the 2008 Housing Crisis, has offered 5 perfect long-term buy entries upon contact, only breaking once during the 2022 Inflation Crisis.
Now that the 3W RSI is displaying a Lower Highs Bearish Divergence (against the price's Higher Highs) that has been formed on another 3 prior Cycle Tops, we expect the market to start reversing soon for another cyclical correction. Technically another Bearish Leg for the dominant Channel Up.
Naturally, we expect it to reach at least the 3W MA50 again. Based on its trajectory, it is possible for contact to be made around 20500. Keep in mind again that absolute pricing isn't the important thing here, timing is. The most optimal time to buy based on this high accuracy model, is upon contact with the 3W MA50, regardless of the price it is at, so don't get fixed on 20500, but it is a fair projection based on the trend.
---
** Please LIKE 👍, FOLLOW ✅, SHARE 🙌 and COMMENT ✍ if you enjoy this idea! Also share your ideas and charts in the comments section below! This is best way to keep it relevant, support us, keep the content here free and allow the idea to reach as many people as possible. **
---
💸💸💸💸💸💸
👇 👇 👇 👇 👇 👇
NASDAQ 100 CFD
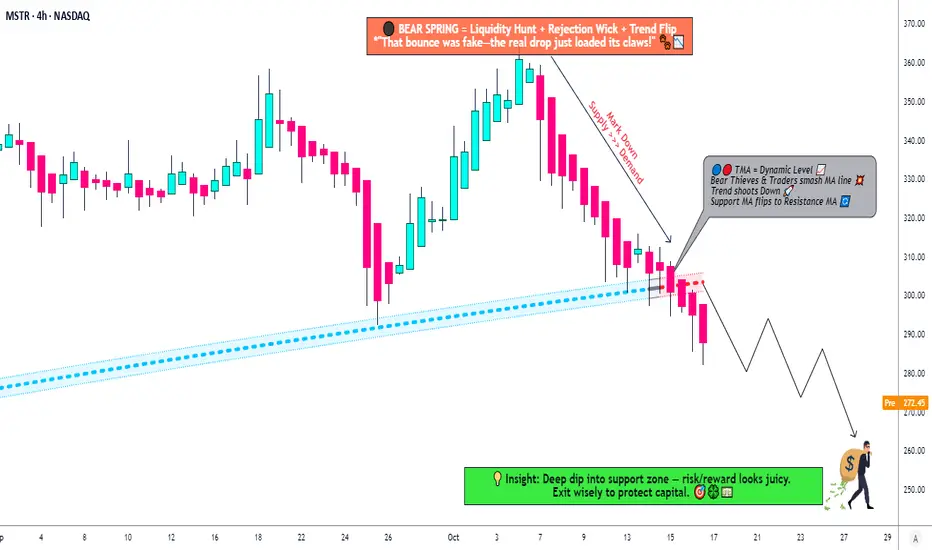
MSTR: Time to Short? Death Cross + Triangle Break Analysis🐻 MSTR "STRATEGY INC." - The Bear's Playground | Thief's Multi-Layer Setup 💰
📊 MARKET SNAPSHOT
Asset: NASDAQ:MSTR (Strategy Inc. - formerly MicroStrategy)
Current Price: ~$291.23 (Oct 17, 2025)
Setup Type: Swing/Day Trade - Bearish Confirmation
Strategy Style: "Thief Method" - Layered Limit Orders 🎯
🔍 THE SETUP - Why This Bearish Play Makes Sense
Ladies and Gentlemen, welcome to the Thief's playbook! 👋 MSTR just gave us a beautiful bearish signal with a triangular moving average breakdown. Here's what the charts are screaming:
🎯 The "Thief" Entry Strategy - Layered Limit Orders
This isn't your typical "buy now" play. We're sneaking in like a thief in the night with MULTIPLE SELL LIMIT LAYERS:
Entry Zones (Layer Your Shorts):
Layer 1: $310 (First resistance retest)
Layer 2: $300 (Psychological level)
Layer 3: $290 (Current consolidation zone)
💡 Pro Tip: Scale into your position! You can add MORE layers based on your risk tolerance (e.g., $305, $295, $285). The "Thief Method" is all about spreading your entries to catch the perfect price zones.
🛑 RISK MANAGEMENT - The Thief's Insurance Policy
Stop Loss: $320 🚨
(This is the Thief's emergency exit - if price breaks above this, the bears lost control)
⚠️ IMPORTANT NOTE:
Dear Thief OG's (Original Gangsters), this is MY stop loss level based on MY analysis. You should set YOUR OWN stop loss based on YOUR risk tolerance. Don't copy blindly - manage YOUR money, take YOUR profits (or losses) at YOUR own risk! This is YOUR trade, not mine. 💯
🎯 PROFIT TARGET - Where the Money's Hiding
Primary Target: $250 🎉
Why $250?
Strong historical support level
Oversold bounce zone (RSI typically rebounds here)
TRAP ALERT: Institutional buyers often accumulate at this level - be ready to ESCAPE with your profits before the bulls wake up! 🐂💤
⚠️ TAKE PROFIT NOTE:
Dear Thief OG's, $250 is MY target based on MY analysis. You can (and should) set YOUR own targets. If you're in profit at $270, $260, or even $280 - TAKE THE MONEY AND RUN! 💰 No shame in banking profits early. Remember: pigs get fat, hogs get slaughtered. This is YOUR trade, YOUR risk, YOUR decision!
🔗 RELATED ASSETS TO WATCH - The Correlation Game
MSTR doesn't trade in a vacuum! Keep your eyes on these correlated assets:
📈 Primary Correlation:
CRYPTOCAP:BTC (Bitcoin): ~$108,625 (Oct 17, 2025) - MSTR holds 640,000+ BTC (3%+ of total supply!)
Correlation Strength: 🔥🔥🔥🔥🔥 ULTRA HIGH
Why It Matters: MSTR is essentially a leveraged Bitcoin play. When BTC sneezes, MSTR catches a cold. Bitcoin's current bearish pressure directly impacts MSTR's valuation.
🔄 Secondary Watchlist:
NASDAQ:COIN (Coinbase): Crypto exchange - sentiment indicator
NASDAQ:RIOT (Riot Platforms): Bitcoin mining stock
NASDAQ:MARA (Marathon Digital): Another BTC-related equity
NASDAQ:CLSK (CleanSpark): Bitcoin mining operations
Key Point: If Bitcoin breaks below $105K support, expect MSTR to accelerate downward. Conversely, if BTC rallies back above $115K, this bearish setup could invalidate. Watch Bitcoin like a hawk! 🦅
📊 THE BIGGER PICTURE - Why MSTR Is Vulnerable Right Now
Bitcoin Pressure: BTC down -2.19% today, testing critical support levels
Institutional Caution: Recent S&P 500 rejection (not included in index) = credibility questions
Valuation Concerns: Trading at significant premium to NAV (Net Asset Value)
Technical Breakdown: Multiple MA crosses + trend reversal signals
Macro Headwinds: Risk-off sentiment in crypto markets (3-day consecutive decline)
🎓 THE THIEF'S WISDOM - Final Thoughts
This setup combines:
✅ Technical confirmation (MA breakout)
✅ Layered entry strategy (better average price)
✅ Clear risk management (defined stop loss)
✅ Realistic profit targets (strong support zone)
✅ Correlated asset monitoring (BTC relationship)
Remember: The market doesn't care about your opinion. Respect the charts, manage your risk, and don't get greedy. The "Thief Method" is about stealing profits intelligently, not gambling recklessly! 🎰❌
💬 TRADE SMART, NOT HARD!
This is a BEARISH SETUP with defined entries, exits, and risk parameters. Whether you're swing trading or day trading, the key is DISCIPLINE. Stick to your plan, don't chase, and protect your capital.
Questions? Thoughts? Drop them below! 👇
Let's build a community of smart traders who help each other win! 🤝
✨ If you find value in my analysis, a 👍 and 🚀 boost is much appreciated — it helps me share more setups with the community!
#MSTR #Bitcoin #BTC #TradingView #SwingTrading #DayTrading #BearishSetup #ShortSetup #CryptoStocks #TechnicalAnalysis #MovingAverages #LayeredEntry #RiskManagement #ProfitTarget #StrategyInc #MicroStrategy #ThiefMethod #TradingStrategy #StockMarket #NASDAQ
OPEN: Time to Accumulate? Layer Entry Method Explained🎯 OPEN: The Heist is ON! 🏠💰 Strategic Swing Trade Setup
📊 Asset Overview
Ticker: OPEN (Opendoor Technologies Inc.)
Exchange: NASDAQ
Trade Type: Swing Trade
Bias: 🐂 BULLISH
🎭 The Master Plan: "Operation Real Estate Robbery"
Listen up, fellow wealth redistributors! 👋 Opendoor's chart is screaming opportunity louder than a house alarm at 3 AM. We're setting up a classic layered accumulation strategy (aka "The Thief's Multi-Pocket Approach") to maximize our position while managing risk like professionals.
🚪 Entry Strategy: The Layered Infiltration Method
Primary Approach: Multiple Limit Orders (Ladder Strategy)
Instead of going all-in at one price (rookie move 😅), we're spreading our capital across strategic levels:
Recommended Entry Layers:
🎯 Layer 1: $6.50
🎯 Layer 2: $7.00
🎯 Layer 3: $7.50
🎯 Layer 4: $8.00
Flexibility Note: You can adjust the number of layers and position sizing based on your capital and risk appetite. Some traders prefer tighter layers ($0.25 increments), others go wider. Make it yours! 💪
Alternative: If you prefer simplicity, current market price entry works too, but layering gives you better average cost basis on dips.
🛡️ Risk Management: The Escape Hatch
Stop Loss: $6.00
⚠️ Important Disclaimer: This SL level is based on technical structure, but YOU are the captain of your own ship. Adjust based on:
Your risk tolerance
Account size
Market volatility
Personal trading rules
Risk Management Tip: Never risk more than 1-2% of your total capital on a single trade. Set your position size accordingly!
🎯 Target: The Grand Exit
Primary Target: $10.00
At this level, we're expecting:
🚨 Strong resistance zone
📈 Potential overbought conditions
Possible bull trap area
💰 Excellent risk-reward ratio
Scaling Out Strategy (Advanced Move):
Consider taking 30-50% profits at $9.00-$9.50
Trail stop-loss on remaining position
Lock in gains progressively
Remember: Nobody went broke taking profits! 💵 If the market gives you money, take it. Don't get greedy waiting for the "perfect" exit.
🔗 Related Assets to Watch
Keep these correlated symbols on your radar for confluence:
📍 $Z (Zillow Group) - Direct competitor in real estate tech, strong correlation with OPEN's price action
📍 BLACKBULL:RDFN (Redfin Corporation) - Another proptech player, moves in sympathy with sector sentiment
📍 NASDAQ:EXPI (eXp World Holdings) - Real estate brokerage, broader sector health indicator
📍 AMEX:IYR (iShares U.S. Real Estate ETF) - Overall real estate sector strength/weakness gauge
📍 AMEX:XHB (SPDR S&P Homebuilders ETF) - Housing market sentiment indicator
Correlation Logic: When real estate tech and housing sectors show strength, OPEN typically benefits. Conversely, sector weakness can drag OPEN down regardless of individual fundamentals. Watch for divergences—they often signal important reversals! 🔄
📈 Technical Synopsis
This setup combines:
✅ Strategic layered entries for optimal positioning
✅ Defined risk with clear stop-loss
✅ Realistic profit target with strong R:R ratio
✅ Sector correlation awareness
✅ Flexible execution for different trading styles
The swing trade timeframe gives this setup room to breathe and develop, perfect for traders who don't want to be glued to charts all day! ⏰
⚡ The Bottom Line
This isn't financial advice—it's a strategic roadmap presented with personality! The "thief style" approach is all about:
🎯 Strategic positioning
🛡️ Risk management
💰 Profit-taking discipline
😎 Having fun while trading
Trade smart. Trade safe. Trade YOUR plan.
✨ If you find value in my analysis, a 👍 and 🚀 boost is much appreciated — it helps me share more setups with the community!
#OPEN #OpendoorTechnologies #SwingTrade #NASDAQ #StockMarket #TechnicalAnalysis #TradingStrategy #RealEstateTech #PropTech #BullishSetup #LayeredEntry #RiskManagement #TradingView #StockTrading #MarketAnalysis #TradingIdeas #SwingTrading #DayTrading

Nasdaq - The final blow-off top!⚰️Nasdaq ( TVC:NDQ ) can rally a final +25%:
🔎Analysis summary:
Just this month, we witnessed quite some volatility on the Nasdaq with a correction of about -10%. However, bulls immediately stepped in and clearly pushed price higher. Since there is still bullish pressure, a final blow-off top rally in the near future is quite likely.
📝Levels to watch:
$25,000 and $30,000
SwingTraderPhil
SwingTrading.Simplified. | Investing.Simplified. | #LONGTERMVISION

NAS100 Retest of POC: Bullish Break or Deeper Correction?I'm keeping a close eye on NASDAQ (NAS100) right now 📉📈. We’re seeing a deep pullback—a strong retracement that makes everyone ask the classic question:
Does this want to keep pushing lower and give us a bearish weekly candle, or is it gearing up to hold a level and rally back with the higher-timeframe trend?
For me, I’m a trend-continuation trader. Even if the weekly candle prints bearish, I’m not interested in selling into higher-timeframe strength. I’d rather stay patient and stick with the bigger trend direction 🧭.
Here’s the key level I’m watching:
If NAS100 can break back above the Volume Profile POC (Point of Control) — which is basically the high-value area acting as support right now — then I’ll be looking for long opportunities.
But if price breaks below the POC, that invalidates the idea and I’ll step aside. No need to force anything 👍.
Not financial advice ⚠️

NASDAQ formed its 1st 4H Golden Cross in 7 months!Nasdaq (NDX) completed last Friday its first 4H Golden Cross formation in more than 7 months (since May 01). This is taking place while the index is inside a Channel Up, making a V-shaped recovery from the November 21 Low.
The last time all the above conditions were fulfilled was exactly during the May Golden Cross. With the 4H MA200 (orange trend-line) as its Support, the index eventually hit its previous All Time High (ATH).
As we've entered the Fed week, we can finally see this move to the ATH Resistance, so our short-term Target on Nasdaq remains 26200.
---
** Please LIKE 👍, FOLLOW ✅, SHARE 🙌 and COMMENT ✍ if you enjoy this idea! Also share your ideas and charts in the comments section below! This is best way to keep it relevant, support us, keep the content here free and allow the idea to reach as many people as possible. **
---
💸💸💸💸💸💸
👇 👇 👇 👇 👇 👇

Market Focus on QQQ — Bullish Setup Taking Shape!🎯 QQQ ($INVESCO NASDAQ-100) Bullish Swing Trade Setup
The Layered Entry "Thief" Strategy | Profit Playbook 💰
📈 MARKET OUTLOOK
The QQQ (INVESCO QQQ TRUST) is positioned for a bullish swing trade setup. 🚀 This technical analysis focuses on strategic multi-layer entry execution with defined risk/reward parameters suitable for intermediate swing traders.
🎪 ENTRY STRATEGY: "LAYERED THIEF" METHOD
This isn't your typical entry—we're using smart limit order layering 🎯 to accumulate positions at key support zones. Think of it as a professional scale-in approach!
📍 Limit Order Entry Layers:
Layer 1: $605.00 ⭐
Layer 2: $610.00 ⭐
Layer 3: $615.00 ⭐
Layer 4: $620.00 ⭐
💡 Pro Tip: Feel free to add additional layers ($625, $630, etc.) based on your risk tolerance and account size. The thief's advantage is patience and positioning!
Entry Triggers: Volume confirmation + Support zone bounce + Institutional accumulation signals 📊
🛑 STOP LOSS (Risk Management)
⚠️ THIEF SL: $590.00
📢 DISCLAIMER: This stop loss is a suggestion only. You are responsible for setting your own risk parameters based on your trading capital, risk tolerance, and market conditions. Trade at your own risk! 🎲
🎊 PROFIT TARGETS (Exit Strategy)
PRIMARY TARGET: $650.00 ✅
SECONDARY RESISTANCE: $660.00 ⚠️
Note: The $660 zone presents strong technical resistance combined with overbought conditions and potential reversal traps. We recommend taking profits at $650 and letting a small portion run if momentum confirms. Smart money moves!
📢 DISCLAIMER: Target levels are suggestions based on technical analysis. Your profit-taking strategy should align with your personal risk/reward ratio. Final exit decisions rest with you! 🎯
🔗 CORRELATED PAIRS TO MONITOR
Keep an eye on these related assets for confirmation signals:
🔴 QQQ Constituents & Index Correlation:
NASDAQ:AAPL (Apple Inc.) — Tech sector heavyweight; if AAPL breaks support, QQQ may follow 📱
NASDAQ:MSFT (Microsoft Corp.) — AI & cloud leader; typically leads QQQ moves upward 🤖
NASDAQ:NVDA (NVIDIA Corp.) — Semiconductor bellwether; massive correlation to tech rallies 💻
NASDAQ:TSLA (Tesla Inc.) — Growth driver; watch for momentum continuation signals ⚡
NASDAQ:GOOGL (Alphabet Inc.) — Large-cap tech anchor; supports QQQ uptrend confirmation 🔍
📊 Macro-Level Pairs:
NASDAQ:NDX (NASDAQ-100 Index) — Direct parent index; should mirror QQQ closely 📈
AMEX:SPY (S&P 500 ETF) — Broader market health check; risk-on environment confirmation ⭐
AMEX:IWM (Russell 2000 Small-Cap) — Risk sentiment gauge; divergence = caution ⚠️
TVC:DXY (US Dollar Index) — Inverse correlation; strong dollar = headwind for tech 💵
Key Correlation Points: Watch for tech sector strength continuation and macro risk-on sentiment. If NDX confirms, QQQ breakout is highly probable! 🚀
💡 STRATEGY BREAKDOWN
✅ Bullish Bias with patience-based accumulation
✅ Defined Risk at the $590 level
✅ Layered Entry for optimal position sizing
✅ Technical Confluence at resistance zones
✅ Risk/Reward Potential = Approx 1:2.5 ratio
🎓 TECHNICAL VALIDATION CHECKLIST
✅ Support zone identification at $605-620 range
✅ Volume analysis at entry levels
✅ RSI divergence confirmation
✅ Moving average alignment (200 SMA positioning)
✅ Institutional order flow patterns
✅ Market structure (Higher Highs/Higher Lows)
✨ If you find value in my analysis, a 👍 and 🚀 boost is much appreciated — it helps me share more setups with the community!
#QQQ #SwingTrade #TechETF #NASDAQ100 #TradingStrategy #ThiefStrategy #LayeredEntry #ProfitPlaybook #Bullish #TechnicalAnalysis #ETFTrading #RiskManagement #ActiveTrading

Will NAS100 Sustain Its Bullish Momentum After the Pullback?NAS100 🚀 Bullish Swing Setup | SuperTrend Pullback & Layered Entry Strategy
🎯 TRADE IDEA: NAS100 (US100) BULLISH SWING
Capitalize on a structured pullback in the NASDAQ 100! This plan leverages a proven indicator confluence for a high-probability long opportunity.
📊 ANALYSIS & CONFIRMATION:
Trend: Primary Bullish Trend is intact. ✅
Trigger: Price is pulling back into a demand zone, offering a favorable risk-to-reward entry.
Indicator: The SuperTrend ATR Line is acting as dynamic support on the 4H/Daily timeframe. A bounce from this level confirms our bullish bias.
⚡ STRATEGY: "THE THIEF" LAYERED ENTRY
This method uses multiple limit orders to average into a position, perfect for volatile markets like the NASDAQ.
Entry Zone: Look for entries between 25,200 - 25,600
Layer Example:
🟢 Limit Order 1: 25,600
🟢 Limit Order 2: 25,400
🟢 Limit Order 3: 25,200
👉 You can adjust the number of layers and prices based on your capital and risk appetite.
❗ RISK MANAGEMENT:
Stop Loss (SL): A decisive break below 24,800 would invalidate the bullish structure.
⚠️ IMPORTANT NOTE: This is MY protective stop. Dear Thief OG's 👑, you MUST adjust your position size and SL based on your personal risk management strategy. Protect your capital first!
🎯 PROFIT TARGETS:
Primary Target: 25,600 (Initial resistance & profit-taking zone).
Key Reasoning: We anticipate a reaction here due to:
Moving Average resistance.
Potential overbought conditions on lower timeframes.
A "trap" for late buyers.
👉 Smart Move: Consider taking partial profits at 25,600 and trailing your stop for the remainder. Escape the trap with your profits! 💰
⚠️ REMINDER: Dear Thief OG's 👑, your Take Profit (TP) is your own decision. Secure gains based on your trading plan and market behavior.
🔍 RELATED ASSETS & MARKET CORRELATION:
Watching these related instruments can provide confirmation and a broader market view.
TVC:DXY (U.S. Dollar Index): 🟡 NEGATIVE CORRELATION
A weakening Dollar ( TVC:DXY DOWN) is generally bullish for Nasdaq. If the Dollar is falling, it adds confidence to this long thesis.
USTECH (CFD on Nasdaq 100): 🟢 DIRECT CORRELATION
Moves in sync with NAS100. Perfect for cross-verifying price action and volume.
NASDAQ:AAPL , NASDAQ:MSFT , NASDAQ:TSLA (Mega-Caps): 🟢 HIGH IMPACT
These heavily weighted Nasdaq components drive the index. Bullish momentum in these stocks supports a rising NAS100.
FOREXCOM:SPX500 (S&P 500): 🟢 POSITIVE CORRELATION
A strong S&P 500 often lifts the Nasdaq. Monitor for overall U.S. market strength.
💬 Let me know your thoughts in the comments!
What's your entry strategy for the NAS100 this week?
#NAS100 #US100 #TradingView #SwingTrading #Bullish #SuperTrend #TradingStrategy #IndexTrading #LayeredEntry #ThiefStrategy

NASDAQ NAS100 Analysis and My Trade Plan📊 Currently analysing NAS100 (NASDAQ), we can see that price has broken structure to the upside, confirming bullish intent. Right now, NAS100 is retesting the value area and the Point of Control (POC) on the volume profile — a critical zone to watch 👀📈
⚠️ Price action is a bit precarious. After a strong impulsive move, we’ve now seen a deep and aggressive retracement, which opens the door for potential bearish movement this week.
📆 However, my higher-timeframe bias remains bullish, with the weekly chart still supporting upward continuation.
📌 My plan:
If price holds above the current POC, then breaks and retests cleanly, I’ll be looking for long opportunities. If it breaks below the POC, I will step aside and abandon the long bias 🚫
This is not financial advice — just my personal market outlook. 💬📉📈

NASDAQ Santa Rally already underway.Nasdaq (NDX) has made a strong V-shaped recovery on its 1D MA100, as projected on our previous analysis and is extending the uptrend above the 4H MA200 (orange trend-line).
The rally may need a relief pull-back towards its 4H MA50 (blue trend-line) but technically, the seasonal end-of-the-year 'Santa Rally' is already underway.
V-shaped recovery and Inverse Head and Shoulders patterns typically target their 2.0 Fibonacci extensions. That is currently at 26600.
---
** Please LIKE 👍, FOLLOW ✅, SHARE 🙌 and COMMENT ✍ if you enjoy this idea! Also share your ideas and charts in the comments section below! This is best way to keep it relevant, support us, keep the content here free and allow the idea to reach as many people as possible. **
---
💸💸💸💸💸💸
👇 👇 👇 👇 👇 👇

Tech Sector Goes "Three Black Crows" — Bear Market Cont PatternThree Black Crows is a term used to describe a bearish candlestick pattern that can predict a reversal in an uptrend.
Classic candlestick charts show "Open", "High", "Low" and "Close" prices of a bar for a particular security. For markets moving up, the candlestick is usually white, green or blue. When moving lower they are black or red.
The Three Black Crows pattern consists of three consecutive long-body candles that opened with a gap above or inside the real body of the previous candle, but ultimately closed lower than the previous candle. Often traders use this indicator in combination with other technical indicators or chart patterns to confirm a reversal.
Key points
👉 Three Black Crows is a Bearish candlestick pattern used to predict a reversal to a current uptrend, used along with other technical indicators such as the Relative Strength Index (RSI).
👉 The size of the Three black crow candles, timeframe they appeared on, the gaps when they opened, the downward progression sequence, as well as their shadows can be used to judge whether there is a risk of a pullback on a reversal.
👉 The “Three Black Crows” pattern should be considered finally formed after the sequential closure of all three elements included in it.
👉 The opposite pattern of three black crows is three white soldiers, which indicates a reversal of the downward trend. But maybe more about that another time.
Explanation of the Three Black Crows pattern
Three Black Crows is a visual pattern, which means there is no need to worry about any special calculations when identifying this indicator. The Three Black Crows pattern occurs when the bears outperform the bulls over three consecutive trading bars. The pattern appears on price charts as three bearish long candles with or without short shadows or wicks.
In a typical Three Black Crows appearance, bulls start the time frame with the opening price or gap up, that is, even slightly higher than the previous close, but throughout the time frame the price declines to eventually close below the previous time frame's close.
This trading action will result in a very short or no shadow. Traders often interpret this downward pressure, which lasted across three time frames, as the start of a bearish downtrend.
Example of using Three black crows
As a visual pattern, it is best to use the Three Black Crows as a sign to seek confirmation from other technical indicators. The Three Black Crows pattern and the confidence a trader can put into it depends largely on how well the pattern is formed.
Three Black Crows should ideally be relatively long bearish candles that close at or near the lowest price for the period. In other words, candles should have long real bodies and short or non-existent shadows. If the shadows are stretching, it may simply indicate a slight change in momentum between bulls and bears before the uptrend reasserts itself.
Using trading volume data can make the drawing of the Three Black Crows pattern more accurate. The volume of the last bar during an uptrend leading to the pattern is relatively lower in typical conditions, while the Three Black Crows pattern has relatively high volume in each element of the group.
In this scenario, as in our case, the uptrend was established by a small group of bulls and then reversed by a larger group of bears.
Of course, this could also mean that a large number of small bullish trades collide with an equal or smaller group of high volume bearish trades. However, the actual number of market participants and trades is less important than the final volume that was ultimately recorded during the time frame.
Restrictions on the use of three black crows
If the "Three Black Crows" pattern has already shown significant downward movement, it makes sense to be wary of oversold conditions that could lead to consolidation or a pullback before further downward movement. The best way to assess whether a stock or other asset is oversold is to look at other technical indicators, such as relative strength index (RSI), moving averages, trend lines, or horizontal support and resistance levels.
Many traders typically look to other independent chart patterns or technical indicators to confirm a breakout rather than relying solely on the Three Black Crows pattern.
Overall, it is open to some free interpretation by traders. For example, when assessing the prospects of building a pattern into a longer continuous series consisting of “black crows” or the prospects of a possible rollback.
In addition, other indicators reflect the true pattern of the three black crows. For example, a Three Black Crows pattern may involve a breakout of key support levels, which can independently predict the start of a medium-term downtrend. Using additional patterns and indicators increases the likelihood of a successful trading or exit strategy.
Real example of Three black crows
Since there are a little more than one day left before the closing of the third candle in the combination, the candlestick combination (given in the idea) is a still forming pattern, where (i) each of the three black candles opened above the closing price of the previous one, that is, with a small upward gap, (ii ) further - by the end of the time frame the price decreases below the price at close of the previous time frame, (iii) volumes are increased relative to the last bullish time frame that preceded the appearance of the first of the “three crows”, (iv) the upper and lower wicks of all “black crows” are relatively short and comparable with the main body of the candle.
Historical examples of the Three Black Crows pattern
In unfavorable macroeconomic conditions, the Three Black Crows pattern is generally quite common.
The weekly chart of the S&P500 Index (SPX) below, in particular, shows the occurrence of the pattern in the period starting in January 2022 and in the next 15 months until April 2023 (all crows combinations counted at least from 1-Month High).
As it easy to notice, in each of these cases (marked on the graph below) after the candlestick pattern appeared, the price (after possible consolidations and rollbacks) tended to lower levels, or in any case, sellers sought to repeat the closing price of the last bar in series of the Three Black Crows candlestick pattern.
Bottom Line
👉 As well as in usage of all other technical analysis indicators, it is important to confirm or refute its results using other indicators and analysis of general market conditions.
👉 Does History repeat itself? - Partially, yes.. it does. This is all because financial markets (as well as life) is not an Endless Rainbow, and after lovely sunny days, earlier or later, dark clouds may appear again, and again.

IBB d2 accumulation buy/hold setup 40% gains🔸Hello guys, today let's review 2daily chart for IBB . Entering re-accumulation
stage now, expecting range bound trading during autumn time season.
Range defined by range highs set at 135 usd and range lows at 117 usd.
🔸Similar fractal observed in 2018/2019. Faded into range after heavy spike,
re-accumulation then 50% pump later during spring 2020.
🔸Recommended strategy bulls: wait for pullback to complete and reload low
near range lows close to 111/113 usd (premium prices). TP1 bulls +20% gains,
TP2 bulls +40% gains. buy/hold setup for patient traders. good luck!
🎁Please hit the like button and
🎁Leave a comment to support our team!
RISK DISCLAIMER:
Trading Futures , Forex, CFDs and Stocks involves a risk of loss.
Please consider carefully if such trading is appropriate for you.
Past performance is not indicative of future results.
Always limit your leverage and use tight stop loss.

NQ on Major Support Target 36,490Nasdaq 100 index is on major support since September. This is the area you want to buy and as it goes up take some profits if you want for a potential check back into support around early 2027 (green path).
There's the alternative scenario (orange path) that we just trend right up to 36,490 resistance and then have a major pullback to the long term trend. This one is less likely, but possible.
Either way if you sell some of your position (like shorter term options) in the middle of the range you're likely to be in a better position than holding the entire time as eventually that lower trend should get hit and that's a lot of time decay to ruin your positions.
Good luck!

Will SPX Make New All Time Highs? We dive into the recent technical setup of the S&P500.
We are on the verge of triggering a new massive bullish patterns.
The backdrop of soft commodities. soft yields, softer dollar and the December 10 rate cute.
We have the tailwinds in place for higher price.
I would like to see some sideways chop to make this rally more sustainable, but bull market bounces are very fierce especially when they come from failed bearish patterns.

Nasdaq 100, USD Index: Thanksgiving PerformanceToday I’m digging into my Excel data to see how the Nasdaq and the US Dollar Index performed across the three trading days either side of Thanksgiving.
Matt Simpson, Market Analyst at City Index.

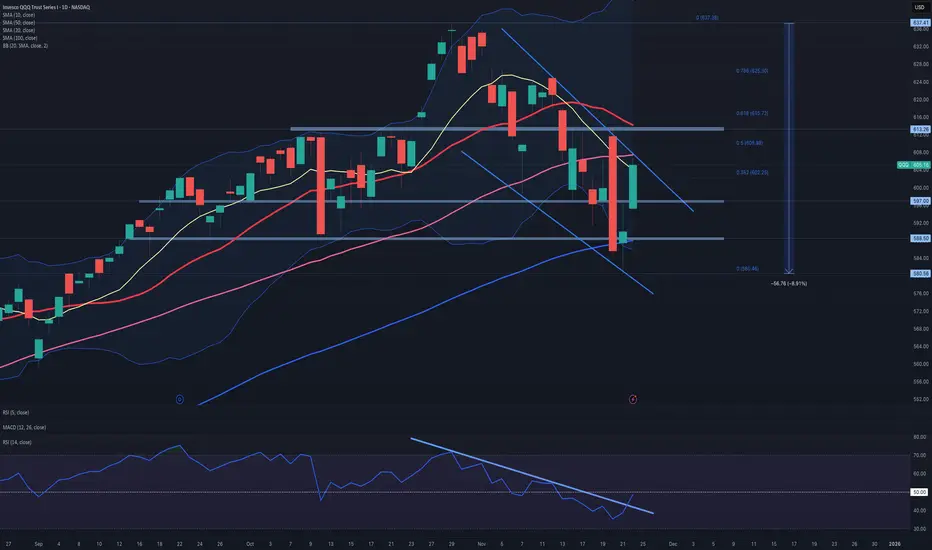
$QQQ: IS THE PULLBACK OVER ?Has the pullback from the all-time high concluded?
Analysis of the chart indicates that the decline from the all-time high appears corrective. This suggests it is unlikely to undermine the prevailing upward trend that began at the lows observed in April, despite registering a 9% decrease.
It is noteworthy that the 0.382 retracement level lies at 548, and the 200-day simple moving average (SMA) is positioned at 544. Consequently, the correction remains well within the boundaries of the existing uptrend, as it has yet to approach the typical 0.382 retracement threshold.
There is also potential evidence of a bullish flag pattern emerging.
The presence of a bearish marubozu candle followed by a doji during the downtrend could imply a potential reversal, with today's bullish gap-up-and-go serving as a possible confirmation signal.
Furthermore, the 14-period RSI has surpassed its resistance trendline; however, this should be validated by a sustained move above the 50 level.
While there are encouraging technical signals, a definitive bottom has not yet been confirmed yet.
Key indicators to monitor include:
• The establishment of higher highs and higher lows, maintaining support at 588.
• A break above the upper trendline of the flag pattern, including moves above the 50-day moving average and significant resistance at 613.
Although QQQ continues in a favorable direction, it is premature to confirm a conclusive trend reversal at present.
Will December Rate Cut Save the Market?Is Rate Cut Probability up a Short-Term Bounce or continuation of the downtrends?

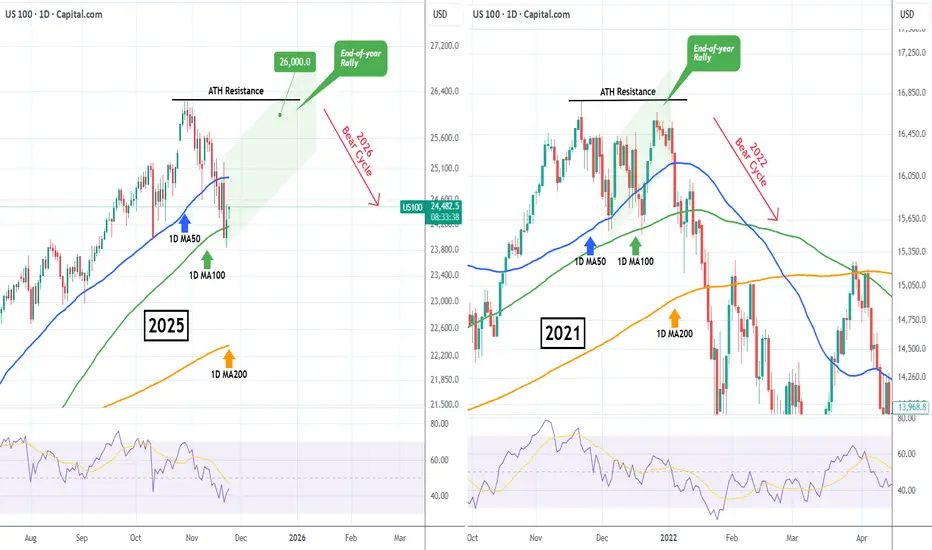
NASDAQ Santa Rally back to 26000 started?Nasdaq (NDX) rebounded on Friday after marginally breaching below its 1D MA100 (green trend-line) for the first time since May 09! The continuation today is a sign of a potentially strong rebound, the traditional end-of-year rally that is know as 'Santa's rally'.
Based on the 2021 Bull Cycle, which after touching its own 1D MA100 it started a final rally that almost tested its ATH Resistance, we can expect Nasdaq to now rise towards the end of the year to potentially 26000.
Could this be the last rally before a new Bear Cycle in 2026?
---
** Please LIKE 👍, FOLLOW ✅, SHARE 🙌 and COMMENT ✍ if you enjoy this idea! Also share your ideas and charts in the comments section below! This is best way to keep it relevant, support us, keep the content here free and allow the idea to reach as many people as possible. **
---
💸💸💸💸💸💸
👇 👇 👇 👇 👇 👇
Nasdaq NAS100 Analysis: The Conditions I Need Before Going ShortI'm keeping a close eye on NAS100 (Nasdaq) right now. 📉✨ On the 4H timeframe, price remains in a clean, sustained bearish trend, and I'm anticipating a potential continuation lower.
If price rejects the current level and fails to retrace through the 1H imbalance, and we see a rotation followed by a bearish break of structure, I'll be preparing for a short opportunity. 📊🔻
Not financial advice.

US100 Reversal Map – Hull MA + Heikin Ashi Confirmation🧠 US100 / NASDAQ100 Profit Pathway Setup — The Thief’s Bullish Escape Plan! 💰🚀
📊 Market Bias: Bullish (Day Trade Setup)
The Thief Trader has spotted a golden pathway in the NASDAQ100 (US100)!
Here’s the breakdown of the plan — straight from the thief’s vault 🕵️♂️📈
🎯 Plan Overview
Bias: Bullish continuation confirmed
Technical Confirmation:
✅ Double Pullback on Hull Moving Average
✅ Retest Zone successfully defended
✅ Heikin Ashi Bullish Doji signaled a trend reversal confirmation
💡 Momentum is shifting upward — the trend has officially changed!
💎 Entry Strategy (Layered Thief Style)
The Thief Strategy applies a layered entry method — multiple buy limits to average into strength.
📥 Buy Limit Layers:
25,300
25,400
25,500
25,600
(Traders can adjust or add more layers based on risk appetite and confirmation zones.)
🛡️ Stop-Loss Setup
This is the Thief SL @ 25,100
⚠️ Note to Thief OG’s:
I’m not recommending my SL as your SL — always customize risk and secure your own bag. Manage your position with discipline and independence! 💼
🎯 Take-Profit Zone
Target: 26,200
🚨 The Police Barricade Zone acts as a strong resistance — overbought levels spotted and potential bull trap alert!
Kindly exit with profit before the officers arrive. 😎
⚠️ Note: Profit-taking is at your discretion. Book and Run!
📈 Related Pairs to Watch (Correlation Insight)
NASDAQ:NDX / CAPITALCOM:US100 / NASDAQ:QQQ : All mirror NASDAQ movement.
SP:SPX / AMEX:SPY : Often correlate with NASDAQ’s momentum (watch divergence for clues).
TVC:VIX : If volatility spikes, expect pullbacks on tech-heavy indices.
TVC:DXY : A weak dollar often fuels US100 bullish legs — keep an eye on it.
NASDAQ:AAPL / NASDAQ:MSFT / NASDAQ:NVDA : Leading drivers of NASDAQ — if they pump, the index follows. 💪
🧩 Key Insights
Hull MA alignment confirms momentum shift.
Retest + bullish Heikin Ashi Doji = market reversal confirmation.
Layered entries give flexibility in volatile intraday conditions.
Dynamic risk management is key — never marry a position.
✨ “If you find value in my analysis, a 👍 and 🚀 boost is much appreciated — it helps me share more setups with the community!”
#US100 #NASDAQ100 #ThiefTrader #DayTrading #IndexTrading #HullMA #HeikinAshi #LayeredEntries #TechnicalAnalysis #TradingSetup #PriceAction #MarketReversal #TradingCommunity #BullishPlan #SmartMoneyFlow #TradeIdeas #ThiefStrategy

NASDAQ DEC 2025, Next week will unveil it all.I often like to use this approach, where I start from the most generic timeframe that still carries importance, moving into smaller timeframes narrowing the timeframe at each step, finally concluding with a short-term trade opportunity.
This post focuses solely on technical analysis, price action and trend behavior on the NDX. No fundamental expectations or macroeconomic interpretations are included.
I will be updating this post as trade opportunities develop.
A summary of this idea is provided at the end.
--- Long-Term Behavior ---
Long term outlook indicates that NDX had a strong bullish momentum until now, it pushed above the almost 5 year bullish trend marked with orange lines.
However, before it pushed above, NDX experienced a sharp decline. (marked with yellow circle)
But price carried back up with the yellow trend and created a much stronger bullish movement which managed to push further.
Now that stronger bullish movement is also over, NDX should be falling back for a retest. The last monthly candle was possibly the beginning of that retest movement.
After the retest two scenarios are possible, either it continues the bullish movement with a much higher pace or price fails to hold the retest and falls back toward the lower boundary of the previous long-term trend.
-- Short-Term Behavior --
In this section, I will be investigating the short-term movements to better predict a possible trade opportunity.
If we zoom into the yellow trend, the price was following a path estimated with the purple lines. Which also justifies the last months harsh fallback.
I expect NDX to start moving towards the lower boundary of the trend marked with yellow. (also, weekly RSI shows clear decrease in bullish momentum, indicating the yellow trend is coming to an end)
With all these in mind, to further predict the next 2-3 weeks movement, zooming into the last couple of months. NDX's last bearish movement, which I have shown with blue trend, can go two ways which the next weeks price movement will unveil. If the next week starts up bullish and the price fails to go down further NDX may rapidly rise. On the other hand, If it forms a steeper downtrend which I have shown in the second snapshot, it may possibly keep moving down for the long-term retest.
note that the trend drawings are estimations and may not be totally accurate.
-- Summary and Final Verdict --
Next week, we should see a clear directional bias for NDX
Bearish scenario: If price continues downward and establishes a steeper trend (as shown in the image), NDX is likely heading toward a full retest of the long-term breakout area.
Target: ~22,000
Bullish scenario: If the index shows clear signs of reversal and rejects further downside, a swift recovery toward previous highs is possible.
Target: ~26,500
I will be updating the post as we get a clearer image...

NQ Higher then Bear MarketThink we have one last leg up in NDX/NQ here then a bear market to follow.

NDX - 92% From ZeroI want you to always remember one thing:
Wherever the price goes, it’s always 100% from zero.
That’s why every now and then you need to take the chart off log and look at it with fresh eyes.
Occam’s razor.
I keep hearing the PERMA-BULL crowd screaming that “the bears are calling this an AI bubble,” and in the same breath whining that the pullback is “overdone” or “extreme.”
Really?
The S&P is down 5%, and they’re already crying about the bears?
SMH.
It’s all strawman nonsense. Don’t fall for it.
Take it off log…
Remember everything is 100% from zero…
Use your basic, instinctive judgment…
And then ask yourself what your eyes are telling you when you look at this chart.
That’s the truth — not the narratives.
THANK YOU for getting me to 5,000 followers! 🙏🔥
Let’s keep climbing.
If you enjoy the work:
👉 Boost
👉 Follow
👉 Drop a solid comment
Let’s push it to 6,000 and keep building a community grounded in truth, not hype.