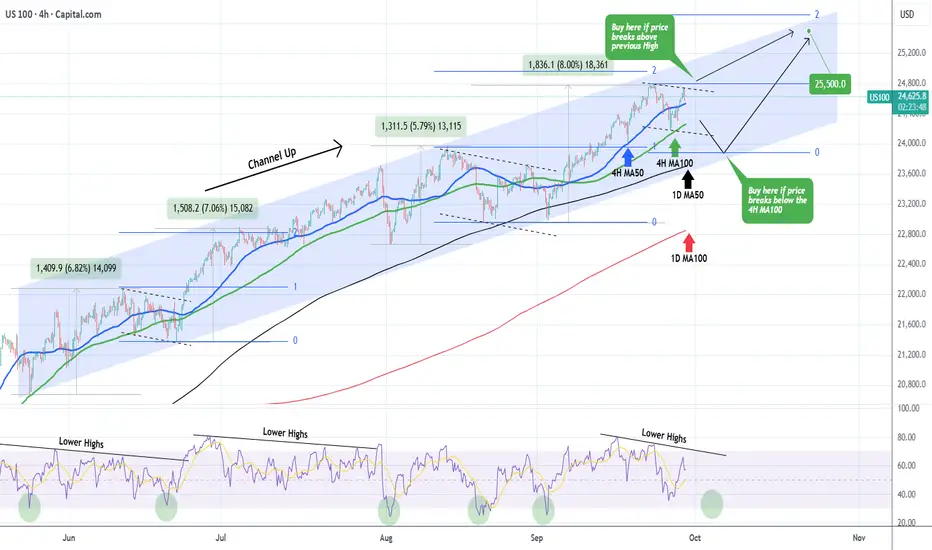
NASDAQ in no action zone. Buy break-out or pull-back.Nasdaq (NDX) has been trading within a 4-month Channel Up and its most recent low has been on its 4H MA100 (green trend-line) 2 days ago.
As long as it holds, it maintains the short-term bullish trend but a confirmed buy signal would be after the price breaks above its previous 24800 High.
Until it does, it might be within a technical Bearish Leg similar to late August's and mid June's that both broke below the 4H MA100 before bottoming on the Higher Lows trend-line of the Channel Up and rebounded. The 4H RSI Lower Highs structure shows that we might be on such a pull-back sequence, which turns into a buy below 33.00 (RSI).
As a result, we will either wait for a 24800 break-out or a 1D MA50 (black trend-line) pull-back before initiating a buy again. In both cases, our Target is 25500 (just below the 2.0 Fibonacci extension).
-------------------------------------------------------------------------------
** Please LIKE 👍, FOLLOW ✅, SHARE 🙌 and COMMENT ✍ if you enjoy this idea! Also share your ideas and charts in the comments section below! This is best way to keep it relevant, support us, keep the content here free and allow the idea to reach as many people as possible. **
-------------------------------------------------------------------------------
💸💸💸💸💸💸
👇 👇 👇 👇 👇 👇
NASDAQ 100 CFD
SPY trend Broken? Use this Long / Short StrategyLast week was a choppy sell off in the markets.
We did see the bulls defend price later into the week by bouncing the main indices very nicely.
We discuss the simple support / resistance where you should be watching.
Using the daily 7MA as resistance can be shorted however if we recapture and close above, then the markets remain a long to new highs.
The trend of higher lows is still in tact signaling bullish strength... can we search for a new higher high?

September 2025 Market Summary Gold and ForexProjectSyndicate Market Summary September 2025
📊 MTD performance
🟡 GOLD (XAUUSD): 3,759.65 | +286.65 (+8.31%)
💶 EURUSD: 1.1702 | +16 pips (+0.14%)
💷 GBPUSD: 1.3392 | −112 pips (−0.83%)
💴 USDJPY: 149.19 | +211 pips (+1.43%)
📈 SPX: 6,637.97 | +236.46 (+3.69%)
📈 NDX: 24,503.57 | +1,483.10 (+6.44%)
________________________________________
🗞 September overview
• 🇺🇸 The Fed cut 25 bps on September 17 and flagged the possibility of further cuts this year, reinforcing a softer USD bias and boosting gold demand.
• 🇪🇺 The ECB held rates on September 11, though left the door open for easing later.
• 🇬🇧 The Bank of England held rates and slowed quantitative tightening on September 18.
• 🇯🇵 The BoJ maintained a “hawkish hold” on September 19, started unwinding ETF/REIT holdings, and signaled possible rate risks into October — supporting JPY on abrupt USD strength.
• 🟡 Gold made a fresh intramonth high near ~$3,790, before settling slightly lower.
• Stronger U.S. economic data mid-month (jobs, yields) briefly undercut rate cut expectations, leading to a temporary gold dip, but the momentum has largely resumed.
• Tariff announcements and trade-policy uncertainty added safe-haven tailwinds to gold.
________________________________________
🟡 Gold Market Overview – September 2025
✨ Key Highlights & Drivers
• All-time high revisit: Spot gold pushed toward $3,790 mid-month on renewed enthusiasm for Fed easing and weaker USD.
• Volatility around economic surprises: Upside surprises in US data (jobs, GDP) triggered brief USD strength that pressured gold, but the downside was limited.
• Fed narrative remains gold’s ally: The dovish pivot (25 bps cut + future cuts flagged) continues to lend structural support to gold.
• ETF & institutional flows: Inflows into gold ETFs have reaffirmed investor appetite for safe-haven exposure.
• Risk / geopolitical spillovers: Oil price jitters, trade frictions, and general macro uncertainty underpin demand for non-correlated assets.
• Technical posture: After surging, gold has found interim support in the region of ~$3,650–3,700, with resistance clustering near $3,800. A sustained break above the latter could open targets toward $3,900+.
📊 Performance Recap
Gold has posted one of its strongest monthly performances of 2025, currently up ~8.7 % MTD.
Stronger parts of the rally were clustered around rate cut confirmation and safe-haven demand spikes.
🔍 Risks & Watch-Outs
• A surprise resurgence in U.S. economic strength (inflation, jobs) could push rate markets back toward dovish skepticism, pressuring gold.
• A re-strengthening USD (driven by rates or yield spreads) will be headwind for dollar‐priced gold.
• Central bank actions: further buying or selling by official sectors could tilt balance.
• Technical overextension: short-term pullbacks or consolidations are plausible given the sharp run-up.
________________________________________
💱 FX Landscape – September 2025
• EURUSD: The pair remains stuck under ~1.1700, recovering modestly from USD spikes but lacking strong directional conviction.
• GBPUSD: Under pressure through the month, sliding toward 1.3350 as sterling weakens on yield differentials and global risk dynamics.
• USDJPY: Strength in yields and risk dynamics have nudged USDJPY higher, though BoJ vigilance and intervention risk temper runaway moves.
Broader theme: while risk sentiment supports carry / USD strength, central bank policy cycles and macro surprises are injecting volatility and preventing runaway trends.
________________________________________
📝 Summary & Key Takeaways
✅ What Worked in September
• Gold leveraged dovish central bank messaging and USD softness to consistently outperform across risk regimes.
• Positioning toward safe havens paid off in a month marked by macro surprises and geopolitical noise.
• FX markets remained choppy, with no clear trending momentum — caution was rewarded.
⚠️ What to Watch Going Forward
• U.S. data flow — especially inflation, jobs, and PCE — could reshape Fed expectations and thus gold/FX direction.
• USD momentum — a reversal in dollar strength could compress gold gains; sustained USD weakness could accelerate the bull run.
• Intervention / central banks — any surprises from BoJ, PBoC, or central banks stepping into gold or FX markets could upend positioning.
• Technical zones — if gold can break and hold above $3,800, it may open new leg toward $3,900+; failure may invite a pullback toward $3,650–3,700.

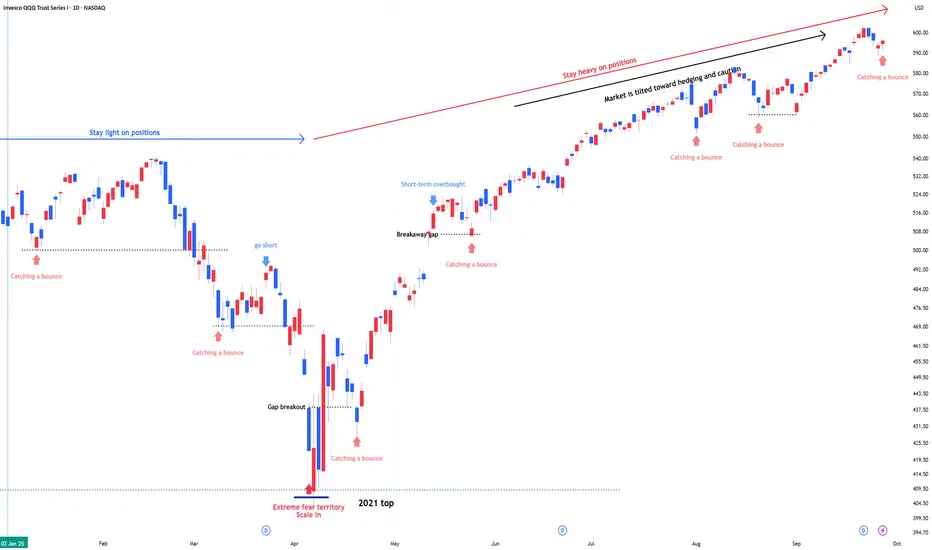
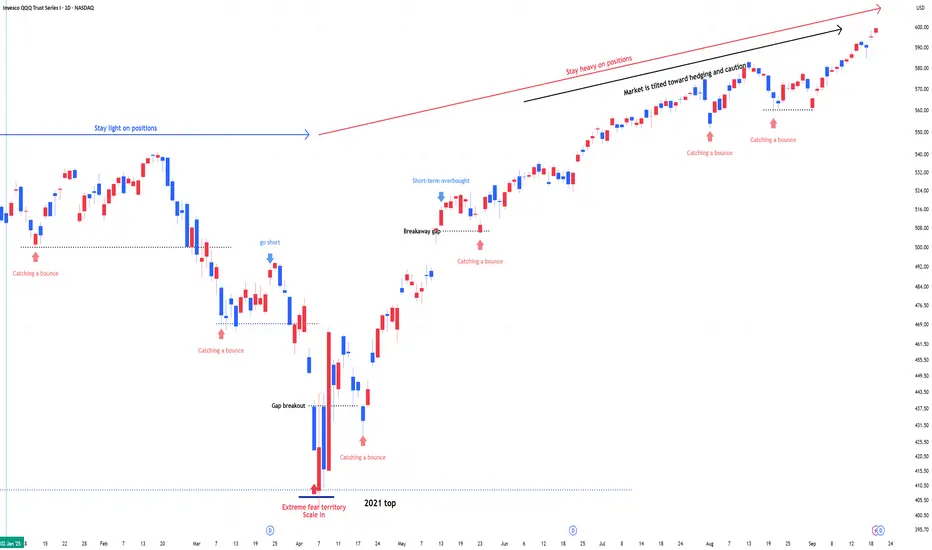
QQQ : Stay heavy on positionsQQQ : Stay heavy on positions (QLD, TQQQ)
Entering a risk-on, high-volatility zone.
A signal for catching a bounce has emerged.
In stay light on positions zones, I hold QQQ and reduce exposure.
In stay heavy on positions zones, I increase allocation using a mix of QLD and TQQQ.
** This analysis is based solely on the quantification of crowd psychology.
It does not incorporate price action, trading volume, or macroeconomic indicators.
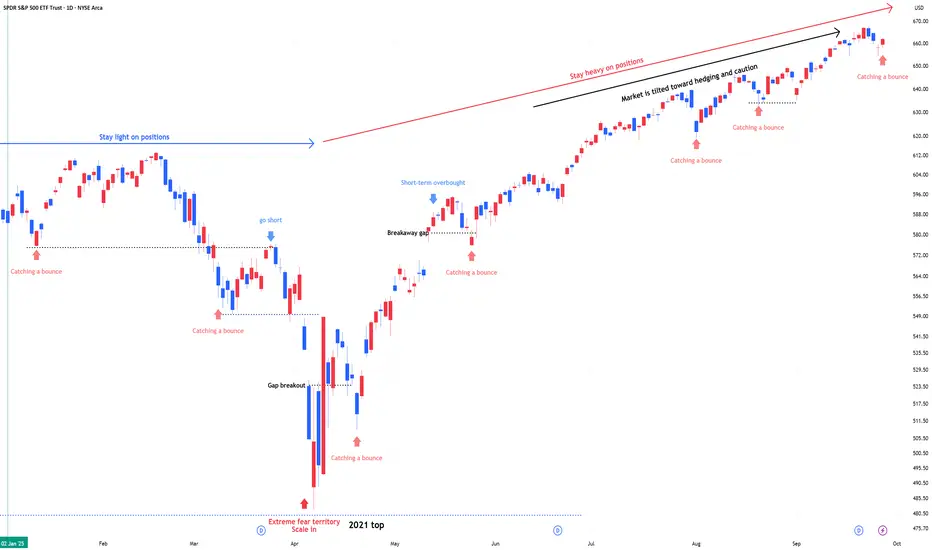
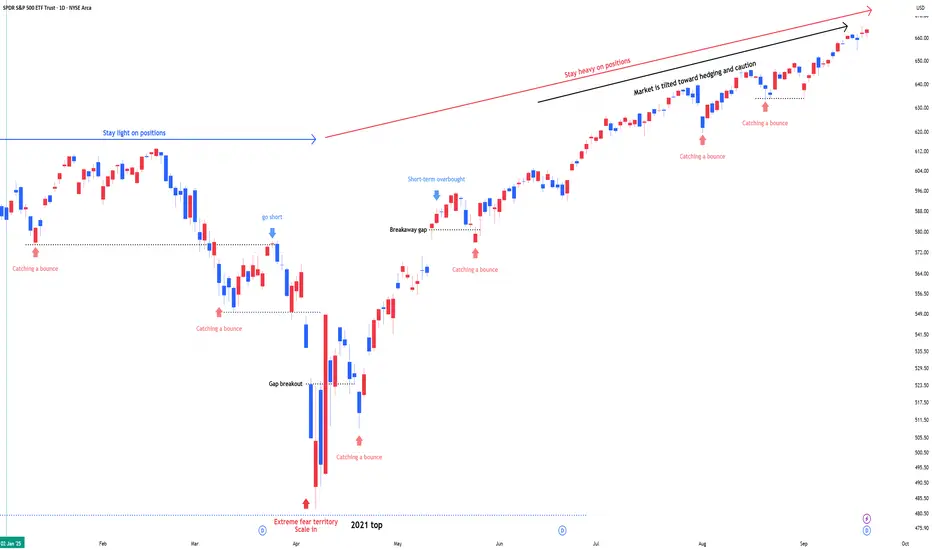
SPY : Stay heavy on positionsSPY : Stay heavy on positions (2x leverage)
Entering a risk-on, high-volatility zone.
A signal for catching a bounce has emerged.
In stay light on positions zones, I hold SPY(+QQQ) and reduce exposure.
In stay heavy on positions zones, I increase allocation using a mix of SSO(+QLD) and TQQQ.
** This analysis is based solely on the quantification of crowd psychology.
It does not incorporate price action, trading volume, or macroeconomic indicators.
NASDAQ100 HIGH PROBABILITY SETUP SOON!!!🚨 NAS100 HIGH PROBABILITY BUY SETUP 🚨
* Here We Can See Clearly The Next Potential Move For US100 Next Hours/Days.
* Keep Your Eyes Close On Your Trading Positions.
* Happy PIP Hunting Traders.
FXKILLA.

NASDAQ NAS100 Analysis: Three-Drive Pattern, VWAP & Trade Plan📊 The NASDAQ 100 has been riding a strong bullish trend, pushing higher with relentless momentum. On the daily timeframe, price now looks heavily overextended 📈.
🔎 Zooming into the 4-hour chart, the overextension is even more apparent. In trending markets, we often observe a three-drive pattern (sometimes a fourth) before an aggressive correction occurs.
⚡ I’m keeping an eye out for a sharp pullback. If price finds support and confirms with a bullish break of market structure, this could present a high-probability long entry setup 🚀.
📹 In the video, I also dive into how I use the VWAP and Fibonacci retracement tools. Both are powerful indicators that provide valuable insight and a trading edge 🔧.
⚠️ Disclaimer: This analysis is for educational purposes only and not financial advice. Always trade responsibly and manage your risk.

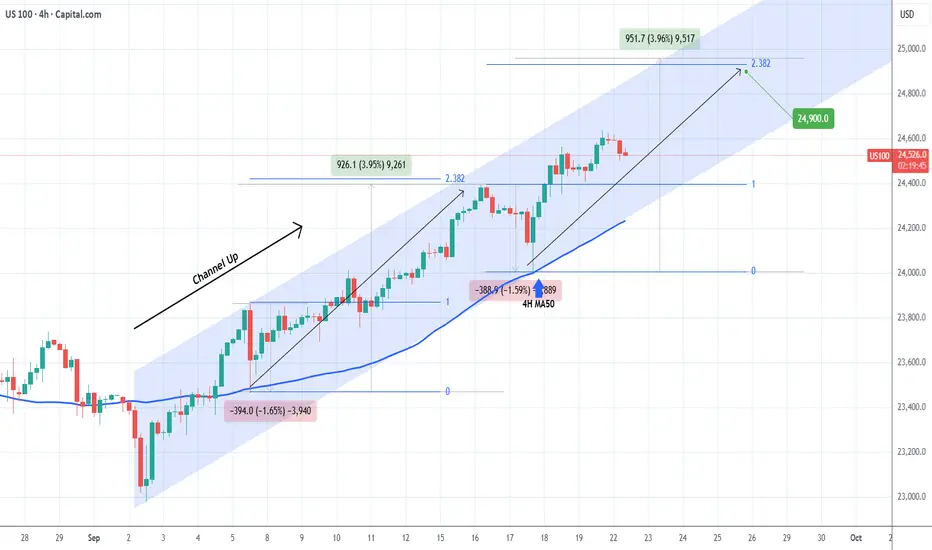
NASDAQ September's Channel Up targets 24900.Nasdaq (NDX) has been trading within a Channel Up since the September 02 Low and at the moment it is unfolding its 2nd Bullish Leg following the 4H MA50 (blue trend-line) bounce on September 17.
Based on the previous 4H MA50 Bullish Leg, the sequence should peak below the 2.382 Fibonacci extension at a maximum +3.96% rise. Our Target is slightly below those at 24900.
-------------------------------------------------------------------------------
** Please LIKE 👍, FOLLOW ✅, SHARE 🙌 and COMMENT ✍ if you enjoy this idea! Also share your ideas and charts in the comments section below! This is best way to keep it relevant, support us, keep the content here free and allow the idea to reach as many people as possible. **
-------------------------------------------------------------------------------
💸💸💸💸💸💸
👇 👇 👇 👇 👇 👇
Nasdaq-100 (NDX) Weekly Chart 2025 Chart Context
This weekly timeframe analysis of the Nasdaq-100 Index (NDX) forms a key pillar in our 2025 macro analysis series. Following the breakout structure seen in TOTAL, TOTAL2, BTC.D, and US10Y, this chart utilizes 2 Fibonacci tools (1 trend-based extensions and 1 retracement) to project potential corrective and expansion scenarios.
Fibonacci Tools Used:
Fibonacci Retracement : Applies to the recent smaller swing to determine micro retracement zones and cluster supports.
0=20674 and 100=10504
Trend-Based Fibonacci Extension: Drawn using a three-leg structure (point A= 3993 to B=16724 to C10504) to forecast upside targets beyond ATH.
All take-profit (TP) levels: TP1 (~23,400), TP2 (~26,700), and TP3 (~30,344.49)—are located at confluence zones where Fibonacci levels from different tools align, reinforcing their validity and strength.
There is a 4TP above all the Visible TPs
Key price references:
0% retracement: ~20,674.71
Next Resistance ~23,400 (confluence of extensions and psychological resistance)
Projected TPs:
1TP=~23,400,
2TP=~26,700,
3TP=~30,344.49,
4TP=44000
Support/Resistance:
Red zone: ~16,700–18,300 (historical S/R and correction target and Fib Confluences)
Resistance zone: ~23,000–23,400 ,
22000(ATH area)
Key Technical Observations:
Fibonacci Retracement from ~20674 to ~15732 marks the initial corrective range.
Trend-Based Extensions forecast:
TP1 (~23,400): First breakout resistance
TP2 (~26,700): Medium-term expansion zone
TP3 (~30,344): Long-term target if macro tailwinds persist
Scenario Pathways:
Bullish Continuation: Breaks above ATH to reach TP2/TP3
Healthy Correction: Pullback to ~20,600 or deeper ~18,300 before resumption
Deep Correction: Revisits ~16,700 zone if macro environment deteriorates
Fundamental Context:
Tech Stocks & Economic Sentiment: NDX is often the first to move during liquidity expansions. Its performance signals risk-on behavior across global equity markets.
Rate Cuts in 2025: With anticipated Fed rate cuts, tech stocks are primed for inflows. Forward earnings valuations rise, justifying extended upside in high-beta tech.
AI Boom & Earnings Growth: Nasdaq is heavily weighted toward AI, cloud, and semiconductors—sectors expected to lead earnings surprises.
NDX Influence on Gold and Crypto
When NDX rallies:
Crypto: Risk appetite improves. Capital rotation flows into altcoins and layer-1 assets.
Bitcoin: Often sees parallel inflows, especially during strong tech rallies (e.g., 2020).
TOTAL & TOTAL3: Begin breakout patterns if NDX continues to surge.
Gold: May stall or correct as investors favor risk assets. However, gold still holds due to macro hedging and real yield pressures.
When NDX corrects:
Crypto: Volatility spikes. Altcoins bleed faster.
Bitcoin: Short-term dip but may decouple if viewed as digital gold.
Gold: Benefits from flight-to-safety behavior.
US10Y: Often reacts inversely to NDX moves—used for confirmation.
Search Highlights (2024–2025):
Institutions view NDX correction as signal to rotate into commodities (incl. gold).
Cross-market correlations show NDX peaks often precede crypto mini-rallies.
De-risking from NDX often triggers gold strength, especially in geopolitical or inflationary backdrops.
Bias & Strategy Implication
Primary Bias: Bullish
Expecting upside continuation to 26,700–30,000 zone
Multiple correction opportunities are present even during rally
Strategic Actions:
Monitor for correction to yellow/red zones for accumulation
Use NDX behavior as leading macro signal for crypto rotations
Watch resistance at 23,400 closely; breakout confirms trend extension
Time Horizon
Short-Term (1–2 months): Watch for breakout or correction to ~20,600–18,300
Mid-Term (3–6 months): Probable test of ~26,700
Long-Term (6–12 months): Potential expansion to ~30,344.49

QQQ : Stay heavy on positions (QLD, TQQQ)- System metrics show the market transitioning into the initial phase of overheating.
In stay light on positions zones, I hold QQQ and reduce exposure.
In stay heavy on positions zones, I increase allocation using a mix of QLD and TQQQ.
** This analysis is based solely on the quantification of crowd psychology.
It does not incorporate price action, trading volume, or macroeconomic indicators.
SPY : Stay heavy on positions (2x leverage)- System metrics show the market transitioning into the initial phase of overheating.
In stay light on positions zones, I hold SPY(+QQQ) and reduce exposure.
In stay heavy on positions zones, I increase allocation using a mix of SSO(+QLD) and TQQQ.
** This analysis is based solely on the quantification of crowd psychology.
It does not incorporate price action, trading volume, or macroeconomic indicators.
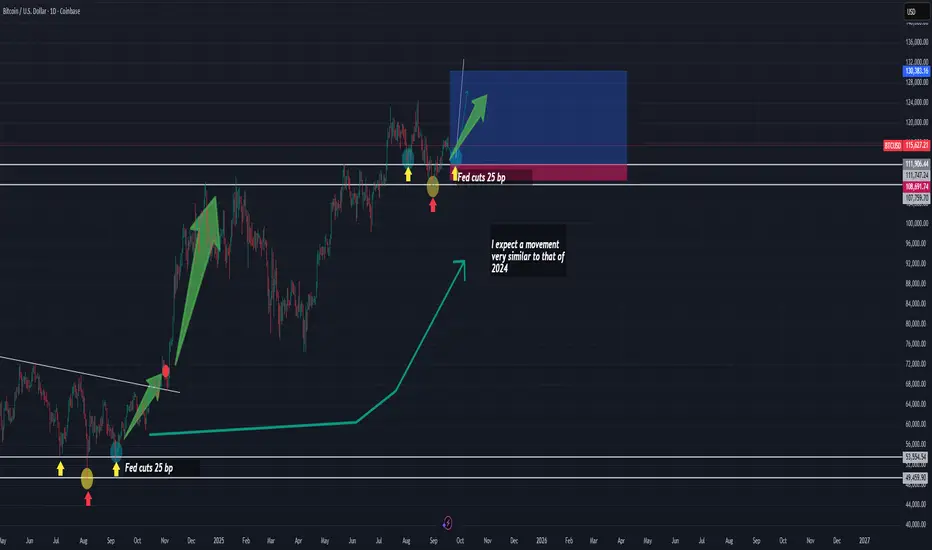
Bitcoin Trade of the Week: Liquidity Rules the MarketOne of the most decisive factors for markets right now is the expansion of liquidity. The growth of global M2 remains evident, particularly in China, where the economy faces a deflationary backdrop that forces authorities to maintain – and even expand – both monetary and fiscal stimulus. Ultimately, these flows permeate global financial markets and, as I’ve explained on several occasions, liquidity is the fuel that drives asset prices.
A Parallel with 2024
What we are observing today shows remarkable similarities with what happened in 2024. Back then, the start of Federal Reserve rate cuts marked a turning point. Even a moderate 25-basis-point cut triggered a rebound that coincided with a technical consolidation phase in Bitcoin, shaped as a descending channel.
Later, in November 2024, when the Fed accelerated the move with a 50-basis-point cut, the result was a much more aggressive bullish impulse.
Today, we find ourselves in an environment with rising probabilities of further cuts in upcoming Fed meetings, which could once again act as a catalyst.
Correlation Context with the Nasdaq 100
Meanwhile, the Nasdaq 100 is printing all-time highs, reflecting the strong risk appetite in tech assets. Bitcoin, in contrast, remains slightly behind its own highs. This divergence can be interpreted as a window of opportunity: if additional liquidity is confirmed through another rate cut, the momentum could spill over into Bitcoin and provide the strength needed to form a technical reversal structure—very similar to the inverted Head and Shoulders (H&S) pattern observed in 2024.
Trading Strategy
Entry Zone: 111,906.44
Stop Loss (SL): 108,607.83
Take Profit (TP): 130,383.16
Nasdaq looking downtoday as seen in the video, we are looking for a short.
yesterday showed a lot of rejection to the upside so maybe today we see the market test levels to the down side.
entry in blue.
stop in red
target in green
Elektra

What Could Derail the Nasdaq 100 Uptrend?The chart shows the US100 (Nasdaq 100, daily timeframe) extending its bullish momentum within a rising channel. Here’s the breakdown:
Trend & Structure:
The index has been in a steady uptrend since rebounding from its April lows, with price action respecting the boundaries of the ascending channel. It remains above both the 50-day SMA (23,416) and the 200-day SMA (21,481), confirming strong bullish structure.
Support Levels:
The lower channel boundary around 23,500 is immediate dynamic support.
The 50-day SMA provides further backing below that.
A key horizontal support is at 21,150, near the 200-day SMA, which marks the broader trendline base.
Resistance Levels:
The upper channel boundary near 24,500 is the immediate resistance.
A breakout above this region could extend gains toward 25,000, the next psychological target.
Momentum Indicators:
MACD remains positive, confirming upward momentum.
RSI (68.7) is approaching overbought levels but still has room before signaling exhaustion.
Outlook:
The Nasdaq 100 remains firmly bullish, with higher highs and higher lows supporting the trend. While the RSI hints at stretched conditions, momentum remains strong, and as long as price holds above 23,500, the path of least resistance points toward 24,500–25,000.
-MW

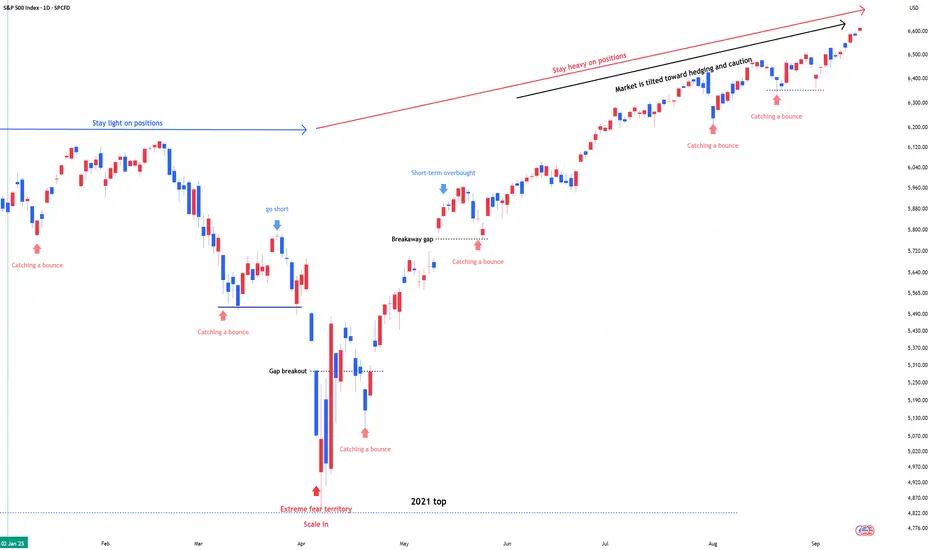
SPX & NDX : Stay heavy on positionsSPX & NDX : Stay heavy on positions (2x leverage)
- Market slowly shifting from sidelines to risk-on.
** This analysis is based solely on the quantification of crowd psychology.
It does not incorporate price action, trading volume, or macroeconomic indicators.
A Tolled BellThe first bell has rung. A bridge is being paved across the $6000 range.
IF it blows up, it likely won't happen until the bridge is constructed and sentiment improves. Expect a few heartfelt endeavors to shoot above $6,660. Base case is long term crab market.

NAS100 Pullback into Fibonacci Zone: Watching for Bullish Break📊 NASDAQ 100 (NAS100) Update 📊
The NAS100 is in a strong bullish trend 🟢📈, clearly visible on the 4H chart ⏰ with consistent higher highs and higher lows 🔼🔼.
Currently, price has pulled back 🔽 right into my optimal entry zone 🎯 based on the Fibonacci retracement 🔢. From here, I’ll be watching closely for a bullish break of structure (BOS) 🔓 on the 15M timeframe ⏰ — that would be my signal to look for a long entry 🚀.
⚠️ This breakdown is educational only and not financial advice. 📚

NASDAQ Approaching a critical +1 year Resistance.Nasdaq (NDX) is close to hitting our 24500 bullish target, which as we explained on our previous analysis represents a +6.78% rise, the technical Bullish Leg of the Channel Up that started back in mid-May.
This pattern is however headed towards a +1 year Resistance level, the Higher Highs trend-line that started on the July 11 2024 High. Technically, we should be expecting a rejection there and pull-back towards at least the 1D MA50 (blue trend-line), if not the 1D MA100 (green trend-line), which is where an identical Channel Up in 2024 that topped on December 16 2024, found Support at.
Even the 1D RSI sequences among the two patterns look similar. As a result, there are high probabilities to see a short-term correction there, which will in turn fuel the end-of-year rally. Our new medium-term Target is 25000.
-------------------------------------------------------------------------------
** Please LIKE 👍, FOLLOW ✅, SHARE 🙌 and COMMENT ✍ if you enjoy this idea! Also share your ideas and charts in the comments section below! This is best way to keep it relevant, support us, keep the content here free and allow the idea to reach as many people as possible. **
-------------------------------------------------------------------------------
💸💸💸💸💸💸
👇 👇 👇 👇 👇 👇

2000 vs 2008 vs 2022 - Are we yellow?Where do you think we are? Red? Or Green?
Are we at a bottom before we see a blow-off top coming?
Or are we in recessionary beginnings like 2008?

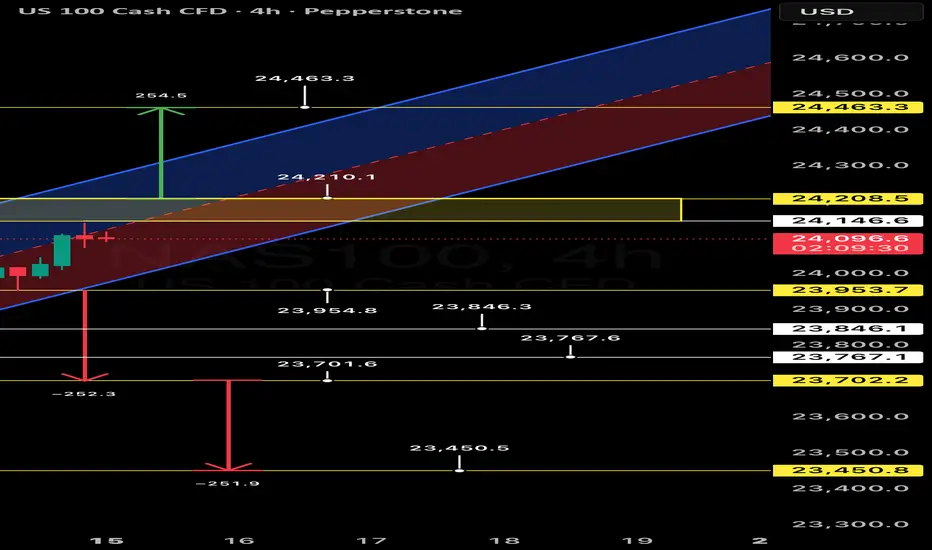
NASDAQ 100: A Tipping Point on the 4H ChartKey Takeaway
NASDAQ 100 (NAS100) is at a critical juncture, hovering at a potential inflection point around the 24,000 level. A clear breakout above or breakdown below this psychological and technical area will likely dictate the next major move for the index, presenting distinct opportunities for both bulls and bears.
Macro View
NASDAQ 100 has been in a strong rising trend channel for the medium to long term, indicating persistent investor optimism. The overall technical outlook remains positive. However, recent price action on the 4hour chart suggests a period of indecision, with the index consolidating just below its recent highs. This consolidation, combined with the emergence of a potential head and shoulders pattern, signals that a significant move is imminent.
Bearish Outlook: A Breakdown Scenario
A breakdown below the key support level at 23,800 would be a significant bearish signal. This level is crucial as it marks the lower boundary of the current consolidation zone.
• Target 1: 23,700 A move below the first key support could quickly see the index test the 23,700 level, which has acted as a previous point of interest.
• Target 2: 23,450 A break of the 23,700 support would confirm a deeper correction, with the next major target being 23,450. This level coincides with a significant volume node and previous support, making it a strong magnet for price.
Risk Management: A stoploss should be placed just above the resistance to mitigate risk in a false breakdown.
Bullish Outlook: A Breakout Scenario
The bullish case is contingent on the index successfully holding the 24,000 psychological level and breaking above the key resistance at 24,208.5.
• Target 1: 24,463 A confirmed breakout would likely propel the index toward the upper boundary of the rising channel, with a primary target of 24,463. This level represents a key extension of the current trend.
• Target 2: 24,600 A decisive move beyond 24,463 would suggest a continuation of the bullish momentum, with a secondary target at 24,600. This level aligns with a major extension and could see the index set new all-time highs.
Risk Management: A stop loss should be placed just below the support to protect against a trend reversal.
Conclusion
NASDAQ 100 is at a pivotal moment. Traders should watch for a clear break in either direction before entering a position. The 24,000 level is a critical pivot, and the ensuing price action will provide a clear roadmap for the market's next move.
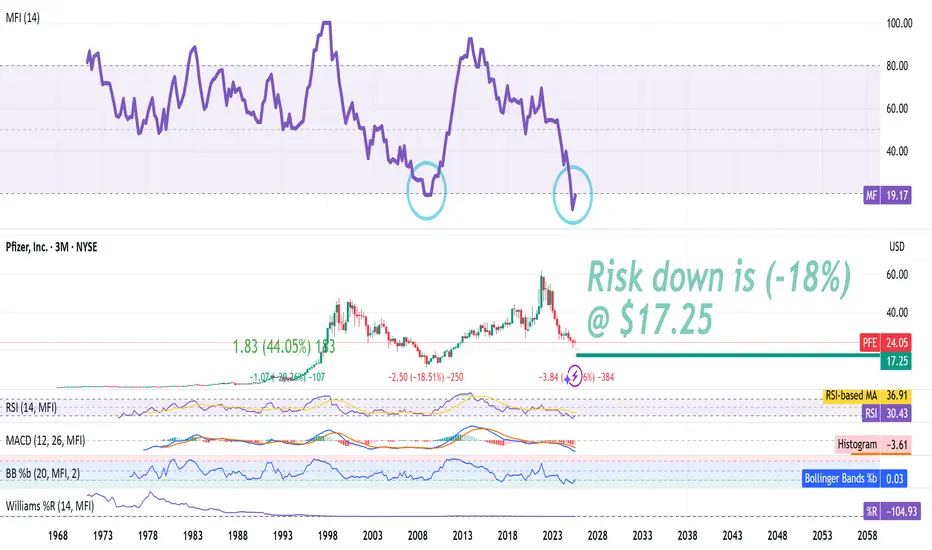
PFE is forming a trough no questions asked! 3Ms is so oversold !Using only the Money flow index is dangerous game do your own analysis!...
The Money Flow Index (MFI) is a technical indicator that uses price and volume to identify overbought or oversold conditions in a security, similar to the Relative Strength Index (RSI) but incorporating volume data. It's a momentum oscillator ranging from 0 to 100, with readings above 80 often suggesting an overbought market (potential sell signal) and readings below 20 indicating an oversold market (potential buy signal). Traders use the MFI to confirm price trends, identify divergences (warnings of trend reversals), and gauge investor conviction behind price moves
NAS100 Trend Analysis: From Higher Highs to a Potential Shift📊 NASDAQ 100 (NAS100) Analysis 📊
Someone recently asked me to cover the NAS100 🤔 as price action can look a little confusing right now. On the 4H chart ⏰, we’ve been trending strongly 🟢📈 throughout the week. However, as we head into the end of the week 📅, things are starting to shift.
Zooming into the 30M timeframe 🔍, price action is showing early signs of weakness ⚠️. We’ve had a high, then a higher high ⬆️, and now a lower high 🔽 — instead of a continuation of higher highs.
In the video, we take a deep dive 🎥 into market structure 🏗️, price action 💡, and the trend 📊, highlighting what to watch out for as institutions and big players wind up or unwind positions 💼 into the week’s close.
💬 Your thoughts and comments are welcome!
⚠️ This is educational only and not financial advice. 📚

S&P | 30min Double Top | GTradingMethodHello Traders 👋
🧐 Market Overview:
The S&P has been pushing into new highs, but a potential double top is forming right at diagonal resistance. This is a key level for me — the confluence of structure and resistance makes this an area worth watching closely.
If the double top holds, price might first deviate through my entry range and then retest the diagonal resistance. For me to take a short, I’ll be looking for a 30-minute candle close back within the range as confirmation.
📊 Trade Plan:
RR: 3.5
Entry:6 537.4
Stop Loss: 6 543.8
Take Profit 1 (50%): 6 515
Take Profit 2 (50%): 6 511
💡 GTradingMethod Tip:
When trading double tops, I always wait for confirmation (like a close back within range). It reduces false entries and adds probability to the trade.
🙏 Thanks for checking out my post!
Follow me for more setups and let me know — do you think this double top will hold, or will the S&P push through resistance to fresh highs?
📌 Disclaimer:
This is not financial advice. This content is to track my trading journey and for educational purposes only.
