NEAR USDT Double Top Pattern in PlayNEAR USDT Double Top Pattern in Play
On the daily chart, NEAR/USDT has formed a clear double top pattern. Alongside this, a bearish divergence has also developed, suggesting weakness in upward momentum. At the moment, price is sitting near the key support zone around 2.3.
Support at 2.3 and the Bounce Possibility
If NEAR manages to hold this 2.3 support, a bounce could follow toward the 2.85 resistance area. This zone will act as a critical decision point. A rejection here would likely confirm the double top pattern and bring back selling pressure.
Break of 2.3 Could Lead to 1.8 Retest
On the flip side, if the 2.3 support fails, the double top comes into full effect, and NEAR could slide further down to the 1.8 area, where it has found strong support in the past. Until then, the focus remains on whether the current bounce can push through 2.85 or not.
NEARUSDT

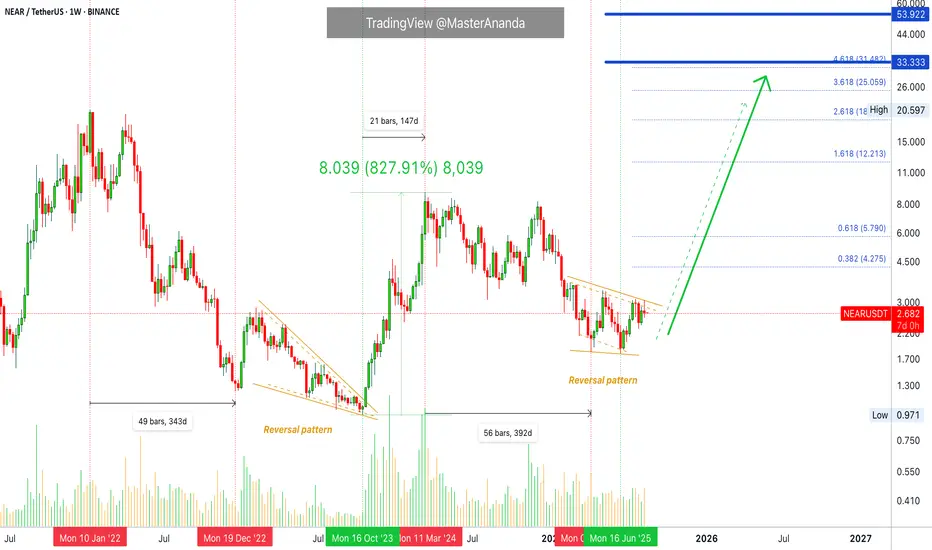
NEAR Protocol 2025 All-Time High & Technical AnalysisNEARUSDT previous all-time high happened January 2022. A year long bear market produced a reversal pattern between 2022 and 2023. This reversal pattern produced a 828% strong bullish wave between October 2023 and March 2024, 147 days.
The same dynamics are now present on this chart. NEARUSDT peaked March 2024 and started a very strong bear market. Between March 2024 and April 2025 we have 392 days. I am using the first low to match the 2022 bear market.
A reversal pattern is now present on the chart, same as 2022-2023. Here is the sequence:
1) Bullish wave.
2) Bear market (long-term correction).
3) Reversal (consolidation) pattern.
4) New bullish wave.
This chart looks similar to LINK but before the bullish breakout. What one does, the rest follows.
NEARUSDT is looking good. The last four weeks have been neutral. Here is another hidden signal. NEARUSDT closed four weeks but there is basically no change in price; more consolidation.
Four weeks and the action continues to happen at resistance. The local resistance of the reversal pattern.
From here on we can see a strong bullish advance. You can look at the pairs that are moving ahead such as XRP, ETH, ADA and BTC. All these hit a low in April followed by a bounce. Then another low in June followed by strong growth.
NEAR Protocol is bullish long-term. The bullish cycle for this project started October 2023. The recent low in June 2025 is a long-term higher low and we are about to experience a long-term higher high; a new all-time high.
Namaste.
NEAR Breakout Watch – Testing Red Resistance!🚨 CRYPTOCAP:NEAR Breakout Watch – Testing Red Resistance! 🔴⏳
CRYPTOCAP:NEAR is testing the red resistance zone.
📊 If a breakout confirms, price could target:
🎯 First Target → Green line level
A successful breakout may trigger bullish continuation.

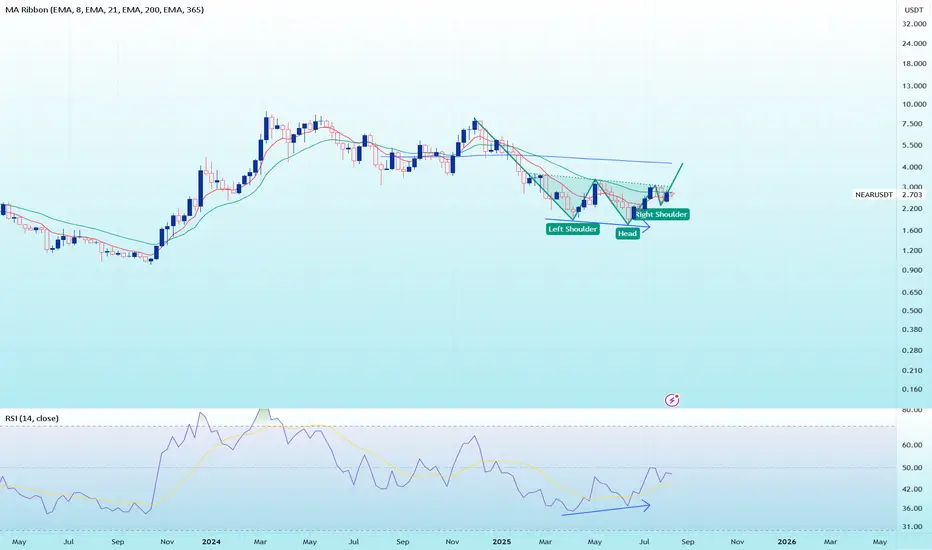
From Daily Users to Price Targets: Why NEAR Might Be FinanciallyIn terms of daily active users, Near Protocol CBOE:NEAR just overtook Solana, hitting the 3 million user milestone and ranking second among the leading Layer-1 blockchains. With some predicting a price objective of US$10.82, a potential upside of almost 315% from its present price (~US$2.61), many experts believe NEAR is substantially undervalued. The spike in interest in NEAR on Google Trends also reflects positive sentiment, increasing the likelihood of fresh inflows from individual investors.
Based on the weekly chart, an inverted head and shoulder and a bullish divergence were spotted, therefore we're looking for a reversal momentum from Near Protocol to a bullish trend for the upcoming weeks.
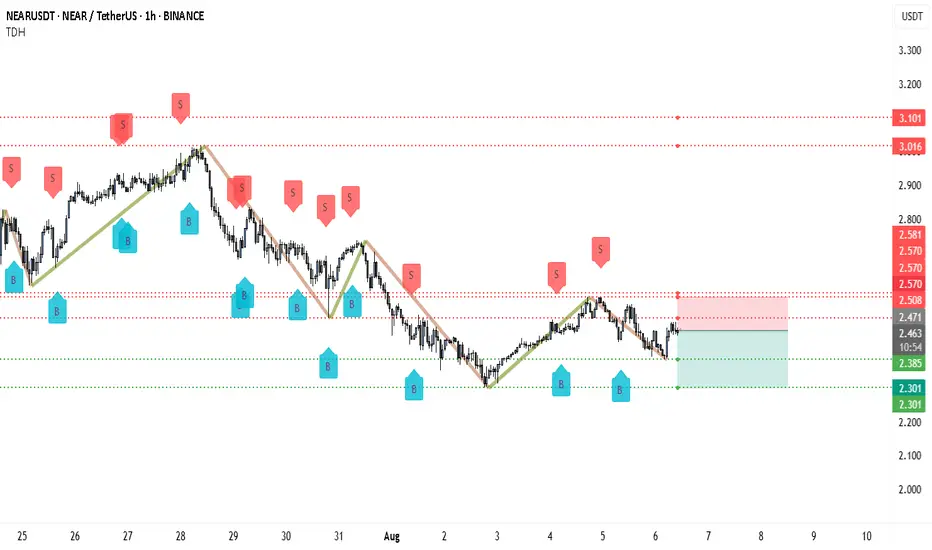
From $2.47 to $2.20 — Is NEAR Headed for a Sharp Selloff?NEAR is currently facing heavy selling pressure after failing to break above the $2.508–$2.570 resistance zone. This zone has acted as a strong supply area, with multiple “S” sell signals appearing here in recent sessions. The rejection from this level aligns with the broader downtrend structure that has been in place since July 29.
Price is now hovering just below the $2.471 level, which is acting as immediate resistance. A decisive rejection here is likely to trigger further downside toward the $2.385 support. If sellers maintain momentum, the next bearish targets will be $2.301 and potentially the $2.200–$2.150 zone on an extended move.
The market structure remains in a pattern of lower highs and lower lows, and the recent rally appears to be a corrective move rather than a trend reversal. Unless NEAR can close strongly above $2.570, the dominant trend remains bearish.
Trading Setup
• Entry: Around $2.470–$2.500 on rejection confirmation
• Stop-loss: Above $2.570
• Take-profit 1: $2.385
• Take-profit 2: $2.301
• Extended Target: $2.200–$2.150 if selling accelerates
• Risk-Reward: Around 2.5:1
Risk Caution
While the setup favors the downside, NEAR can experience sharp short-covering bounces. Traders should consider booking partial profits after a drop of around 100 pips in their favor to protect gains and reduce exposure to sudden reversals.
NEAR Swing Long Idea - Altseason 2025📌 Fundamental Sentiment:
The entire crypto market is rallying, alongside other risk assets. This is mainly driven by U.S. policy expectations — Trump is pressuring Powell to resign and aggressively pushing for rate cuts from the Federal Reserve.
📌 Technical Analysis:
NEAR has recently broken and closed above a significant HTF support/resistance level.
Additionally, we’re now trading inside the 0.75 Fibonacci retracement level of the HTF bullish trend — which I define as the maximum discounted zone.
For this setup, I’ll apply my Deep Range Theory (DRT):
If price dips below the 0.75 zone and accumulates there,
Then breaks above 0.75 after a period of consolidation,
→ It signals that price aims for the 0.5 level of the range and will likely run HTF liquidity for either reversal or re-accumulation before continuation.
📌 Gameplan:
✅ Break and close above HTF S/R
⏳ Waiting for break and daily close above 0.75
🔄 Retest to LTF demand (4H–1H)
📈 A bounce on LTF demand will trigger the long setup
📌 Trade Management:
This is a mid-term swing trade, as I’m following the HTF bullish trend.
🎯 Target: $5 — which is approximately a +70% move from current price.
❗Risk Management:
If price makes a daily close back below 0.75 after breaking and closing above, I will exit the trade to preserve capital.
I’ll also monitor macro sentiment closely. If there's a sharp bearish shift, I may consider an early exit before reaching the HTF target.
—
🔔 Follow the channel for daily trade ideas & weekly macro recaps.
💬 Drop a comment below if you have any questions or insights!

#NEAR Update #2 – July 15, 2025#NEAR Update #2 – July 15, 2025
As seen on the chart, these are the positions I previously opened on NEAR. I didn’t use any stop-loss. Instead, I added to my position when the price dipped slightly, which allowed me to lower my average entry price.
Currently, the targets are clearly defined on the chart. I still do not plan to use any stop-loss, as I have available balance to add further in case of a drop. Those interested in evaluating this setup may consider doing the same.
NEAR has completed the correction phase of both its first and second impulsive moves. Based on this, the current target stands around the $2.78 level.

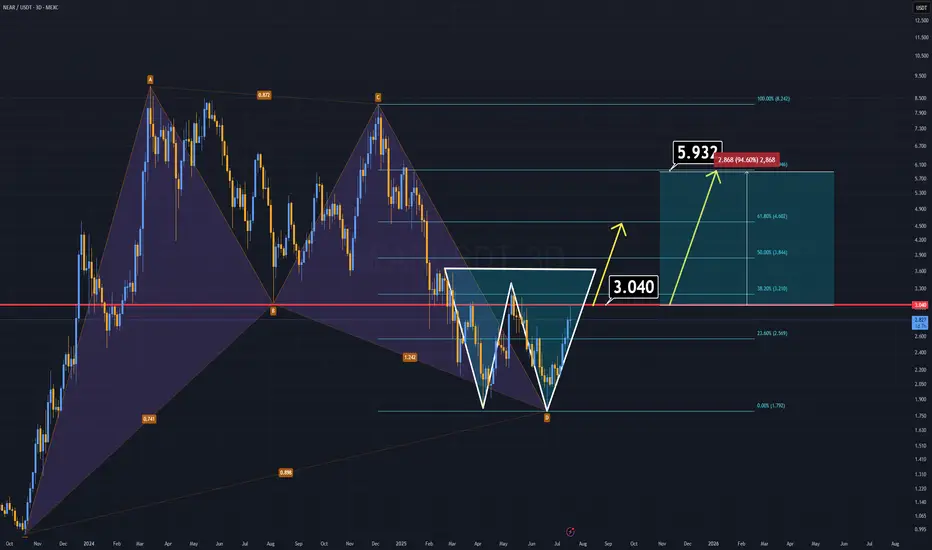
NEAR ANALYSIS (3D)NEAR Protocol has formed two strong bullish patterns and looks ready to climb, especially with the highly anticipated altseason on the horizon.
🔹 A harmonic structure from the previous cycle remains intact.
🔹 A double bottom formation is now clearly developing.
If NEAR manages to close a daily candle above the $3 level, we could see the price double in the short term.
On the fundamental side, NEAR is preparing for a vote to reduce its inflation rate. If the proposal passes, the circulating supply will decrease, potentially triggering a strong bullish run. As a leading AI-focused project, NEAR could spearhead the next wave of AI-related gains in the market.
(Read here for details):
www.near.org
All technical and fundamental signs point upward.
Thanks for reading.
$NEAR Local Still looks corrective..Though the CBOE:NEAR weekly looks good the same pattern on NEAR that I have highlighted here was also found on NYSE:FET and EURONEXT:RNDR local charts that has held these coins back from moving compared to others and appears corrective in nature and they all end at the daily 200EMA on bearish divergence.
Just something to look out for. A rejection in alts now could see fresh lows
Safe trading

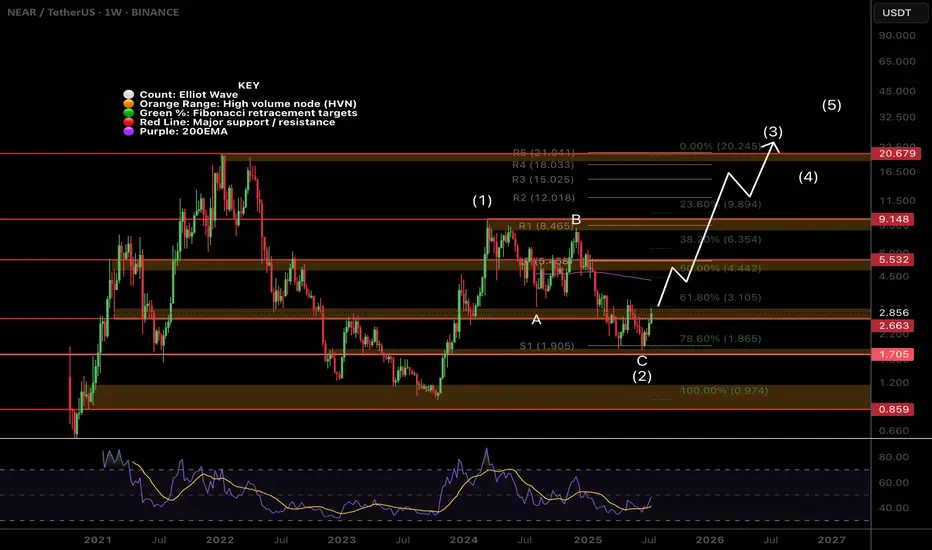
$NEAR Weekly TextBook Elliot Wave!CBOE:NEAR Weekly chart is a great demonstration of the text book motif wave followed by ABC corrective wave.
Bullish divergence has printed on the weekly RSI at the S1 weekly pivot support and the 'alt-coin golden pocket' 0.786 Fibonacci retracement. Price is closing in the major resistance High Volume Node.
The upside target is the newly printed weekly 200EMA followed by the weekly pivot and major resistance HVN just above $5.
A terminal target for this cycle may only see NEAR hitting all time highs around $21, the R5 weekly pivot point.
Safe trading
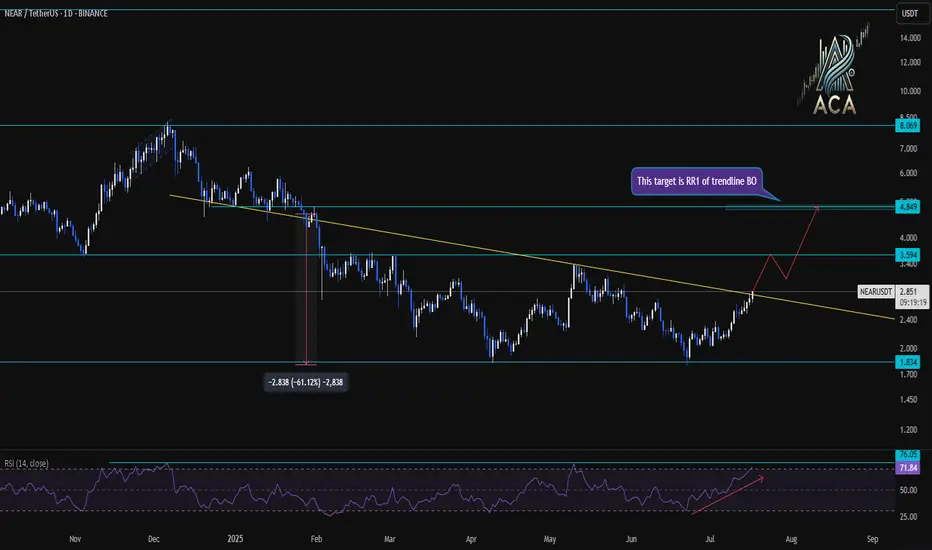
NEARUSDT Daily Chart Analysis|Strong Breakout & RSI ConfirmationNEARUSDT Daily Chart Analysis | Strong Breakout & RSI Confirmation
🔍 Let’s break down the latest NEAR/USDT daily chart, spotlighting critical resistance, target levels, and momentum signals.
⏳ Daily Overview
NEAR has confirmed a bullish breakout above its long-term descending trendline. This move comes with a surge in price and a strong daily candle—clear evidence of renewed bullish momentum.
📊 Momentum & RSI
RSI has surged to 76 (overbought zone), higher than the typical overbought level of 70. This spike reflects strong buying pressure, but also signals the possibility of near-term pullback or consolidation.
RSI-Momentum Convergence: The RSI uptrend is in lockstep with price action, confirming that bullish momentum is genuine and backed by increasing strength—not a divergence.
🔑 Key Levels
- First Resistance: $3.59—watch this closely as the next hurdle for bulls.
- Breakout Target: $4.85, which corresponds to the measured move (RR1) from the trendline breakout and aligns with the next horizontal resistance.
- Extension Target: $8.01 if momentum persists and price sustains above $4.85 in the coming weeks.
📌 Highlights
- Clear trendline breakout validated by strong RSI convergence.
- RSI has entered the overbought zone (76), backing momentum—watch for either breakout follow-through or brief cooling.
- Key levels: $3.59 (first resistance), $4.85 (breakout target).
🚨 Conclusion
Momentum is with the bulls after the breakout. Eyes on $3.59 as the near-term test; a clean move above opens up $4.85 and potentially $8.01 if momentum continues.
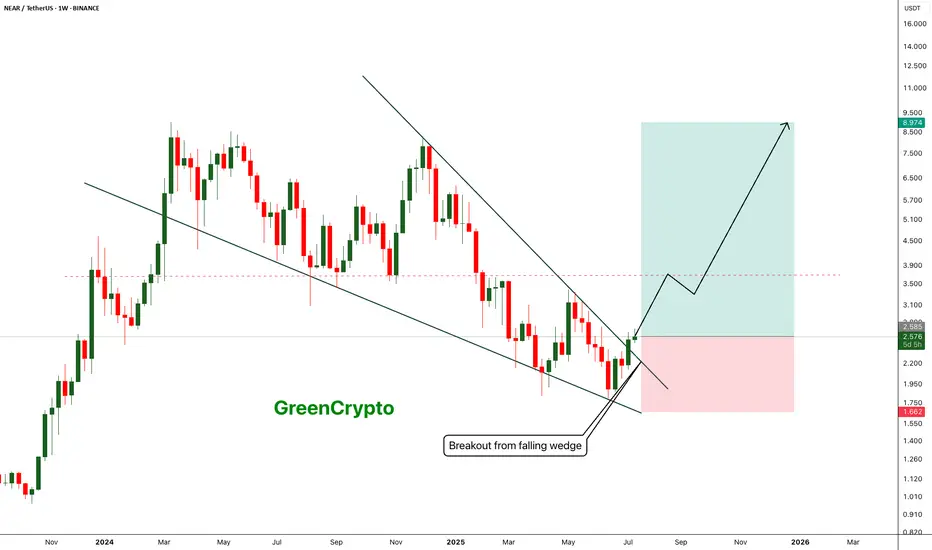
NEAR - Breakout from falling wedge pattern- Near has successfully broken out from the falling wedge pattern and now heading towards the next minor resistance around 3.6 range
- breakout from the minor resistance should push price towards the 9$ range
Entry Price: 2.57
Stop Loss: 1.66
TP1:2.935
TP2: 3.256
TP3: 3.986
TP4: 5.461
TP5: 7.102
TP6: 8.948
Stay tuned for more updates.
Cheers
GreenCrypto
NEAR Breakout Confirmed—But Is This Just a Bull Trap?Yello Paradisers! Did you see that breakout on #NEARUSDT? After weeks of consistent lower highs and a clearly defined descending resistance, price action has finally snapped that bearish structure and completed a textbook inverse Head and Shoulders formation on the 12H chart. This kind of pattern doesn’t appear often at key cycle points, and when it does—especially with confirmation—it becomes a high-probability signal of a trend reversal.
💎#NEARUSDT ,The neckline of the inverse H&S, sitting around the $2.17–$2.23 zone, has now been broken and crucially retested as support. This means the former resistance is now acting as a probable base for bulls, and if price remains above this area, the market is likely preparing for a strong probable impulsive move to the upside.
💎The structure shows clear bullish intent, and from a technical perspective, the first resistance comes in at $2.72. A clean break above that could open the door toward the major resistance zone between $2.97 and $3.05, which would complete the projected breakout target of the H&S pattern.
💎If bulls manage to maintain control above the $2.17–$2.23 support zone, we expect price to slowly build momentum toward $2.72, with increased volatility likely once that level is tested. Should that break occur with volume, the next leg may extend rapidly into the major resistance zone. However, if price fails to hold above this flipped support zone, we will be closely watching the $2.02–$1.89 area as the last major support before invalidation.
💎A daily candle closing below $1.798 would invalidate this entire bullish thesis and put the market back into a neutral-to-bearish range.
💎Adding more probability to this setup, NEAR is now trading above multi-timeframe EMA on higher time frame. This multi-timeframe EMA alignment supports bullish continuation, as momentum begins to shift in favor of buyers. However, continuation depends heavily on how price reacts at each resistance level—especially as we enter the mid-$2.70s.
💎The probable move from here is bullish, with the expectation that NEAR pushes toward the $2.72 level in the short term, followed by a potential rally to $2.97–$3.05 if momentum sustains. This scenario remains valid as long as price holds above $2.17, and especially above $2.02. Below that, the structure weakens. Below $1.798, the bullish bias becomes fully invalidated.
This is the only way you will make it far in your crypto trading journey. Stay sharp and patient, Paradisers. It’s not about chasing pumps—it’s about positioning smartly before the crowd.
MyCryptoParadise
iFeel the success🌴

NEAR Protocol New All-Time High & Targets (PP: 1,108% Minimum)Here we have the same signal we just looked at in another publication, a break and close daily above EMA55 & EMA89. The bullish bias is confirmed.
The blue dotted line stands for EMA89 while the magenta one is EMA55. Once the action moves above daily, mid- to long-term growth is confirmed. Mid-term bullish above EMA55 and long-term bullish above EMA89. Near Protocol is bullish now.
NEARUSDT Technical analysis
On the main chart above we can see a peak March 2024 and a lower high in December of the same year. This means very strong, prolonged bearish action. After a strong bearish cycle comes a strong bullish cycle, the market tends to fluctuate, always fluctuating between bear and bull.
When the market is down, no need to worry because it will eventually grow.
When the market is up for a long while, watch out because a correction can develop anytime out of nowhere.
The cycles repeat over and over, again and again; forever, just like night and day. Winter, summer, spring and fall, the seasons. Everything in nature is cyclical, the market is no exception. We can use this information to our advantage, we know for certain that we are now entering a major growth phase because of the cyclical nature of the market.
The next high will be a major high compared to March 2024, and possibly a new all-time high compared to April 2022 which is the highest level on this chart. If you want to see bigger projections, go to my profile and search for NEARUSDT. You will find there everything you need.
NEAR Protocol new all-time high & targets
The first target is $12 for 368% profits potential. I don't count $5.77 because that is one of the easy targets. It is a shame to sell too early when prices are going really high-up. The $12 target would be the highest price in more than 3 years, since May 2022. This is the first higher high but not the end, the market is very likely to move higher, much higher.
The next target $18.6 for 615% profits potential. This is a good target to start. We then have $25 and $31 for a maximum of 1,108%. We should hit all of these targets within the next 6 months (6-8 months to be safe).
Patience is key. Buy and hold.
Thanks a lot for your continued support.
Namaste.

#NEAR Update #1 – July 10, 2025🔴 #NEAR Update #1 – July 10, 2025
Near started a new impulsive move after the previous one, but this move isn’t significantly higher. It’s almost at the same level. Therefore, unless this impulsive move reaches the $2.45 zone, we cannot consider it strong.
If NEAR rises to the $2.45 zone, we can call it a strong impulsive move. But if it fails to do so, I expect a pullback of around 5–6%. There is also an imbalance supporting this retracement.
If the price fails to reach the $2.45 zone, there is a likelihood of a pullback towards the $2.22 zone. This is not a long or short recommendation.
NEAR/USDT – Breakout in Progress? Watch This Zone CloselyNEAR is attempting to break out of a long-standing descending triangle. After a previous fakeout near the $2.70 zone, the price is again testing the upper trendline with strong momentum.
Chart Overview:
Price crossing the resistance of the descending structure.
Strong support held at $2.01 and $2.24 zones.
Volume is gradually increasing on breakout attempts.
RSI pushing higher, indicating building bullish momentum.
Trade Setup (on Break & Retest):
Entry: Wait for breakout and retest around $2.24–$2.28 zone
Stop Loss: Below $2.01
Targets:
Target 1: $2.44
Target 2: $2.70
Target 3: $2.97
Risk-Reward Estimate:
Approximately 2.5–3.5x RR depending on retest depth.
If NEAR reclaims $2.44 with conviction, this could trigger a sustained move toward $3+.
Watch BTC stability before entering.
DYOR | Not financial advice

TradeCityPro | NEAR Faces Resistance in Lower Range Zone👋 Welcome to TradeCity Pro!
In this analysis, I’m going to review NEAR, one of the AI and Layer1 crypto projects, currently ranked 35 on CoinMarketCap with a market cap of 2.77 billion dollars.
📅 Daily Timeframe
On the daily chart, NEAR has formed a large ranging box between the 1.884 and 3.548 levels and is currently positioned in the lower half of that range.
✔️ After hitting the lower boundary, the price has formed a trigger around the 2.279 level and is now fluctuating below it.
✨ A breakout above this level could give us a long entry. However, the downside is that volume is decreasing and diverging from price. If this volume drop continues, the likelihood of the range breaking to the downside increases.
📊 If volume starts to rise, considering that the RSI is stabilizing above the 50 zone, the probability of a bullish scenario becomes much stronger.
💥 The main resistance above the current price is at 3.548, which I’ve marked as a zone. In my opinion, breaking this level would be the main trigger for a spot buy, and I personally plan to wait for this level to break before buying spot.
🔔 If the price gets rejected from the 2.279 level and bearish momentum enters the market, a break below 1.884 would be a strong short trigger and could signal the start of a new bearish leg and continuation of the previous downtrend.
📝 Final Thoughts
This analysis reflects our opinions and is not financial advice.
Share your thoughts in the comments, and don’t forget to share this analysis with your friends! ❤️

$NEAR Disappointing so far...CBOE:NEAR is disappointing me as it continues towards the lows
Testing the .786 alt-coin golden pocket High Volume Node so should see a decent reaction from here as it appears a an ABC correction is complete after an Elliot wave motif wave.
Safe trading

NEARUSDT Breakout Watch Descending Triangle Reversal in Progress🧠 Pattern and Structure Analysis
The NEAR/USDT pair is currently displaying a long-term Descending Triangle pattern that has been developing for over 6 months. While descending triangles are typically bearish continuation patterns, a breakout to the upside often signals a strong trend reversal.
Descending resistance trendline: Multiple touchpoints confirming the structure.
Horizontal support zone: Strong base formed between $1.79 – $2.21.
The current price action shows a potential breakout above the descending resistance, indicating a possible shift in trend.
🚀 Bullish Scenario
If the breakout is confirmed (especially with high volume and daily close above the trendline), NEAR could rally toward the following resistance levels:
1. Target 1: $2.693 – minor resistance
2. Target 2: $3.021 – key psychological and technical level
3. Target 3: $3.568 – previous support/resistance flip
4. Target 4: $4.635 – major resistance zone
5. Extended Targets: $6.028 and $8.062 – historical highs
📌 Breakout confirmation requires a daily close above $2.25 with increased volume.
🐻 Bearish Scenario
If the breakout fails and the price gets rejected at the trendline:
Price may revisit the strong support zone around $1.79.
A breakdown below this support would open the door to deeper downside levels, possibly below $1.70 or even toward $1.50.
The bearish outlook would be invalidated if the price sustains above $2.30 and forms a higher-high structure.
🔍 Strategic Summary
Pattern: Descending Triangle (Potential Reversal)
Breakout Level: ~$2.25
Key Support: $1.79 – $2.21
Recommendation: Watch for a confirmed breakout with strong volume. Use a trailing stop strategy to lock in profits as targets are reached.
#NEAR #NEARUSDT #CryptoBreakout #AltcoinSeason #DescendingTriangle #TechnicalAnalysis #CryptoTrading #BullishSetup #ReversalPattern #ChartPattern

NEARUSDT 1D AnalysisNEAR ~ 1D Analysis
#NEAR Buy back on retest of this support block with short term target of at least 15%+ from here.

YOLO Near USDT is a stellar buy here HUGE UPSIDELast cycle we saw a large correction to these levels before seeing a huge altcoin season. I believe we will see another run this cycle.
Near is a entry between $1.90 and 1.60.
Sell targets 8 20% sell
$12 20% sell
$16 20% sell
$20 20% sell
20% sell: Let it rideeeee to euphoria

Descending Channel Breakout Ahead for $NEARUSDTCBOE:NEAR is trading in a descending channel on the 6H chart.
After bouncing from $2.140 support, it’s showing signs of a short-term recovery, with a target of $2.50, 13.40%.
MACD crossover supports bullish momentum.
Holding support is key, or the downtrend continues.
DYRO, NFA

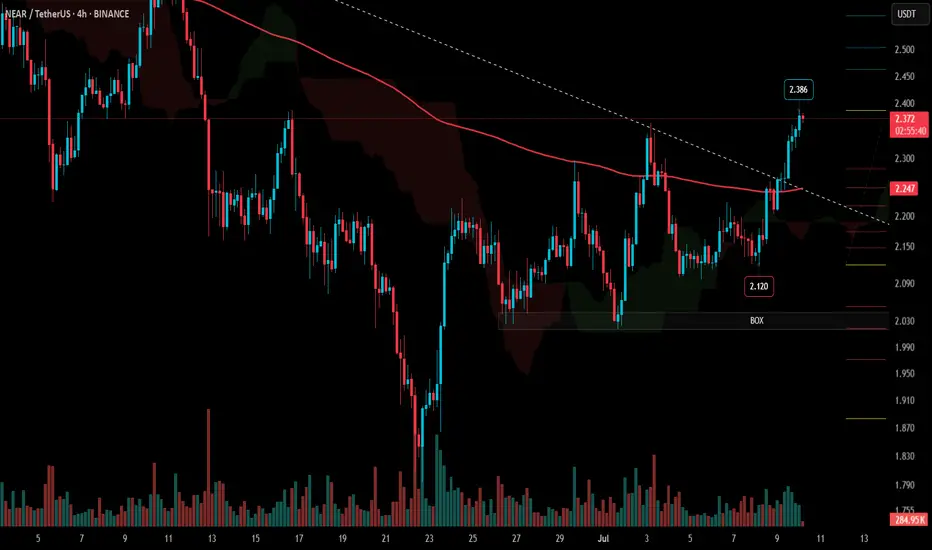
Breakout Watch: NEAR Approaching Moment of Truth If you want, ICBOE:NEAR is currently testing the breakout zone but is still holding below the key trendline.
It’s a critical spot — if NEAR manages to break and close above this trendline, it could unlock further upside. For now, the trendline remains intact, so patience is needed here.
Watching closely to see if the breakout gets confirmed or if we see another rejection.
DYOR, NFA
