NEO Coin Formed Very Big Shark Pattern And Ready For Big MoveBig wedge:
On weekly chart priceline of Neo coin has formed a wedge and the support of this wedge is at 5.46 dollar. This is really very strong support that is not broken since December 2018. During the recent strong bearish move in the month of March 2020 we have seen that the price action has hit the spike upto $4 but could not break down the support. After placing the volume profile on the complete price action of this wedge as a result we can see that the traders interest is really very low below $6.8 and above $11.70. And the pint of control of volume profile is at $9.30. Therefore when the priceline moved in the area where the traders interest was weak it turned bullish and moved back into the zone where the traders are interested to trade.
Oscillators and indicators:
After hitting the support of this wedge the stochastic oscillator has given bull cross from the oversold zone and the moving average convergence divergence the MACD indicator was strong bearish but now it is turning bullish and if we see the directional movement then it can be exmaniced that the directional indicator 1+ is moving up to form a bull cross with the directional indicator 1- . Once this bull cross will be formed then the price action can turn more bullish to make an attempt to breakout the resistance of this wedge.
Ichimoku cloud:
If we see the ichimoku cloud on weekly chart then it can be observed that the bearish cloud is turned very weak at this time. Therefore it will be easy for the priceline to cross up the cloud. And once the pric line of Neo coin will be able to cross of the bearish cloud then it will be really a very big success for the Neo coin because the Neo coin could not cross up the bearish cloud on weekly chart since it is appeared in the history of this asset. The lagging span has entered in the priceline and once it will cross up the candlesticks then it will be another very strong bullish signal. The conversion line has touched the baseline and soon it will also form a complete bull cross then there will be strong chancess that the cloud will be turned bullish and the price action will cross up the ichimoku cloud. And after crossing up the cloud Neo coin can start a really very powerful bullish rally.
Very big bullish Shark pattern:
Now if we switch to the 2 week chart then it can be easily witness that the price range of NEO coin has completed a bullish shark harmonic patter. And after the completion of this pattern now the price range is moving in the potential reversal zone of this big bullish harmonic pattern. Potential reversal zone is also a buying area and the maximum extent of this potential reversal zone should be used as a stop loss. Now there are strong expectations that as per Fibonacci sequence of the priceline should move up from this area and enter in the Fibonacci projection of C to D leg from 0.382 to 0.786 Fibonacci projection.
The buying and sell zones start and end as below:
Buy between: $7.49 to $5.84
Sell between: $9.73 to $13.81
But if the price line will breakout the $13.81 barrier then it can turn really very strong bullish coz in that case it will also breakout the wedge resistance.
Final thoughts:
At this time all signals are turning bullish but soon they will be turned strong bullish because the Neo coin is already getting bounced from the support of wedge. But we should be careful about the stop loss and the support of the wedge or the potential reversal zone of Shark pattern should be used for this purpose.
Neousdlong

NEO/USDT - a purchase from a key level.a purchase from a key level.
buying from a $10 level.
stop loss for the level.
R/R = 1/15
Push ❤️ if you think this is a useful idea!
Before to trade my ideas make your own analysis.
Thanks for your support!

NEO movement within WedgeMovement within wedge can be seen to respect Fibonacci spirals, will this movement continue with a third up-wave? or will this result in a breakout?
This wedge formed is a falling wedge technically however it is quite horizontal

NEO / U.S. DOLLAR (NEOUSD) Weekly & DailyDates in the future with the greatest probability for a price high or price low.
The Djinn Predictive Indicators are simple mathematical equations. Once an equation is given to Siri the algorithm provides the future price swing date. Djinn Indicators work on all charts, for any asset category and in all time frames. Occasionally a Djinn Predictive Indicator will miss its prediction date by one candlestick. If multiple Djinn prediction dates are missed and are plowed through by same color Henikin Ashi candles the asset is being "reset". The "reset" is complete when Henikin Ashi candles are back in sync with Djinn price high or low prediction dates.
One way the Djinn Indicator is used to enter and exit trades:
For best results trade in the direction of the trend.
The Linear Regression channel is used to determine trend direction. The Linear Regression is set at 2 -2 30.
When a green Henikin Ashi candle intersects with the linear regression upper deviation line (green line) and both indicators intersect with a Djinn prediction date a sell is triggered.
When a red Henikin Ashi candle intersects with the linear regression lower deviation line (red line) and both indicators intersect with a Djinn prediction date a buy is triggered.
This trading strategy works on daily, weekly and Monthly Djinn Predictive charts.
This is not trading advice. Trade at your own risk.


NEOUSD formed bullish BAT | Upto 71% profit possibilityHi guys and gals hope you are well, on 2 day chart the NEO Coin has formed bullish BAT pattern and entered in potential reversal zone to move up.
Lest’s dig the pattern deeper to see how perfect this pattern is formed:
After initial leg (X to A) the A to B leg is retraced between 0.382 to 0.50 Fibonacci and then B to C leg is projected between 0.382 to 0.886 of A to B Fibonacci projection area and last leg (C to D) is retraced between 0.786 to 0.886 Fibonacci and now the price action is moving in potential reversal zone of this bullish BAT and now we can expect bullish divergence at any time which will lead the priceline between 0.382 to 0.786 Fibonacci projection of A to D leg.
Buying And Sell Targets:
The buying and sell targets according to harmonic BAT pattern should be:
Buy between: $9.69 to $8.80
Sell between: $11.83 to $15.05
Stop Loss:
The potential reversal zone area which is up to to $8.80 can be used as stop loss in case of complete candle stick closes below this level.

NEO long term rising wedgeNeo has formed a rising wedge, this is a bearish continuation pattern unfortunately.. However this may lead to an inverse H&S, eventually. Short term profits can be made while price is within the wedge, but overall long term the chart pattern is bearish, however the longer term outlook is pretty bullish if you are a dedicated hodler. Short term a rejection may occur at 50MA.

NEO Symmetrical Triangles?A symmetrical triangle has formed between trendlines on the NEOUSD pair. This is a bullish symmetrical triangle as the first impulse wave was bullish which upon breakout of the triangle will lead to a second wave. A few H&S patterns can also be identified but I haven't listed these as their impact on daily charts is minimal.

NEOUSD Long Enter at 9.19usd.NEOUSD Long Enter at 9.19usd. In the exchange rate, we try to trade the rule that the ATR closes with a symmetric motion of the wave sequence. I've written about this set of rules many times. It is based on the simplest and fastest way to identify a wave amplitude near the ATR closing values when constructing an exchange rate (either). If the same amplitude is obtained for both closing values (long direction, short direction), then it is very likely that an accumulation phase will occur. If the symmetric backtesting theory is correct, the exchange rate may turn north again from 9.19 usd. Then I expect a higher rise to the level of 19.50 usd.

NEOBTC LONGNEO/BTC has insane potential.
Inverse head and shoulders pattern almost formed
Volume is decent.
If it breaks above 0.0014 then it's likely to explode upwards.
Check my other ideas and good luck with your trades.
Not a financial advice, just an idea

NEOUSD - Buy 23/01/2020Friends, please before reading, support this idea with your Like and any Comment, thanks.
You can buy NEOUSD from 10.5-10
Stop-loss at 9.9
You will find more trading ideas in SAV Finance community.

NEOUSD long. TP 13.53 usd.NEOUSD long. TP 13.53 usd. I suppose we see fractal copying. The red narrow square in the analysis is the "spike area". The narrow green blue rectangle indicates the fractal shift. The right side arrow shows the direction of the shift. I see the exchange rate correcting, so I'm waiting for a north turn. The target price for the next wave sequence is 13.53 usd.

NEO/BTC TA Update (Resume Uptrend?)NEO/BTC
NEO broke the downward trend-line resistance coming from the swing high at 1530 sats area. If the daily candle can close tomorrow bullish, I would expect more upside action to retest the swing high levels.
NEO bounces off 2 times at 200 Day MA acting as dynamic support during its strong pullback. This signals us a potential resume of an uptrend again.

NED SHORT in Shortterm TradeHello to all watching my charts.
NEO has nearly double but now
in a pullback phase has fallen below major support level at
11.23 and is now in short mode ONLY in SHORTTIME VIEW
Now we can have an eye on the rendline whether it breaks
also for a bigger pullback or whether it holds to have
a only shorttime pullback.
In longer view we are in LONG mode.
but in the shortime VIEW of NEO in the 1 HR chart
it looks SHORT.
Good trades
If you want to support my work , please be so kind and like them
-
My posts are not and advice to buy or sell something
always do your own research
-
Renkotrade

NEOUSD formed bullish butterfly | Upto 75% expectedPriceline of NEO / US Dollar has formed a bullish butterfly and almost entered in potential reversal zone.
RSI has already visited oversold.
MACD is strong bullish.
Stochastic has given bull cross.
I have defined the targets using Fibonacci sequence.
Buy between: 8.59 to 7.13
Sell between: 9.73 to 12.48
Regards,
Atif Akbar (moon333)

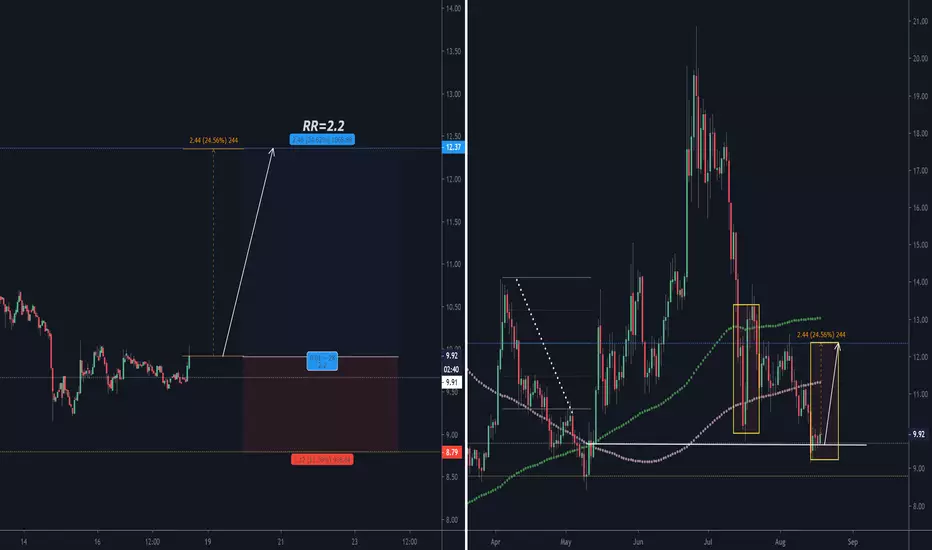
NEOUSD Trading... To the left of the analysis is the 2.2 RR trading. To the right is theory. The current entry point is the intersection of the MA100,200. This is a very strong level. The target price is the 50% ATR axis of the exchange rate movement, which started at a similar level.
NEOUSD has formed gartley | Upto 24% potential tradePriceline of NEO / US DOLLAR has formed bullish gartley and entered in potential reversal zone.
I have defined the targets using Fibonacci sequence as below:
Buy between: 10.63 to 11.34
Sell between: 11.88 to 13.23
Regards,
Atif Akbar (moon333)


NeoUSDT preparing for big move-need big push to break resistance#neo is the biggest laggard among frontline coins. #neobtc is gearing up for a big move soon. Expecting #neousdt to post 112-264% gains in coming months.

NEO/USD TARGET $23.41 (65.25% PUMP ? ) Make sure to take profit at - $16.67
Risk reward: 20.81
Stop loss: $13.72 (-3.14%)

NEOUSD before 30% increase... The exchange went into a rising channel. It is characterized by the axis connecting the rising peaks and the rising ATR axis. Within this, a second wave of a dual waves system can be deployed. If the analysis is correct, another rising wave may develop. The target price is 15.27 usd.

NEO/USD: Crypto-Swing-Trade! What a CHANCE!Hey cryptomaniacs,
welcome to another free signal for the crypto-space!
Instructions: Wait for the Break above the resistance and BUY!
-----------------------------
Type: Swingtrade
Buy-Limit: 10,61
Stop-Loss: 9,76
Target 1: 11,39
Target 2: 11,87
Target 3: 12,59
-----------------------------
LEAVE A LIKE AND A COMMENT - I appreciate every support! =)
Peace and good trades
Irasor
Wanna see more? Don`t forget to follow me.
Any questions? PM me. :-)
