NFLX:If it looks like a bottom. . . ?!!Netflix
Short Term - We look to Buy a break of 210.00 (stop at 158.96)
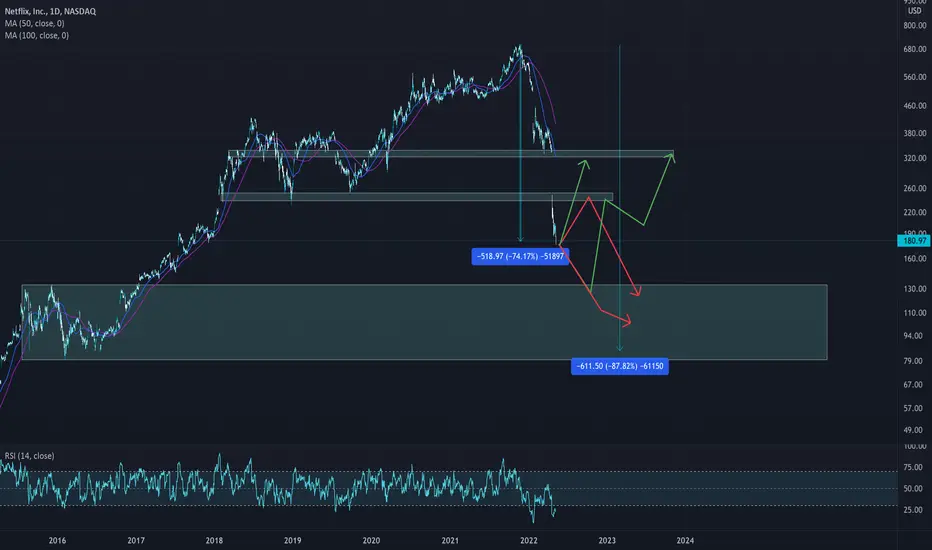
The bullish engulfing candle on the daily chart is positive for sentiment. A bullish reverse Head and Shoulders is forming. This is positive for sentiment and the uptrend has potential to return. Further upside is expected to close the gap between 248.70 and 333.22.
Our profit targets will be 329.00 and 400.00
Resistance: 240.00 / 330.00 / 400.00
Support: 160.00 / 125.00 / 81.00
Please be advised that the information presented on TradingView is provided to Vantage (‘Vantage Global Limited’, ‘we’) by a third-party provider (‘Signal Centre’). Please be reminded that you are solely responsible for the trading decisions on your account. There is a very high degree of risk involved in trading. Any information and/or content is intended entirely for research, educational and informational purposes only and does not constitute investment or consultation advice or investment strategy. The information is not tailored to the investment needs of any specific person and therefore does not involve a consideration of any of the investment objectives, financial situation or needs of any viewer that may receive it. Kindly also note that past performance is not a reliable indicator of future results. Actual results may differ materially from those anticipated in forward-looking or past performance statements. We assume no liability as to the accuracy or completeness of any of the information and/or content provided herein and the Company cannot be held responsible for any omission, mistake nor for any loss or damage including without limitation to any loss of profit which may arise from reliance on any information supplied by Signal Centre.
Netflix

Buy stop!I definitely like that bullish momentum with volume and although it did not dip to my level rather it bounced on the 30m ssb. I will put a buy stop at 198 so that I am only taken in if right and stop 184. The ultimate target is 250 zone but will add and remove as appropriate. The R is 3.58 if I take it all the way up;)

NefliX:Day trade?. . . .which could turn swingTurned mildly bullish on Netflix on 31 May with a tk cross. However the volume was not convincing so today will be doing just a day trade to test my bullish thesis. If successful then my day trade can potentially turn into a swing. On the monthly we had a bullish hammer caused by the monthly lagging failure to cross down the monthly SSB. If this persists then we might have a pullback to the 233-240 zone. The streak of strong bearish months from November means whatever long position should be taken with extreme caution as the overall trend remains bearish and we are attempting to catch knives so to speak.
For the day trade I am targeting the daily kijun zone for a bounce and will be bullish from there with a tight stop. I need to see a good conviction bullish 30min candle bouncing from that red zone or somewhere close to that. The stop will be just below that zone.

Bullish Pattern Indicate A Major Reversal For Netflix Shares.Netflix formed the possible head-and-shoulders pattern between April 26 and May 26, with the left shoulder created over the first seven trading days within the time period, the head over the subsequent eight days and the right shoulder was printed over the eight days that followed. On Tuesday, Netflix retraced slightly lower to back test the neckline of the pattern and held above it.
Netflix’s relative strength index (RSI) has been making a series of higher highs and higher lows, which indicates momentum into the stock is increasing. Netflix’s RSI is currently measuring in at about 43%, which indicates the stock has room to move in either direction before entering into oversold or overbought territory but the indicator is suggesting more upside.
Netflix is trading in a confirmed uptrend, with the most recent higher high printed on Tuesday at the high-of-day and the most recent higher low formed at the $177.17 mark on May 24. Eventually, Netflix will retrace to print another higher low, which could provide an entry point for bullish traders who aren’t already in a position.
Netflix has two gaps above, with the closest gap falling between $248.70 and $333.22. Gaps on charts fill about 90% of the time, which indicates Netflix will rise up to fill the empty trading range in the future, although it could be some time before that happens.
Netflix has resistance above at $200.82 and $212.98 and support below at $186.40 and $178.38.


NFLXNetflix shares have fallen sharply recently due to bad news about the company's users falling
But that reduction is too much, and I expect it to have at least one retreat towards the $ 333 and $ 478 targets.
MACD and RSI indicators are in the floor area and sellers do not seem to be able to reduce the price and the price in the area is between $ 180 and $ 200.

REBOUND TOWARDS $266.7Hello traders, I beleive that NETFLIX is currently pushing up to its last resistance before continuing to drop. After the resistance, my target is $80$

Netflix same drops three times beforeLooking back in history we have seen three similar drops like this one before. And prices have bounced very nicely up from that area.
This is the time the rich get richer, meanwhile the poor get poorer as they close their losses instead of adding more.
I am pretty sure we will go down more but it's still a good opportunity not happening very often.

netflix can go up a littleyou can see where you should buy netflix . just a little long and then sell

NFLX-USD Greetings,
Since ATH, the paper has fallen in price by 75% due to loss of Russian subscribers and a general market correction. There were only two such strong corrections in 2004 by 77% and 2011-12 by 80%. Could the decline continue? I think so, with a rebound and a test of support around $90-130, where the 2015-17 accumulation zone is located.
The company predicts this quarter's drop in subscribers could drop another 2 million, from the current 220 million, due to the unstable world situation and higher US subscription costs.
The company's average monthly returns statistically are January, May, August, October, December. And the weakest months are April and July, the current drop in April confirms this statistic, May has every chance to close better on the rebound.
But fundamentally the company is developing, and the number of users of the service will grow worldwide. For private investors it is worth thinking about several entry points, which would reduce the risk and get a better average price for further correction.
If you liked this article, please like it and subscribe, so as not to miss anything.
Always use STOP, and do not use a leverage higher than x3.
A trader must always have tomorrow.

Are Nasdaq stocks now reasonably priced?Over the past two years, technology companies have enjoyed explosive growth as investors were upbeat about the prospects for the sector at a time when people relied on technology to stay connected while cooped up in their homes.
Internet firms like Zoom Video Communications (NASDAQ:ZM) were among those to reap substantial gains from the tech boom during the pandemic. Zoom’s stock surged to a record $559 in October 2020 around the time that its platform’s usage became ubiquitous for people working at home and regular users that wanted to connect with friends and families.
The confidence in Zoom and other internet stocks like Alphabet (NASDAQ:GOOGL) and Microsoft (NASDAQ:MSFT) fueled a herd mentality that propelled the tech-heavy Nasdaq Composite index to an all-time high in November 2020.
But with concerns about high valuations and interest rate hikes that could lower companies’ future earnings, the Nasdaq has been on a freefall for about half a year now, retreating from its November peak of over 16,000 points to an over 18-month low of just under 12,000 points on Wednesday.
Pandemic favorites lose shine
Zoom, the poster child for 2020, is now trading at less than $90 from its October peak of $559. Netflix (NASDAQ:NFLX), another pandemic favorite, has lost 62% over the past year and 69% year-to-date as of Wednesday, trading at less than $190 after touching an all-time high of $690.31 in October 2021.
The drop in Netflix’s shares comes as the company reported its first quarterly loss of subscribers in over a decade. It lost 200,000 subscribers in the first quarter, which the company blamed on people sharing accounts, among other factors.
Billionaire investor Bill Ackman in April sold his entire stake in Netflix, taking $400 million in losses. His firm, Pershing Square Holdings, said that while Netflix’s business is fundamentally simple to understand, "we have lost confidence in our ability to predict the company’s future prospects with a sufficient degree of certainty."
Valuation worries
The appeal of tech stocks has dimmed in recent months mainly due to high valuation coupled with missed or slowing sales targets. Apple (NASDAQ:AAPL), in October 2021, missed the market’s revenue expectations due to the lingering global chip shortage that has been affecting its iPhone production.
Apple’s price-to-earnings (P/E) ratio, a measure of whether it is over- or under-valued, surged to 35.45 at the end of 2020 before retreating to 28 in the first quarter of 2022. This means that investors are paying $28 for every $1 of the company’s earnings.
The iPhone maker’s current PE ratio, however, is still lower than that of its peers, including Netflix, Amazon.com (NASDAQ:AMZN), and Tesla (NASDAQ:TSLA), whose P/E ratio’s are all above 50.
Most overvalued tech stock
Tesla’s stock price has jumped 26% over the past year, but down 40% year-to-date. Over a month ago, the carmaker joined a growing list of megacap companies to enact a stock split after its shares blew past $1,000 in October 2021. Stock splits make shares more attractive to retail investors but doesn’t change its PE ratio.
Many analysts say Tesla is the most overvalued tech and automotive stock in the market and even its own CEO Elon Musk shared the same view at one point, tweeting two years ago that the company’s stock price “is too high imo.” That tweet knocked 10.3% off Tesla’s stock price on May 1, 2020.
However, some still see the company's current market value as reflective of Tesla’s potential to further expand its dominant position in the electric-vehicle market. In 2021, Tesla held a nearly 14% share of the global EV market, beating rivals Volkswagen, BYD (HKG:1211), General Motors (NYSE:GM) and BMW, among others.
A counter to the recent pessimism
While many financial watchers cast doubt on tech firms’ ability to meet sales targets and justify their high valuations, some say the recent tech sell-off is irrational while remaining upbeat about tech’s future performance especially in the area of new tech trends like big data and artificial intelligence.

Netflix 171% move coming but first...some thoughts. Netflix pulled a squid games, (look up squid games crypto if you're lost) but honestly Netflix shit the bed. But now the beds being cleaned and you can start accumulating in this area $190 - $217 to sell in the mid $500's.
Reasoning: Gap fill at $198 and lots stop losses hit me thinks <$200 and then run up to the top of the Ichimoku cloud on the daily which coincides with ~540.
I'm setting a tight stop just in case of future Ackman scares.

Netflix entry time This point can be considered as the best time to take a long position.
I’m expecting 42% retracement.

Netflix, Inc. - Long tradeEver since it hit a high of 701.0 back in November 2021, Netflix has fallen dramatically to trade at 162.71, its lowest level since August 2017. Looking at the daily chart, a clear 5-wave decline can be seen, pointing to an imminent correction. While we do not rule out small losses still, we recommend to go long at market with a stop at 124.0, targeting 280.0, the 50% retracement of the 5th wave.

NETFLIX HORRIBLE !!! WILL NFLX DROP ANOTHER +10% ¿?DAMN... $NFLX doing so bad :(
Anyway, I think it will recover in the long term (RSI shows undervalued & price dropped so hard) but I don't think ATH will be easy for NFLX anymore... Sorry guys :(
These are my scenarios for Netflix... It could drop more and accumulate there (very possible) or Netflix could recover step by step and accumulate at those levels...
We'll see, I never invested on NFLX but I won't buy stocks this year that's sure. I prefer wait and see what happen next year because this company looks so bad IMO.
REMEMBER ALWAYS #DYOR :)
A corrective bounce for wave B is inevitable for #NFLXTimeframe: Weekly
Price may find bottom to complete the bearish impulsive wave a at 0.236 fibonacci retracement of the previous general motive phase wave 1.
When this level holds and this analysis be validated, price may then resume its corrective bounce for wave b.
#elliotwaveforecast
@marketpainterPH
Visually presenting the basic general representation of the principle of Elliott Wave Theory.

NETFLIX WHERE IS THE BOTTOM?Netflix, Inc. provides entertainment services. It offers TV series, documentaries, feature films, and mobile games across various genres and languages. The company provides members the ability to receive streaming content through a host of internet-connected devices, including TVs, digital video players, television set-top boxes, and mobile devices. It also provides DVDs-by-mail membership services in the United States. The company has approximately 222 million paid members in 190 countries.
Right now Netflix, it seems they reach a saturation of subscribers and even start to lose some.
Quarter 1 report of Netflix came and they lose around 200.000 members worldwide. A worrying shift for a business which sustained growth never interrupted for over 10 years.
This caused by new and strong competition along with the covid restrictions worldwide.
I do not think, income will be problem for now since they cancel productions that seems redundant. They will cut costs.
Also price may have found the bottom already.
This week, investors seems to think this levels are good for buying.
In the "weekly" chart, price hit the bottom of Bolinger Bands with the RSI below oversold area. MACD is in the deep negative zone with going deeper. If selling pressure stops for the next couple of weeks MACD line will probably cut the Signal line which means buy if we are still near bottom of Bolinger Band.
Important support levels
190 is highly important as price seems to bottom there this week.
180 if 190 cant hold it.
These levels can be considered as stop loss zones.
Important resistance levels
203
210
221
240
262
These levels can be seen as take profit zones.
Thanks.
Follow for more charts and ideas.

NETFLIX : Weekly Buy zoneNETFLIX / Weekly
Netflix is crashing due to the earnings Announcement. Can $NFLX bounce from its Multi-Year Trendline?
Lets wait and See. BTW, Just "Netflix and chill" Guys...

Netflix - It's time for a comeback! 😎After the published reports of Netflix, its shares have already fallen by 47%, due to a decrease in the number of active subscriptions.
Since then, Netflix has given away a huge number of free subscriptions, some of which will soon be converted to paid ones and the company will be able to regain its positions.
Also, from a technical point of view, we have an excellent gap that needs to be closed.
What do you think of this idea? What is your opinion? Share in the comments📄🖌
If you like the idea, please give it a like. This is the best "Thank you!" for the author 😊
P.S. Always do your own analysis before a trade. Set a stop loss. Fix profit in parts. Withdraw profits in fiat and please yourself and your loved ones

NFLX (Netflix) expected correction to 150 before bullishWith this wave ((4)) retraces to the fib ratio of ((2)) and ((5)) can continue upwards
Quite some confluence in this chart
Overall indicies are also correcting for a few more weeks and are also in a ((4)) correction

Netflix Going Long after correction phaseHello Traders!
Here is the most possible scenario for Netflix on the next weeks.
Netflix Now in a correction phase and After NFLX Break 3 Important High Low, i expect Netflix To Be retracement from the red rectangle as buying zone
Let Me Know In The Comment Section Below If You Have Any Questions

Netflix, LONG!Hello Traders, here is the full analysis for Netflix , let me know in the comment section below if you have any questions.
The ellipse could represent a possible zone with good risk/reward to accumulate long position.
Please note that all the information and publications hera are not meant to be, and do not constitute, financial, investment, trading, or other types of advice or recommendations. What you will find here, are only views of a Cat passionate about Finance.

Netflix needs to chill... lolLooking at both Fibs the 61.8% level is being breached.. could spell disaster for all you netflix holders...
