Netflix – Trend Reversal and Impulsive Setup#Netflix – Trend Reversal and Impulsive Setup
Current price: $1,215.6
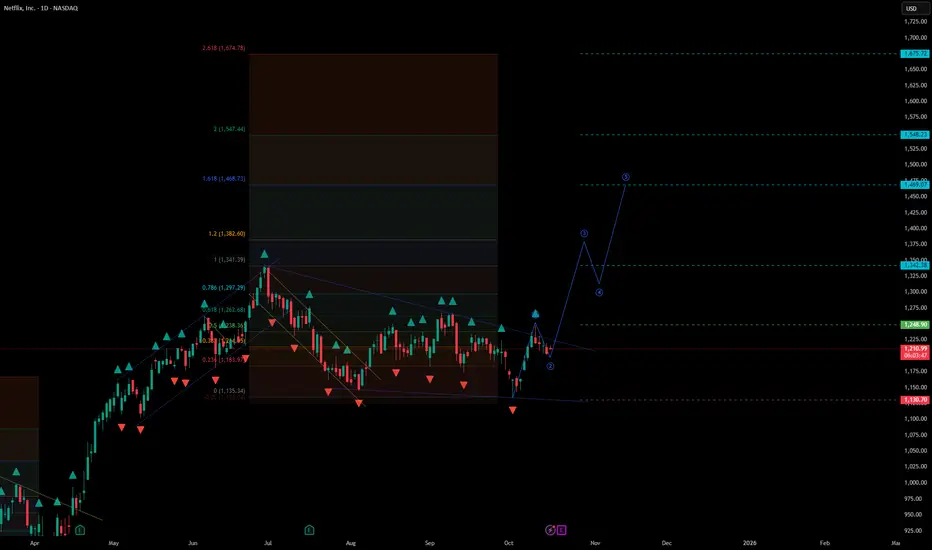
Netflix is showing early signs of a trend reversal after completing a multi-month corrective phase. The structure suggests a shift toward a new impulsive rally within the broader bullish framework.
🧩 Technical Overview
• After a prolonged pullback from the June highs, price found support near $1,130, forming a local base.
• The descending channel was broken to the upside — a signal of potential momentum change.
• Price is now consolidating above the breakout zone, building the foundation for an upward impulse.
📈 Scenario
• The structure resembles the start of a new impulsive leg following the correction.
• As long as the market holds above $1,130, bullish continuation remains the dominant view.
• Stop-loss: below the recent swing low at $1,130.
• Upside targets:
– $1,250–$1,270 – short-term retest of breakout zone
– $1,340–$1,380 – key resistance and mid-cycle confirmation zone
– $1,470–$1,550 – major Fibonacci target range
– $1,670+ – extended bullish objective if momentum accelerates
⚙️ Market Context
• The broader trend remains constructive as long as price stays above the breakout structure.
• Momentum shift coincides with improving sentiment across large-cap techs.
• A sustained move above $1,340 would confirm renewed strength and open the path toward the $1,500 area.
🧭 Summary
Netflix has likely completed its corrective phase and is preparing for a new upside cycle.
Holding above $1,130 keeps the bullish bias intact, while a breakout above $1,340–$1,380 would confirm trend continuation toward $1,470–$1,550 and beyond.
Netflix
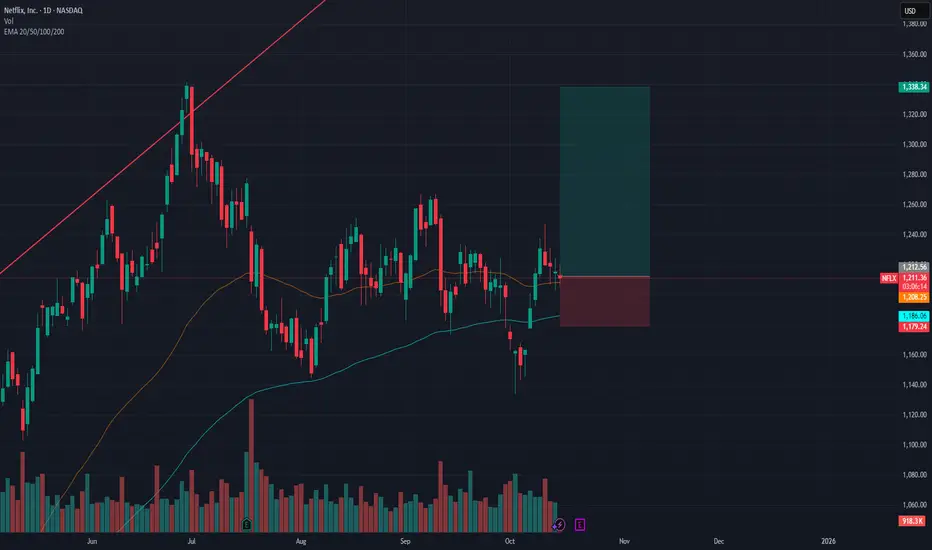
NETFLIX PERFECT LONGNASDAQ:NFLX On the daily TF has committed a large sweep of liquidity, then has broken the previous swing high and is now consolidating bullishly towards the daily 50ema, where I am looking for a reaction to the upside. At the lowest there could be a spike down to the 50fib on a fast retracement, so SL below. But rejection of 4hr 50ema and 100ema is telling that the move is ready to happen and likely not to retrace back down much further. I am targeting the previous long term highs as a tp.
I feel confident in this entry, the price action is clean. Bollinger band volatility confluence is missing which is my only hesitation, however with the price action being as strong as it is, I am more than willing to make the entry.
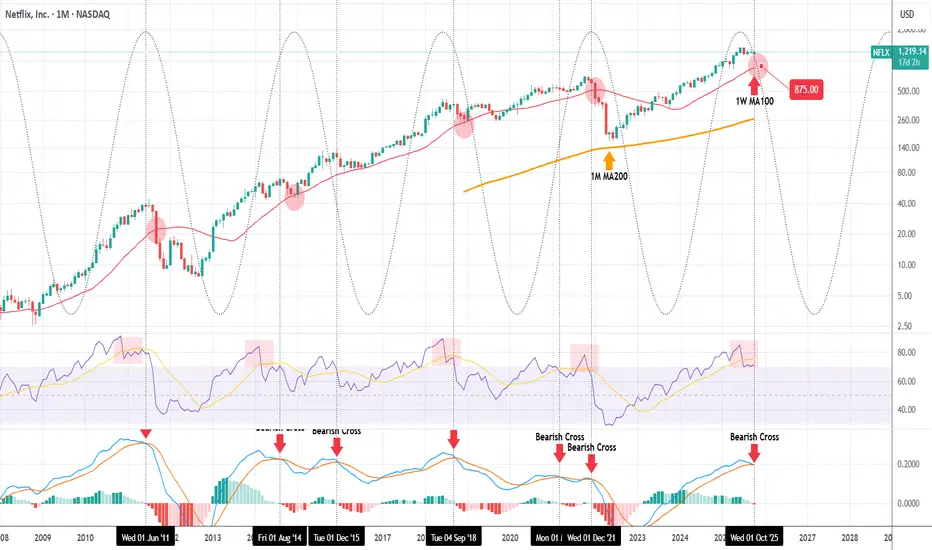
NETFLIX has topped and can pull back to $875.Netflix (NFLX) has formed one of its strongest Sell Signals in the last 15 years. That's the 1M MACD Bearish Cross.
The stock has been trading on a very consistent pattern ever since the 2008 U.S. Housing Crisis and during this multi-year span, the best indicator for a Top has been the 1M MACD forming a Bearish Cross.
As you can see, this month marks the 7th such occurrence since June 2011. All previous formations resulted in the price pulling-back to touch at least its 1W MA100 (red trend-line). Only two times the correction has been bigger that was that first Bearish Cross in June 2011 and the most recent December 2021, which almost hit the 1M MA200 (orange trend-line), the market's ultimate multi-decade Support.
These Top signals match fairly well the Sine Waves, which as you see form somewhat reliable Cycles. Those confirm that Netflix currently stands on a long-term Top. Even the 1M RSI is similar to the Top patterns suggested by the Sine Waves.
As a result, we expect the stock to start a multi-month technical pull-back, with a fair projection of making contact with its 1W MA100 being $875.00. That's our Target.
-------------------------------------------------------------------------------
** Please LIKE 👍, FOLLOW ✅, SHARE 🙌 and COMMENT ✍ if you enjoy this idea! Also share your ideas and charts in the comments section below! This is best way to keep it relevant, support us, keep the content here free and allow the idea to reach as many people as possible. **
-------------------------------------------------------------------------------
💸💸💸💸💸💸
👇 👇 👇 👇 👇 👇
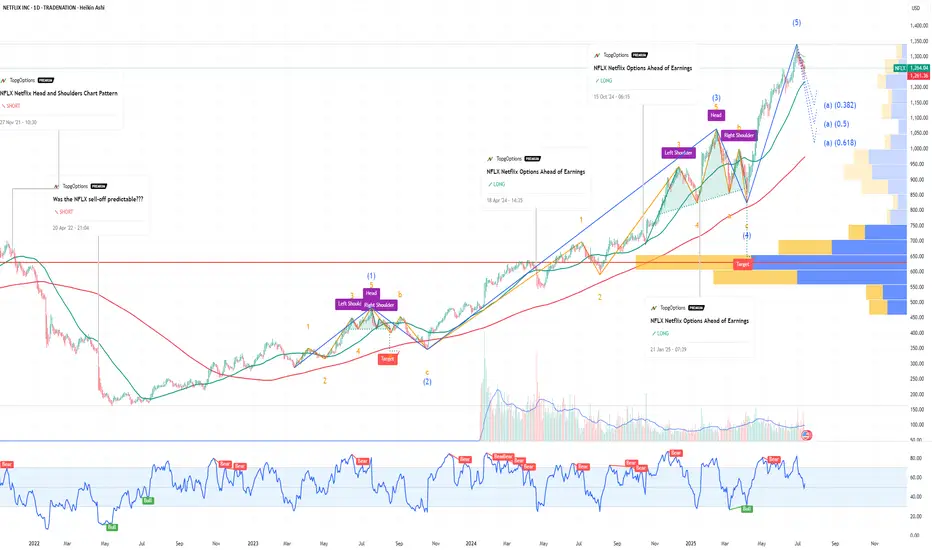
Netflix (NFLX) - Descriptive Analysis by FIBCOS📘 NFLX 2009–2029 Descriptive Analysis
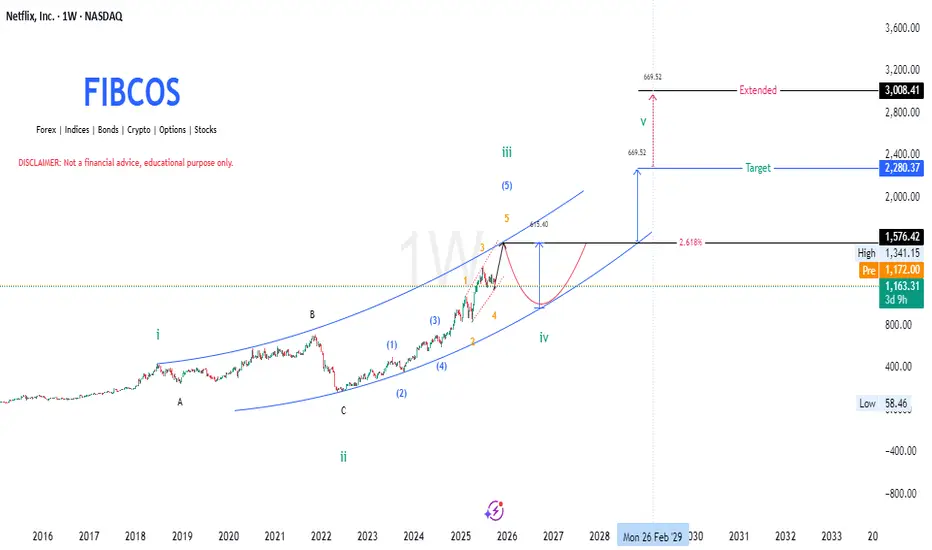
This is a detailed Elliott Wave Theory -based outlook for Netflix (NFLX) stock from around 2009 to the projected future of 2029, and it incorporates Fibonacci retracement & extensions, Smart Money Concepts (SMC) , and Price Action structure within a channel.
Let’s break this down chronologically and structurally:
🌀 Wave Theory Confluence (Elliott Wave Structure)
The long-term structure of Netflix (NFLX) from 2009 to the projected 2029 period follows a classic Elliott Wave cycle, now realigned with the cycle top in mid-2018 and the macro correction ending in mid-2022.
1. Cycle Wave i (2009–2018):
NFLX entered a powerful multi-year rally, forming five sub-waves within this first major impulse. This long rally ended in mid-2018 , marking the top of Cycle Wave i .
2. Cycle Wave ii – ABC Correction (2018–2022):
From the 2018 top, the price entered a prolonged and complex 4-year correction, unfolding as a classic A-B-C corrective structure.
Wave A began the decline with a sharp markdown.
Wave B was a fake recovery, leading to Wave C, a deeper liquidation into mid-2022 , completing the correction.
This phase aligns with a major redistribution cycle where smart money exited positions, and retail investors were caught in hope rallies.
3. Cycle Wave iii (2022–2025):
After finding a bottom in mid-2022, the stock launched a new impulsive rally , forming five sub-waves (1–5) of a powerful Wave iii
Momentum accelerated in wave 3 of iii (typical in Elliott Wave), and the structure is now peaking as of late 2025, around $1,576.42.
This marks the expected completion of Wave iii, with signals pointing toward a correction.
4. Cycle Wave iv (Expected 2025–2027):
A corrective wave iv is expected to unfold, possibly returning toward the lower bound of the long-term ascending channel.
According to the principle of alternation , since wave ii was deep and complex, wave iv may be shallower or more sideways.
5. Cycle Wave v (Expected 2027–2029):
After the wave iv correction, a final impulsive leg — Wave v — is expected to push the price higher, targeting around $2,280.37 , with a potential extended move to $3,008.41 .
This will complete the macro 5-wave cycle that began in 2009.
📐 Fibonacci Confluence
The Fibonacci structure supports these wave formations:
The 2.618 extension of the previous impulse wave (measured from the 2022 bottom) projects a price target near $2,280.37 , aligning with historical extension zones.
The extended target at $3,008.41 aligns with the upper boundary of the long-term channel — often reached during euphoric final waves.
Prior retracements during wave ii and the anticipated retracement in wave iv fall into common Fibonacci pullback zones (0.382–0.618).
Fibonacci tools confirm that price has behaved symmetrically within the wave cycles, and provide high-probability zones for both correction and expansion.
🧠 Smart Money Concept (SMC)
From a Smart Money perspective, the chart reflects a complete institutional cycle:
Distribution Zone (2017–2018):
Smart money exited during the late stages of Cycle Wave i. This aligns with the cycle top in mid-2018 , often accompanied by overvaluation and high optimism.
Re-Accumulation Phase (2018–2022):
The 4-year correction allowed institutional players to accumulate at discounted prices during wave C. Retail was largely shaken out, and liquidity was swept multiple times.
Expansion Phase (2022–2025):
From the 2022 bottom, price moved sharply upward in a clean impulse (Wave iii), confirming institutional interest. Gaps, strong breakouts, and efficient trends reflected low-resistance expansion driven by smart money.
Future Distribution (2029?):
Around the projected $2,280–$3,008 range (Wave v), expect distribution signs —including deviation from trend, order block mitigation, and liquidity grabs. These are typical before a larger market reset.
Smart Money Concepts help explain the why behind each wave: fear and euphoria don’t happen randomly — they are often orchestrated phases of value transfer.
📊 Price Action Structure
The long-term price action of NFLX reinforces the wave count and market psychology:
2009–2018 (Wave i):
Price action showed a steady trend of higher highs and higher lows , with smooth breakouts and momentum-driven runs.
2018–2022 (Wave ii correction):
A breakdown in structure occurred. Lower highs and a wide, overlapping correction defined this multi-year distribution. Key support levels were breached and retested as resistance — a classic bearish shift in structure.
2022–2025 (Wave iii):
Clean, impulsive movement resumed. Breakouts, bullish flags, and retests marked key continuation zones. Market structure flipped back bullish with efficient rallies.
2025–2027 (Wave iv expected):
A retracement is likely toward previous demand zones , possibly aligning with wave 4 of the lower-degree impulse, respecting Elliott’s guideline of wave 4 often retracing to the territory of wave 4 of the previous degree.
2027–2029 (Wave v projection):
Anticipate price pushing into new highs, with potential overextension . However, bearish divergence and slowing momentum could foreshadow the macro top.
This structure shows how technical behavior mirrors emotional and fundamental phases — from greed to fear, and back again.
📆 Timeline Summary (2009–2029)
2009–2018:
Powerful multi-year impulse forms Cycle Wave i , ending in mid-2018.
2018–2022:
A deep, multi-legged ABC correction forms Cycle Wave ii , ending in mid-2022.
2022–2025:
Explosive impulsive rally forms Cycle Wave iii , currently completing around $1,576.42.
2025–2027 (Expected):
A corrective pullback forms Cycle Wave iv , likely more sideways or shallow in structure.
2027–2029 (Expected):
Final rally completes Cycle Wave v , with price targets between $2,280.37 and $3,008.41 , ending the macro Elliott structure.
🔚 Conclusion
With the cycle top revised to mid-2018 and the correction ending mid-2022 , the chart structure becomes even more aligned with classic Elliott Wave theory and Smart Money behavior.
Netflix’s long-term chart is a perfect confluence of:
Elliott Wave structure (impulse → correction → impulse),
Fibonacci precision,
Institutional manipulation (SMC), and
Clear price action behavior.
The roadmap to 2029 shows exciting bullish potential, but also highlights the need for caution near projected macro top zones — where institutional distribution may quietly unfold again.
📘 DISCLAIMER: This is a structural, educational market outlook. Not financial advice. Please do your own due diligence and risk management.
#Netflix, #NFLX, #Nasdaq #WaveTheory, #Fibonacci, #SmartMoney, #PriceAction
Falling Wedge on NFLX: Set for a Break?Price on NASDAQ:NFLX has been consolidating inside a falling wedge, with each swing showing weaker momentum from sellers. And buyers are slowly stepping back in.
A strong breakout above the upper trendline would confirm bullish strength and signal a potential continuation toward the 1,400.00 level.
Until then, patience is key, waiting for a clear break with volume can help avoid false signals.

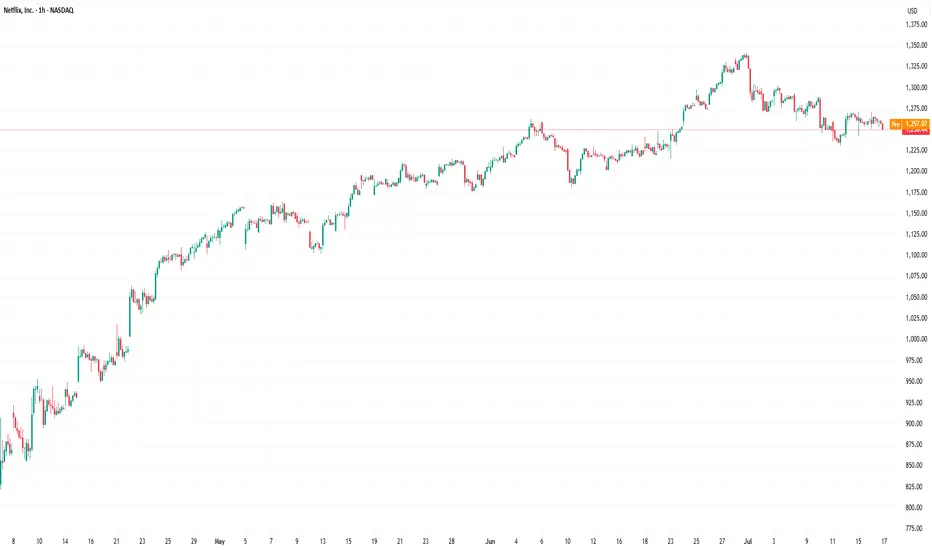
Is Netflix Stock Headed Toward $1,100?Netflix shares are going through a difficult period, as the streaming giant has posted five consecutive losing sessions, with a decline of around 4.5% in recent trading days. For now, the selling bias has become dominant, driven by the viral "Cancel Netflix" campaign circulating on social media, where many users have decided to cancel their subscriptions following a recent controversy involving the company. As long as this negative sentiment fueled by the campaign remains in place, selling pressure is likely to continue playing a key role in the stock’s short-term movements.
Bearish Trend Emerges
Since early July, a series of lower highs has formed, establishing a solid downward trendline. In addition, price oscillations below the 100-period moving average reinforce the outlook for a consistent bearish bias. Unless a significant bullish correction occurs in the near term, selling pressure could continue to dominate, allowing the bearish trend to become more pronounced in the coming sessions.
RSI
The RSI line continues to show downward oscillations below the neutral 50 level, confirming that bearish momentum remains dominant over the past 14 trading sessions. However, the indicator is approaching the oversold zone, marked by the 30 level, and reaching this area could signal a market imbalance, potentially opening a window for short-term corrective rebounds.
MACD
The MACD histogram continues to display negative oscillations below the zero line, indicating that bearish directional strength remains dominant in the short-term moving averages. As the histogram continues to post lower values, selling pressure is expected to remain a key factor in the coming sessions.
Key Levels to Watch:
1,221 – Major Resistance: Corresponds to the area marked by the 100-period simple moving average. Price action breaking above this level could trigger a relevant bullish bias, putting the current downtrend at risk.
1,155 – Nearby Support: Represents the area of the latest price pullbacks. If price breaks below this level, the bearish trend could extend further in the short term, leading to sustained selling pressure. It may also act as a technical barrier capable of producing temporary bullish corrections.
1,097 – Critical Support: Corresponds to the zone marked by the 200-period simple moving average. A sustained break below this level could activate a more aggressive downtrend, likely defining the stock’s movements over the next few weeks.
Written by Julian Pineda, CFA – Market Analyst

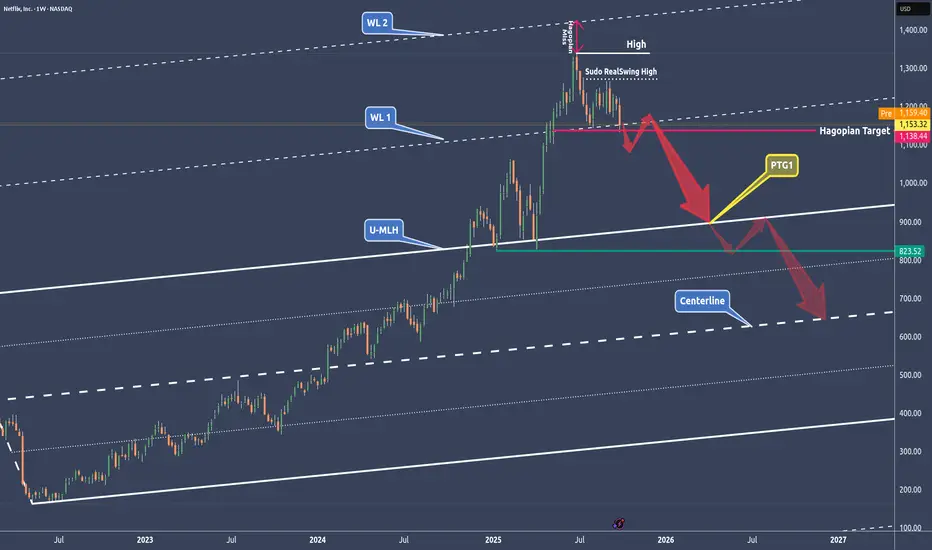
NFLX - NetFlix done after the run?🔱 A break of the WL1 could be the technical short signal 🔱
NetFlix had a monster run.
✅ Here’s a grounded fundamental breakdown of risks that could push Netflix downward. None of these are certainties, instead think of them as warning signs, not predictions.
👉 Slowing subscriber growth – growth in mature markets may plateau, and churn could rise if hit shows underperform.
👉 Rising competition and costs – rivals like Disney+ and Amazon force Netflix to spend more on content, squeezing profit margins.
👉 High valuation risk – expectations are lofty, so even a small earnings miss could trigger a sharp sell-off.
✅ Chart analysis
After missing WL2, we’ve got a Hagopian in play, which I’d say still hasn’t been fulfilled. The line was touched by a few ticks, but usually these lines break more decisively.
🔨 If we open and close below WL1, I’m stalking a pullback to it, just to hit the market on the head. If this break really happens, we’ll also have a clean structure for our stop, placed above the last RealSwing high.
🎯 The target is set in stone for me: It's the U-MLH and beyond, down to the Centerline.
Let’s stay focused and keep our cool.
Happy new week!
Netflix Investment Outlook Volume 2Top called July 27th, 2021, months prior. No surprises/remorse here! The idea is linked below.
Moving forward, Netflix's price action will be choppy and downward facing. ABC correction in progress; B wave recovery expected soon. Bottom of the historical channel - end game. Fundamentally, increased competition will continue the downtrend in subscriptions. Conclusion: Bear!

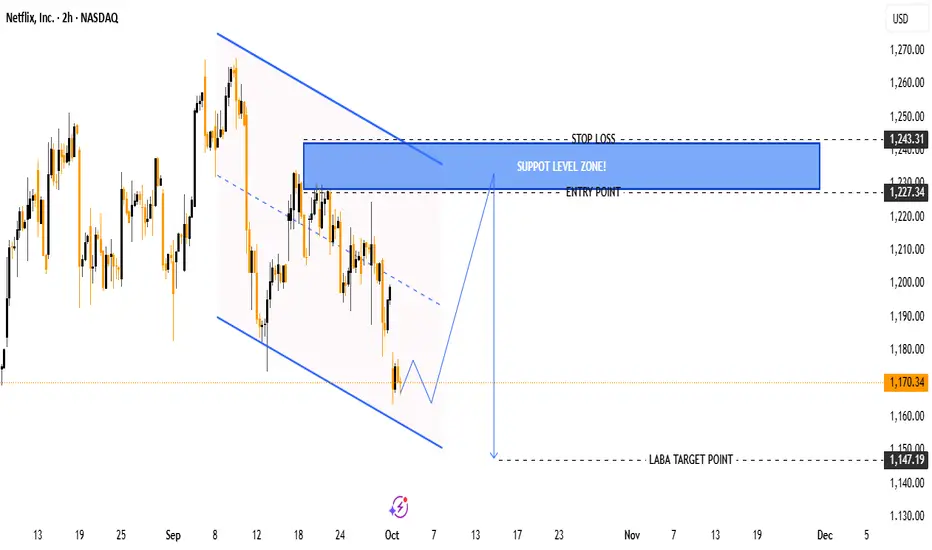
NFLX Bearish Trading Setup – Entry $1,227 | Target $1,147Ticker: Netflix (NFLX)
Timeframe: 2H (2-hour chart)
Current Price: $1,170.34
Chart Pattern: Descending channel (bearish trend continuation setup).
📉 Key Levels
Entry Point: $1,227.34
Marked as the level where price might retrace before resuming downward.
Stop Loss: $1,243.31
Positioned above the support/resistance flip zone to protect from false breakouts.
Target Point (LABA): $1,147.19
Expected downside target if the bearish move continues.
🧩 Technical Structure
The chart shows price moving within a descending channel.
The current price ($1,170.34) is near the lower boundary of the channel.
The analysis suggests a possible retracement (pullback) upward toward the support zone (blue area) before continuing the downtrend.
The blue box zone ($1,227 – $1,243) is a critical liquidity zone / resistance area, expected to reject price lower.
📊 Trading Plan (as per chart)
Sell/Short Setup:
Wait for retracement into the blue resistance zone ($1,227 – $1,243).
Enter short around $1,227.
Place Stop Loss above $1,243.
Take Profit near $1,147.
Risk/Reward:
Risk = ~ $16 (1,243 – 1,227).
Reward = ~ $80 (1,227 – 1,147).
Approx. R:R ratio = 1:5 (highly favorable).
✅ Summary:
This chart suggests Netflix (NFLX) is in a downtrend within a descending channel. A pullback to the $1,227–$1,243 zone could offer a shorting opportunity targeting $1,147, with a strong risk/reward ratio.
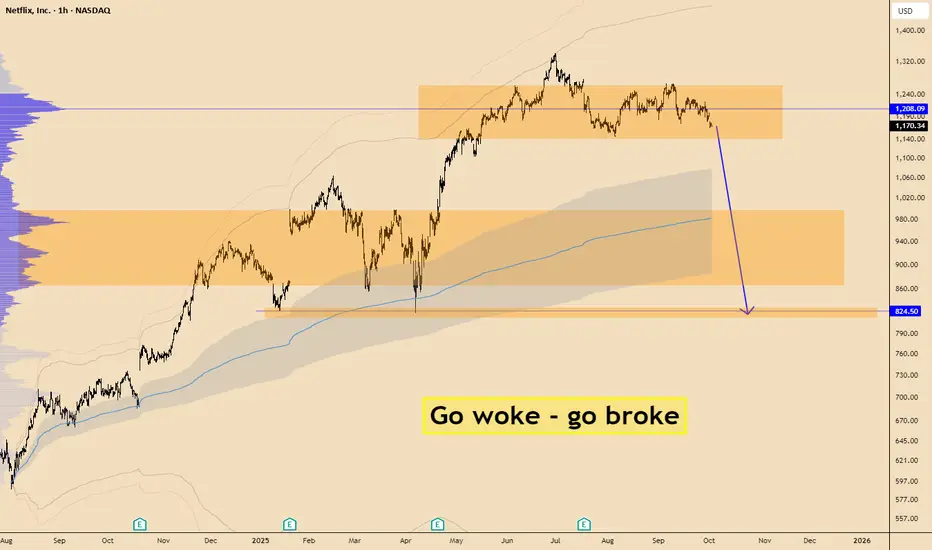
Elon Musk started a compane against Netflix Elon Musk started a compane against Netflix
i think it could lead to significat loss in user base
Honestly i also canceled my subssricption. Too much of woke propaganda there/
if price lose VWAP - it could lead to big loss
Netflix: Trading Sideways as Correction Nears Target ZoneNetflix initially dipped slightly before settling into a sideways trading pattern. There remains a 33% probability that a new high for turquoise wave alt.3 could develop above resistance at $1,341. However, our primary outlook suggests that turquoise wave 4 will carve out its low in the turquoise Target Zone between $961.52 and $843.96, at which point it should hand off to wave 5—which should drive gains above the $1,341 level.

iQIYI: bet on recovery or just another illusion?Fundamentally, iQIYI is often called the “Netflix of China.” In recent years, it has faced heavy pressure from high debt levels, fierce competition from Tencent Video and Bilibili, and slower growth in the Chinese domestic market. However, recent earnings reports show positive shifts: a growing subscriber base, higher ARPU (average revenue per user), and reduced operating losses. With government support for the tech and entertainment sector and signs of consumer recovery, iQIYI has a real chance to strengthen in the mid to long term. If subscriber growth and cost control continue, the company’s market cap could start to recover, making current levels attractive for medium-term investors.
Technically, the stock still trades below the 200 EMA, showing ongoing seller pressure. The key support zone is $2.30–2.40, and holding this area keeps the bullish scenario alive with targets at $3.40 and $5.25. A longer-term recovery could extend toward $10.40, but only if a sustainable uptrend is confirmed. Losing $2.30 would invalidate the bullish case and expose downside toward $1.60–1.80.
This is one of those situations where market expectations diverge from reality. Optimism makes a reversal seem near, but as always, emotions must be put aside — we wait for clear technical signals before entering.

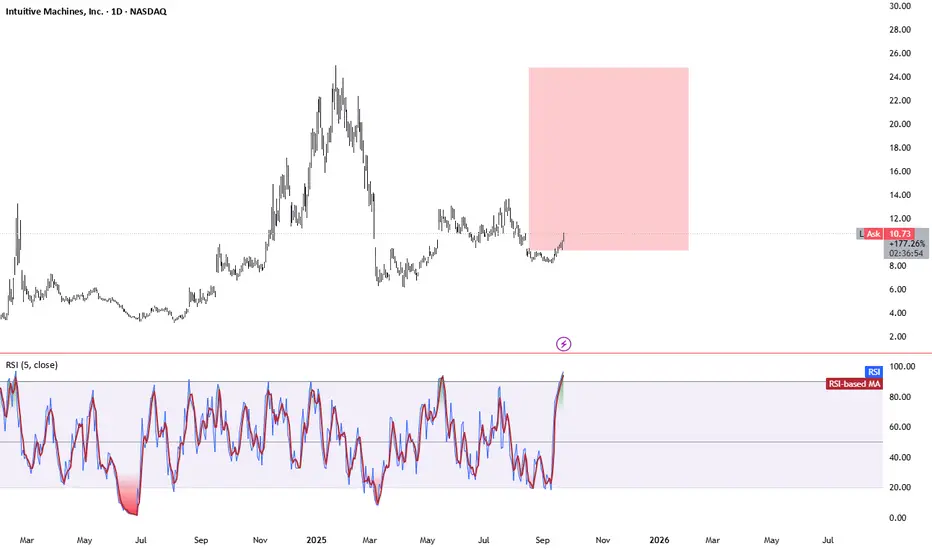
Intuitive Machines (LUNR) BACK TO 20 DOLLARS Why Intuitive Machines (LUNR) Could Rocket Back to $20 by 2026: Lunar Bull Case LUNR's trading at ~$9.71 today (Sep 23, 2025), down from its $24.95 peak amid mission hiccups, but with NASA contracts stacking and revenue exploding, $20 (106% upside) is in orbit by EOY 2026. Here's the launch sequence:NASA Contract Avalanche: Fresh $2.5M NextSTEP award (Jan '25) for lunar logistics, plus $4.82B Near Space Network (NSN) for comms/nav through 2029 (extendable to 2034). IM-3 mission in '26 delivers South Pole payloads ($116.9M CLPS), scaling DTE services to $200M+ annually.
5 sources
LTV award mid-'25 adds mobility revenue, hedging risks.
Revenue Hypergrowth: From $217M in '25 to $700M+ in '26 (222% YoY) on dual missions, relay sats, and NSN backlog. EPS flips to $0.03 avg (from -$0.22), trading at 20x forward P/E—undervalued vs. space peers at 30x.
2 sources
Analyst Moonshot Targets: Consensus $15.44 short-term (6 firms, Moderate Buy), but bulls like Canaccord ($26, up from $17.50) and Intellectia ($24.94 Dec '26) eye $20+ on Artemis tailwinds. Highs to $31.88 clear it easy.
5 sources
Artemis & Market Boom: $1T space economy by 2040; LUNR's Nova-C landers + Khon sats position it for 20-30% YoY growth, per Reddit bulls modeling $500M+ revenue at 20x P/S = $100 PT (conservative slice: $20).
K-Pop: Demon Hunters to Drive Netflix Higher?The recent success of global hits like K-Pop: Demon Hunters and strong fundamentals give the stock a tailwind, and technically, the corrective and consolidative phase appears to be maturing.
Netflix is consolidating between $1198 and $1243, after rebounding from the $1,144 support level, which has proven to be a strong floor following the sharp correction from the $1341 high.
Price is currently trading under the 50% Fibonacci retracement of the last down leg. The structure suggests that the market is in a decision phase.
The RSI on the 4H timeframe is stabilizing in mid-range territory.
If the price continues to hold above $1198, this keeps the bias bullish.
A breakout above $1243 would likely trigger a move and possible retest of the prior high near $1341.
In my view, the most probable scenario is a move higher as long as the support holds.
My projection is for a period of consolidation, followed by a breakout toward $1340 in the coming weeks, provided $1198 is not broken.

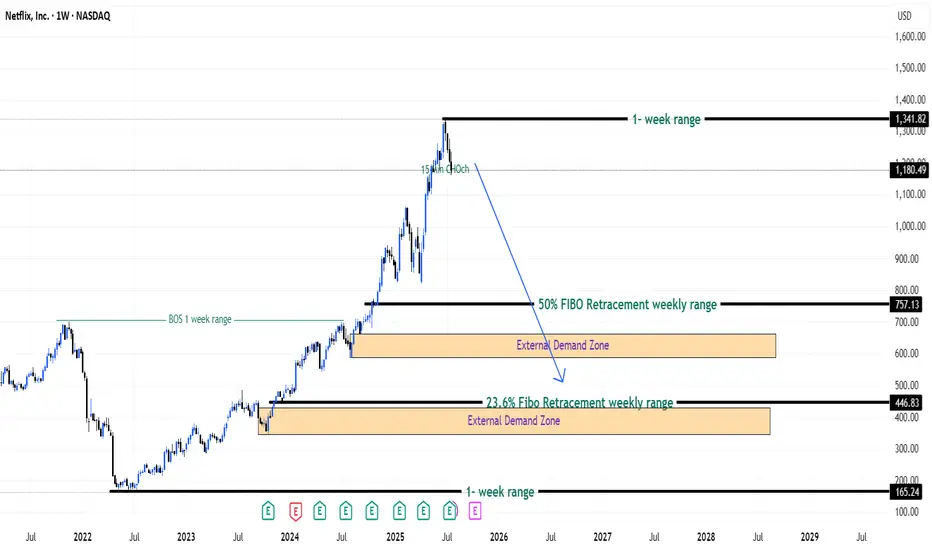
Bulls Quit? Bears Ready! - Netflix Stock (USA) - {27/07/2025}Educational Analysis says that Netflix (USA Stock) may give trend Trading opportunities from this range, according to my technical analysis.
Broker - NA
So, my analysis is based on a top-down approach from weekly to trend range to internal trend range.
So my analysis comprises of two structures: 1) Break of structure on weekly range and 2) Trading Range to fill the remaining fair value gap
Let's see what this Stock brings to the table for us in the future.
DISCLAIMER:-
This is not an entry signal. THIS IS FOR EDUCATIONAL PURPOSES ONLY.
I HAVE NO CONCERNS WITH YOUR PROFITS OR LOSS,
Happy Trading,
Stocks & Commodities TradeAnalysis.
My Analysis is:-
Short term trend may be go to the external demand zone.
Long term trend breaks the new high after going from discount zone.
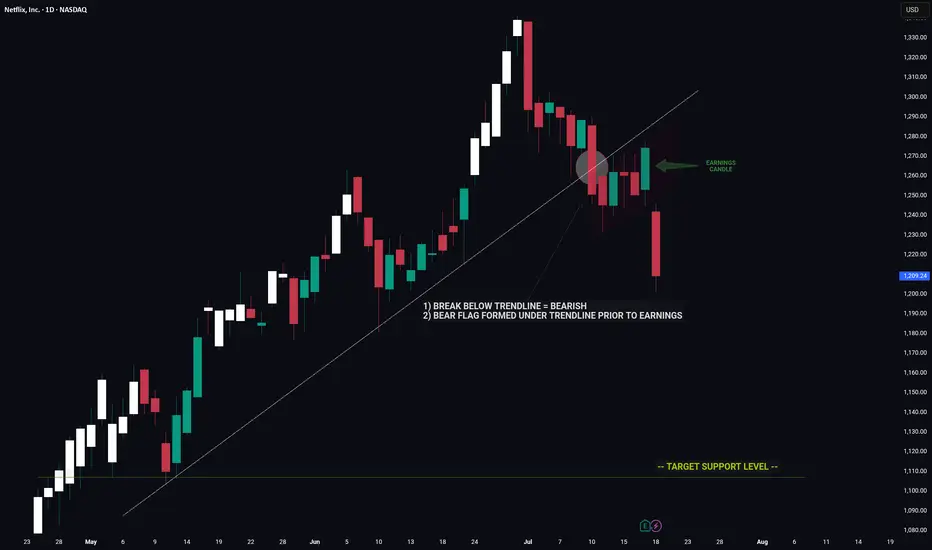
NETFLIX -- Price Signaled A Move Lower Prior To EarningsHello Traders!
The chart of NFLX is a great example of using clues to decipher a future move.
Prior to earnings we had major bearish indicators on the chart that hinted towards a move down on earnings.
1) Break below major trendline
2) Bear flag
These two signals by themselves are very bearish however the fact that these signals appeared coming into earnings was an even strong indicator of a potential for negative move.
Now that the upward trend is broken NFLX has a long way to fall before reaching the next key support level.
Thanks everyone and best of luck on your trading journey!
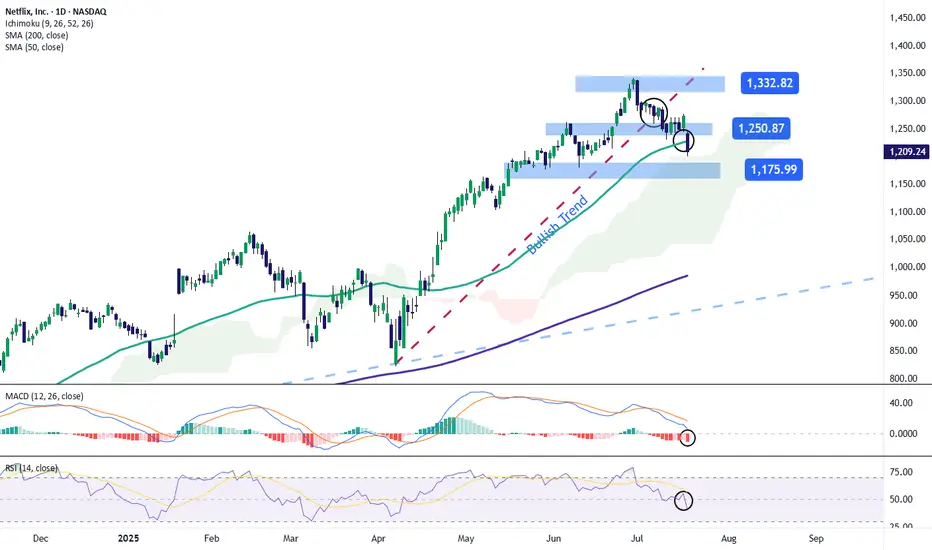
Netflix Stock Drops After Earnings ReleaseShortly after publishing its financial results, Netflix posted a decline of over 5% toward the end of the week and continues to show a strong bearish bias. This comes despite reporting a positive earnings per share (EPS) figure of $7.19, beating the expected $7.08, and revenue of $11.08 billion, slightly above the forecast of $11.07 billion.
However, in its post-earnings communications, the company stated that it expects very moderate growth for the remainder of the year. It also warned that the positive indicators could begin to compress due to increased spending on marketing and content, which has ultimately weakened the impact of the solid financial results. As a result, the stock faced persistent selling pressure heading into the weekly close.
Uptrend Breaks
Over the past few weeks, starting in early April, the stock had followed a steady uptrend, pushing the price above $1,300. However, continued bearish corrections have now brought the price down to the $1,200 area, causing a clear break in the previous uptrend. This breakdown could further strengthen the bearish pressure in the coming sessions if the negative sentiment persists.
MACD
The MACD histogram continues to move below the zero line, and as it drifts further from this level, it signals a steady bearish momentum that could remain dominant in the near term if the trend continues.
RSI
The RSI line has broken sharply below the neutral 50 level, indicating a clear dominance of bearish momentum in the market. As long as it does not reach oversold territory, this move may suggest a continued increase in short-term selling pressure.
Key Levels:
1,332 – Recent High: This is the most important resistance level. If price action returns to this area, it could reactivate the previous uptrend, which had been weakening on the chart.
1,250 – Nearby Resistance: A barrier defined by the most recent neutral zone. It may act as a temporary ceiling against short-term bullish corrections.
1,175 – Key Support: A critical level located below the 50-period simple moving average. If the price breaks below this level, it could strengthen a bearish bias and trigger a more consistent downtrend.
Written by Julian Pineda, CFA – Market Analyst
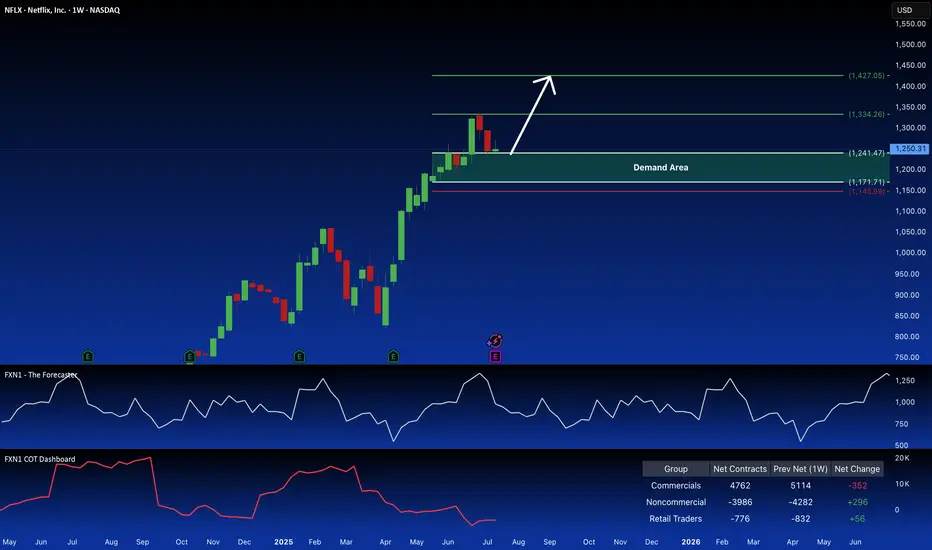
NFLX: Bullish Signal in Demand ZoneNetflix (NFLX) recently retraced within a key weekly demand zone, potentially presenting a long opportunity. Non-commercial traders are also accumulating long positions in the stock. This suggests a possible bullish setup. Your thoughts?
✅ Please share your thoughts about NFLX in the comments section below and HIT LIKE if you appreciate my analysis. Don't forget to FOLLOW ME; you will help us a lot with this small contribution.
How Earnings Reporting Could Impact Netflix (NFLX) Share PriceHow Earnings Reporting Could Impact Netflix (NFLX) Share Price
Earnings season is gaining momentum. Today, after the close of the main trading session, Netflix (NFLX) is set to release its quarterly financial results.
Analysts are optimistic, forecasting earnings per share (EPS) of $7.08, up from $4.88 a year earlier, and revenue growth to $11.1 billion.
The upbeat sentiment is driven by:
→ the fact that Netflix’s business model is relatively resilient to tariff-related pressures;
→ the company’s success in curbing password sharing and promoting a more affordable ad-supported subscription tier.
Netflix has reported revenue growth for six consecutive quarters, outperforming competitors such as Disney, Amazon, and Apple. Its market share has climbed to 8.3%, with YouTube remaining its only serious rival—YouTube's share increased from 9.9% a year ago to 12.8% in June, according to Nielsen. If current trends hold, this reporting quarter could mark another strong performance for Netflix.
However, is the outlook truly that bullish?
Technical analysis of NFLX stock chart
The NFLX stock price is currently moving within an ascending channel (marked in blue), and it is now testing the lower boundary of this formation. Of concern is the recent pronounced bearish movement (B), which has dragged the stock from the channel’s upper boundary to its lower edge—erasing the bullish momentum (A) that followed the breakout above the $1,250 resistance level.
What’s next?
→ On the one hand, bulls may attempt to resume the upward trend within the channel.
→ On the other hand, bears could build on their recent momentum (highlighted in red) and break the ascending trend that has been in place since May.
It appears the fate of the current uptrend hinges on the market’s reaction to today’s earnings release.
This article represents the opinion of the Companies operating under the FXOpen brand only. It is not to be construed as an offer, solicitation, or recommendation with respect to products and services provided by the Companies operating under the FXOpen brand, nor is it to be considered financial advice.
NFLX Netflix Options Ahead of EarningsIf you haven`t bought NFLX before the previous earnings:
Now analyzing the options chain and the chart patterns of NFLX Netflix prior to the earnings report this week,
I would consider purchasing the 1260usd strike price Puts with
an expiration date of 2025-9-19,
for a premium of approximately $71.10.
If these options prove to be profitable prior to the earnings release, I would sell at least half of them.
Disclosure: I am part of Trade Nation's Influencer program and receive a monthly fee for using their TradingView charts in my analysis.
Netflix Faces Rising Volatility and Bearish Technicals Ahead of Netflix (NASDAQ: NFLX) will announce its results after the close of trading in New York on Thursday, 17 July. Analysts forecast the NASDAQ-listed streaming media company to report second-quarter earnings growth of 45%, reaching $7.08 per share, while revenue is expected to increase by 15.6%, amounting to $11.1 billion. Net subscriber additions are predicted to decrease by 42.9%, falling to 4.6 million.
For the third quarter, analysts forecast guidance for revenue of $11.3 billion, up 14.7%, and earnings of $6.68 per share, reflecting growth of 23.6%. The options market is pricing in a 6.4% move, either up or down, in Netflix shares following the earnings report.
The significant expected move in the stock is driven by implied volatility levels for options expiring on 18 July, which were high at nearly 70% as of the 13 July close and are likely to increase further as results approach. Options positioning in Netflix also appears notably bullish, with call delta values surpassing put delta values. This indicates that once the company reports its results and options begin to decrease in value due to the decay of implied volatility, market makers might find themselves overly hedged on the long side, potentially forcing them to sell shares. This scenario could exert downward pressure on the stock if it fails to breach the $1,300 level, which acts as the gamma call wall.
Additionally, technical analysis shows a downside risk for the shares both before and after the results. The Relative Strength Index (RSI) for Netflix has been trending lower and recently dropped below 50, signalling a shift in momentum from bullish to bearish. Furthermore, the stock has broken down from a rising broadening wedge pattern, which is traditionally seen as a bearish reversal signal, indicating a possible decline back towards the pattern’s origin, around $1,100.
Written by Michael J. Kramer, founder of Mott Capital Management.
Disclaimer: CMC Markets is an execution-only service provider. The material (whether or not it states any opinions) is for general information purposes only and does not take into account your personal circumstances or objectives. Nothing in this material is (or should be considered to be) financial, investment or other advice on which reliance should be placed.
No opinion given in the material constitutes a recommendation by CMC Markets or the author that any particular investment, security, transaction, or investment strategy is suitable for any specific person. The material has not been prepared in accordance with legal requirements designed to promote the independence of investment research. Although we are not specifically prevented from dealing before providing this material, we do not seek to take advantage of the material prior to its dissemination.

NFLX Weekly Options Outlook — June 1, 2025🚨 Multi-Model Summary
This week’s analysis from top AI models (Grok, Claude, Llama, Gemini, DeepSeek) shows moderate bullish momentum for NASDAQ:NFLX , with a range of technical insights and trade strategies.
🧠 Model Highlights
Grok (xAI)
🔹 Technicals: Price above 10EMA, nearing overbought.
🔹 Sentiment: Bullish news (BofA), VIX low.
🔹 Trade: Buy $1290C @ $0.94 → PT $1.41 / SL $0.47
🔹 Confidence: 60%
Claude (Anthropic)
🔹 Technicals: Strong EMAs, bullish MACD on 5M.
🔹 Sentiment: BofA upgrade + options flow into $1300.
🔹 Trade: Buy $1220C @ $12.25 → PT $18–20 / SL $8
🔹 Confidence: 72%
Llama (Meta)
🔹 Technicals: Bullish near-term; RSI normalized.
🔹 Sentiment: BofA bullish note, minor CNBC drag.
🔹 Trade: Buy $1290C @ $0.94 → PT $2.50 / SL $0.40
🔹 Confidence: 65%
Gemini (Google)
🔹 Technicals: Uptrend, MACD divergence noted.
🔹 Sentiment: Strong BofA note, watch $1180 max pain.
🔹 Trade: Buy $1250C @ $4.40 → PT $6.60 / SL $2.20
🔹 Confidence: 60%
DeepSeek
🔻 Bearish Divergence
🔹 Technicals: Overextended short-term.
🔹 Sentiment: Max pain + put skew → downside risk.
🔹 Trade: Buy $1100P @ $0.71 → PT $1.77 / SL $0.35
🔹 Confidence: 65%
✅ Consensus Takeaways
🟢 4 out of 5 models lean bullish
📊 Price > EMAs, sentiment tailwind (BofA upgrade)
⚠️ Max pain at $1180 could act as late-week magnet
⚡ Risk-on setup but overbought—watch for short pullbacks
🎯 Chosen Trade Setup
💡 Trade Idea: Buy NFLX $1220C (2025-06-06)
💵 Entry: $12.25
🎯 Target: $18.40 (+50%)
🛑 Stop: $7.96 (−35%)
🔢 Size: 1 contract
🧠 Confidence: 70%
⏰ Entry: At open (Monday)
⚠️ Key Risks to Watch
RSI near overbought → potential pause
Max pain gravity at $1180 into Friday
Late-week gamma decay = faster premium loss
Macro news or earnings surprises may shift bias
📊 TRADE DETAILS (JSON)
json
Copy
Edit
{
"instrument": "NFLX",
"direction": "call",
"strike": 1220.0,
"expiry": "2025-06-06",
"confidence": 0.70,
"profit_target": 18.40,
"stop_loss": 7.96,
"size": 1,
"entry_price": 12.25,
"entry_timing": "open",
"signal_publish_time": "2025-06-01 16:24:59 EDT"
}

Netflix - The bulls just never stop!Netflix - NASDAQ:NFLX - is insanely bullish now:
(click chart above to see the in depth analysis👆🏻)
The entire stock market basically collapsed during April. Meanwhile, Netflix is creating new all time highs with a +20% parabolic bullish candle. Looking at the chart, this strength is very likely to continue even more until Netflix will (again) retest the upper resistance trendline.
Levels to watch: $1.400
Keep your long term vision!
Philip (BasicTrading)
