USDJPY 4Hour TF - August 10th, 2025🟦 USDJPY 4H Analysis
📅 August 10, 2025
Top-Down Trend Bias:
• Monthly – Bullish
• Weekly – Bearish
• Daily – Bullish
• 4H – Bearish
USDJPY is consolidating inside the 147.500 zone. Higher timeframes remain mixed, with bullish monthly/daily trends but a bearish weekly and 4H structure, making this a key decision area.
🔍 Key Zone: 147.500
This zone is both a structural support and a potential breakout base. The reaction here will set the short term tone.
✅ Scenario A: Bullish Breakout (Blue Path)
1.If price breaks and holds above 147.50
2.Look for continuation into 151.500 resistance zone
3.Aligns with the monthly and daily bullish bias
⚠️ Scenario B: Bearish Breakdown (Orange Path)
1.If price closes below 147.500 zone
2.Watch for retest + rejection to confirm downside continuation
Target: 145.00 support zone
This setup aligns with the bearish weekly and 4H bias.
🧠 Final Notes
• HTF momentum is split, confirmation at the zone is critical
• Blue path favors trend continuation on higher timeframes
• Orange path keeps short term sellers in control
Nickdarcfx

XAUUSD 4Hour TF - August 10th,2025🟦 XAUUSD 4H Analysis
📅 August 10, 2025
Top-Down Trend Bias:
• Monthly – Bullish
• Weekly – Bullish
• Daily – Bullish
• 4H – Bullish
Gold continues to trade in line with the higher timeframe bullish structure, currently testing resistance at the 3,395 zone after a strong upward channel move.
🔍 Key Zone: 3,395
This level aligns with the 78.6% fib retracement and prior structure. The reaction here will determine whether we see a breakout continuation or a corrective pullback.
✅ Scenario A: Bullish Breakout (Blue Path)
1.If price breaks and holds above 3,395
2.Expect continuation toward 3,450
This aligns with the higher timeframe bullish bias and offers solid upside potential
⚠️ Scenario B: Bearish Pullback (Orange Path)
1. If price rejects from 3,395
2.Look for bearish confirmation (engulfing candle, LTF BOS, rejection wicks)
Target 1: 3,320 support
This would be a corrective move within the broader uptrend, offering counter trend opportunities for short-term traders.
🧠 Final Notes
• Higher timeframe bias strongly favors upside continuation
• 3,395 is the immediate decision level, confirmation is key
• Short term pullbacks may offer re-entry opportunities into the larger trend

EURJPY 4Hour TF - August 10th, 2025🟦 EURJPY 4H Analysis
📅 August 10, 2025
Top-Down Trend Bias:
• Monthly – Bullish
• Weekly – Bullish
• Daily – Bullish
• 4H – Bearish
EURJPY is approaching the 172.25 resistance zone after a strong bullish correction. While higher timeframes remain bullish, the 4H structure is still technically in a retracement phase, making this a critical reaction level.
🔍 Key Zone: 172.50
This area marks prior structure and could serve as either a breakout base for further upside or a strong rejection point for sellers.
✅ Scenario A: Bullish Breakout (Orange Path)
1.If price breaks and closes above 172.50
2.Expect continuation toward 173.75 resistance zone
This would align with the overall bullish HTF bias
⚠️ Scenario B: Bearish Rejection (Blue Path)
1.If price rejects from 172.250
2.Look for bearish confirmation (rejection wicks, engulfing, LTF BOS)
Target 1: 171.00
Target 2: 169.60 support
This would maintain the short term 4H bearish structure while still sitting inside a bullish macro trend.
🧠 Final Notes
• 172.250 is the key decision point, watch for clear confirmation
• HTFs favor upside, but short term traders may find better R:R on a rejection
• Always trade the reaction, not the assumption

AUDJPY 4Hour TF - August 10th,2025🟦 AUDJPY 4H Analysis
📅 August 10, 2025
Top-Down Trend Bias:
• Monthly – Bullish
• Weekly – Bullish
• Daily – Bullish
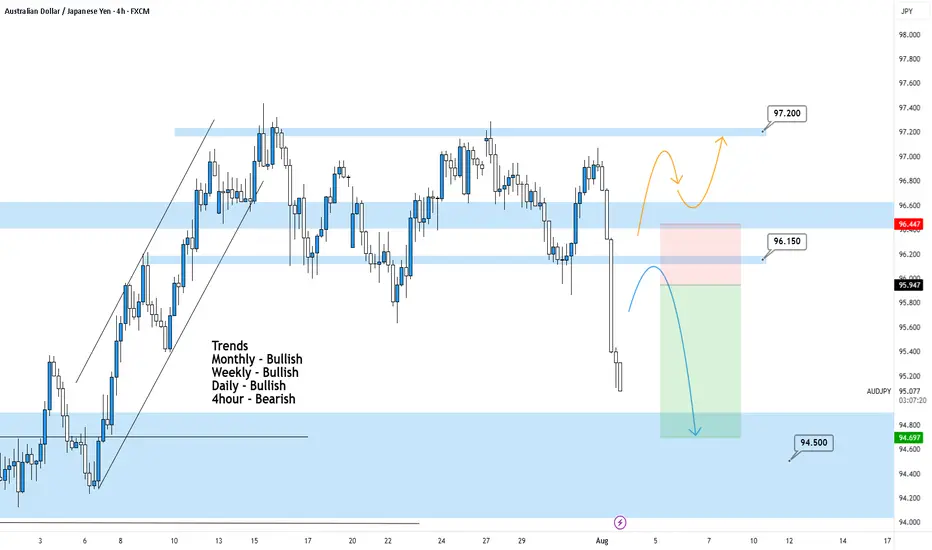
• 4H – Bearish
AUDJPY pushed above 96.15 resistance zone after a short term bullish correction. Higher timeframes remain bullish, but the 4H could still show signs of further bearish movement.
🔍 Key Zone: 96.15
This zone has acted as support and resistance in the past and will be the deciding area for the next directional move.
✅ Scenario A: Bullish Breakout (Blue Path)
1.If price holds above 96.150 area
2.Look for continuation into 97.20 support
This would align with the higher timeframe bullish bias
⚠️ Scenario B: Bearish Rejection (Orange Path)
1.If price breaks and holds below 96.150
2.Watch for bearish confirmation (engulfing, LTF BOS, rejection wicks)
Target: 94.50 support zone
This would maintain the current 4H bearish structure despite the bullish HTF backdrop.
🧠 Final Notes
• 96.15 is the short term decision point for both buyers and sellers
• HTFs favor longs, but sellers may control the 4H
• Confirmation at the zone is key before taking either direction

AUSDUSD 4Hour TF - August 10th ,2025🟦 AUDUSD 4H Analysis
📅 August 10, 2025
Top-Down Trend Bias:
• Monthly – Bearish
• Weekly – Bearish
• Daily – Bearish
• 4H – Bullish
AUDUSD is currently resting around our key zone at 0.6500 after a bullish push on the 4H. Higher timeframes remain bearish, making this a potential area for sellers to re-enter the market.
🔍 Key Zone: 0.6500
This level aligns with prior structure and could serve as a rejection point for either a bullish or bearish short term move.
✅ Scenario A: Bearish Continuation (Orange Path)
1.If price taps 0.6500 and rejects
2.Look for bearish confirmation (engulfing, LTF BOS, rejection wicks)
Target 1: 0.6350 support
This is the trend aligned setup and holds higher probability given the HTF bias.
⚠️ Scenario B: Bullish Breakout (Blue Path)
1.If price rejects 0.6500
2.Could open the door to 0.6585 resistance zone
3.Would indicate a stronger bullish correction within the broader downtrend
This path is counter-trend on HTFs and requires solid confirmation.
🧠 Final Notes
• Higher timeframe structure is bearish, so shorts are favored unless 0.6500 holds
• Patience is key let the level confirm before entering
• Manage risk carefully, especially on counter-trend setups

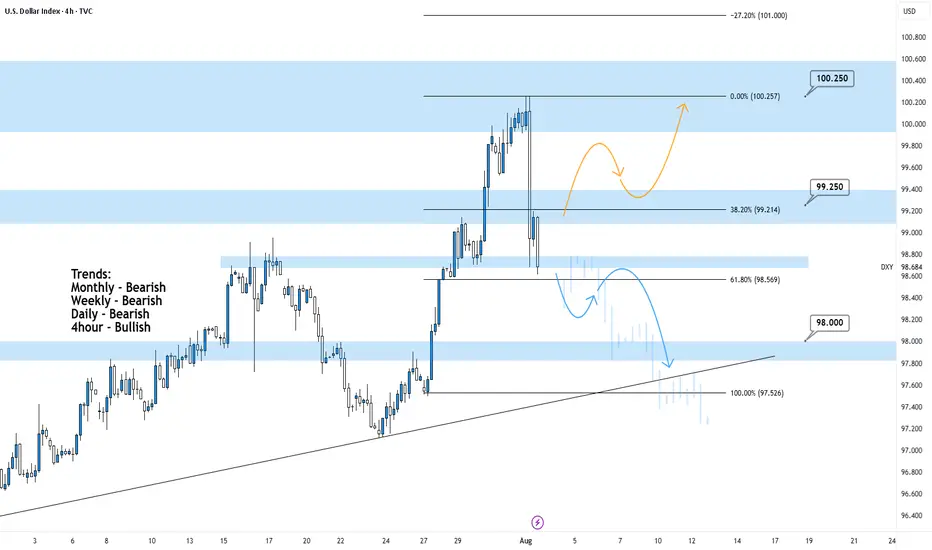
DXY 4Hour TF - August 10th, 2025🟦 DXY 4H Analysis
📅 August 10, 2025
Top-Down Trend Bias:
• Monthly – Bearish
• Weekly – Bearish
• Daily – Bullish
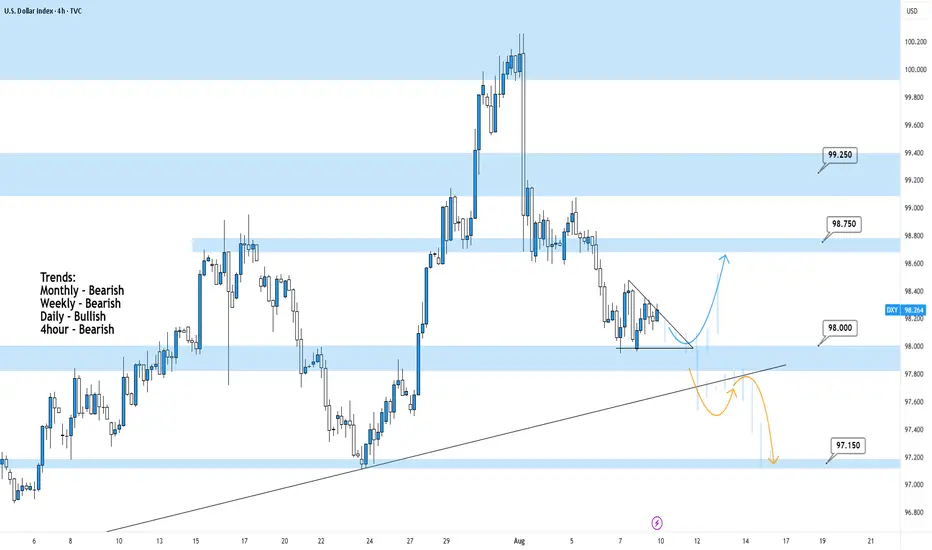
• 4H – Bearish
The Dollar Index is consolidating near the 98.00 support zone after a sustained downtrend on the higher timeframes. Daily shows some bullish relief, but 4H remains under short-term pressure.
🔍 Key Zone: 98.00
This level is a critical decision point, acting as current support and aligning with a trendline from previous swing lows. A break or bounce here will likely set the tone for the next move.
✅ Scenario A: Bullish Breakout (Blue Path)
If price holds above 98.00 and breaks above the current pattern
Look for continuation into 98.75
Extended target: 99.25 resistance
This would be a countertrend move on the higher timeframes but aligns with the daily bullish structure.
⚠️ Scenario B: Bearish Breakdown (Orange Path)
If price breaks and closes below 98.00
Watch for retest rejection to confirm
Target: 97.15 support
This setup aligns with the overall HTF bearish bias and would signal downside continuation.
🧠 Final Notes
• 98.00 is the line in the sand for short-term direction
• Blue path is valid only on confirmed breakout; orange path is trend aligned
• Let price action at this key level confirm before committing
XAUUSD 4Hour TF - August 3rd,2025🟦 XAUUSD 4H Analysis Long Idea
📅 August 3rd, 2025
🔹 Top-Down Trend Bias:
• Monthly – Bullish
• Weekly – Bullish
• Daily – Bullish
• 4H – Bullish
Price has broken out of a consolidation, confirming short term bullish momentum in alignment with the higher timeframes. We’re now watching how price reacts on a potential retest of the key $3,320 structure.
🔍 Key Level: $3,320
This former resistance now acts as a critical support zone. How price reacts here will determine short-term direction.
✅ Scenario A: Bullish Continuation
Clean retest of $3,320–$3,335
1.Look for bullish confirmation: wick rejections, bullish engulfing, or lower timeframe structure shift
Target 1: $3,395
Target 2: $3,450
This setup aligns with the overall bullish bias. We have ideal R:R with a clear invalidation to exit on if $3,320 fails as support.
⚠️ Scenario B: Bearish Rejection
1.Failure to hold $3,320 = potential trap breakout
2.Look for structure below $3,320 + bearish conviction
Target: $3,225 support zone
Only valid if $3,320 flips to resistance and confirms structure shift.
🧠 Final Notes
• Let price confirm the setup
• Structure > emotion
• Both scenarios are valid, but only with confirmation

EURJPY 4hour TF - August 3rd,2025🟦 EURJPY 4H Analysis Bearish Idea
📅 August 3, 2025
🔹 Top-Down Trend Bias:
• Monthly – Bullish
• Weekly – Bullish
• Daily – Bullish
• 4H – Bearish
EURJPY has pulled back through the previous support zone around 171.000 and is currently consolidating after a sharp bearish move. Short term trend remains bearish, but higher timeframes suggest this may be a corrective phase.
🔍 Key Zone: 171.00 – 171.70
This zone represents the 38.2% fib retracement and prior structure. A rejection from this area could trigger further downside, while a break above may confirm a higher low.
✅ Scenario A: Bearish Continuation (Blue Path)
1.If price taps into 171.00–171.70 and rejects
2.Look for bearish confirmation (rejection wick, bearish engulfing, BOS)
Target: 169.60 (key support)
This setup follows short term momentum and offers clean R:R into prior liquidity.
⚠️ Scenario B: Bullish Break & Hold (Orange Path)
1.If price breaks and closes above 172.250
2.Watch for continuation toward 173.750, our extended fib target
3.Structure shift + bullish PA would align with HTF bullish trend
This would confirm strength returning to the pair, ideal for HTF trend continuation traders.
🧠 Final Notes
• 171.00–171.70 is the reaction zone to watch
• HTFs remain bullish, but 4H momentum must flip to validate upside
• Let price confirm direction

USDJPY 4Hour TF - August 3rd, 2025🟦 USDJPY 4H Analysis Bullish Idea
📅 August 3, 2025
🔹 Top-Down Trend Bias:
• Monthly – Bullish
• Weekly – Bearish
• Daily – Bullish
• 4H – Bearish
USDJPY has retraced sharply from local highs, breaking down into prior support near 147.50. Short term structure has shifted bearish, but higher timeframes still lean bullish making this a key reaction zone to monitor.
🔍 Key Zone: 147.00 – 147.50
This zone sits at a prior key support zone. How price reacts here will determine whether the pair resumes its bullish leg or continues deeper.
✅ Scenario A: Bullish Rejection (Blue Path)
1.If price holds above 147.00–147.50 and prints bullish confirmation
2.Look for continuation toward 151.50
Target: 151.50 (next clean resistance zone)
This setup aligns with the HTF bullish trend. Clean break of structure and bullish reactions are needed for confirmation.
⚠️ Scenario B: Bearish Breakdown (Orange Path)
1.If price breaks and closes below 147.500 zone
2.Watch for lower high + retest rejection
Target: 145.00 support zone
This is a lower probability counter trend continuation but is possible if price action presents the needed confirmations.
🧠 Final Notes
• Price is at a decision point, wait for Price action confirmation
• HTF bias leans bullish, but 4H structure must shift back up
• Trade with structure, not against it

AUDJPY 4Hour TF - August 3rd,2025🟦 AUDJPY 4H Analysis Bearish Idea
📅 August 3rd, 2025
🔹 Top-Down Trend Bias:
• Monthly – Bullish
• Weekly – Bullish
• Daily – Bullish
• 4H – Bearish
AUDJPY has broken cleanly below prior structure around 96.15, signaling short term bearish momentum within a higher timeframe bullish environment. Price is currently approaching key decision zones.
🔍 Key Zone: 96.15 – 96.45
This former support zone may now act as a bearish retest area and new resistance. This offers a potential entry for continuation plays if structure holds below.
✅ Scenario A: Bearish Continuation (Blue Path)
1.If price retests and rejects from 96.15–96.45
2.Look for bearish confirmation (rejection wicks, engulfing, LTF structure shift)
Target: 94.50
This setup is trend aligned with current 4H momentum and offers a clean structure based downside.
⚠️ Scenario B: Bullish Reclaim (Orange Path)
1.If price breaks and holds above 96.45
2.Could signal a shift back toward higher timeframe bullish continuation
Target: 97.20 resistance zone
This is a counter-trend idea on the 4H and requires confirmation
🧠 Final Notes
• Short-term bearish bias while price remains below 96.45
• Let the retest confirm the direction
• Clean structure = clean setups
AUDUSD 4Hour TF - August 3rd,2025🟦 AUDUSD 4H Analysis Bearish Idea
📅 August 3, 2025
🔹 Top-Down Trend Bias:
• Monthly – Bearish
• Weekly – Bearish
• Daily – Bearish
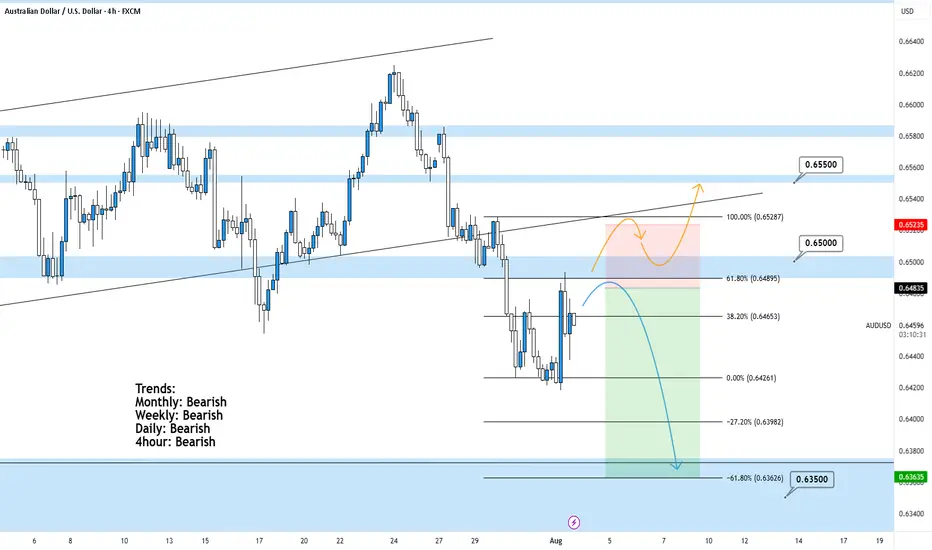
• 4H – Bearish
AUDUSD remains in a clear downtrend across all major timeframes. Current price action shows a corrective move off recent lows but all signs point to this being a temporary pullback, not a reversal.
🔍 Key Zone: 0.6485 – 0.6528
This zone aligns with the 61.8% fib retracement, and previous structure making it a high probability rejection area.
✅ Scenario A: Bearish Continuation (Blue Path)
1.If price taps into 0.6485–0.6525 and rejects
2.Look for bearish confirmation (engulfing, lower high, break of structure)
Target 1: 0.6426 (previous low)
Target 2: 0.6398
Extended Target: 0.6350
This is the trend following setup, most probable given full HTF alignment.
⚠️ Scenario B: Bullish Breakout (Orange Path)
If price breaks and closes above 0.65000
1.Could signal short term shift with upside potential toward 0.6550
2.However, this is a counter-trend idea and lower probability unless higher timeframes begin shifting
🧠 Final Notes
• Bias remains bearish until proven otherwise
• Watch for confirmation at the fib/trendline confluence zone
• Patience > prediction
DXY 4Hour TF - August 3rd,2025🟦 DXY 4H Analysis Neutral idea
📅 August 3, 2025
🔹 Top-Down Trend Bias:
• Monthly – Bearish
• Weekly – Bearish
• Daily – Bearish
• 4H – Bullish
The dollar index is in a larger bearish cycle but just bounced from near-term resistance around 100.250. While the 4H shows temporary strength, we’re trading into major resistance and we may see it short lived.
🔍 Key Levels to Watch
• Support: 98.00
• Resistance Zones: 99.25 and 100.25
• 61.8% Fib: 98.57
Price is currently testing structure after rejecting from the 100.25 resistance zone. This area remains a strong ceiling unless the higher timeframe structure shifts.
✅ Scenario A: Bearish Continuation (Blue Path)
1. Bearish Structure confirmation below the current zone
2.If bearish rejection confirms, expect price to continue toward 98.00, possibly 97.50
3.Clean confluence with the higher timeframe trend
⚠️ Scenario B: Bullish Extension (Orange Path)
1.If price breaks and holds above 99.25, we may see a continuation toward 100.25
2.Short-term bullish strength, but against HTF bias
3.Must treat as a counter-trend idea unless confirmed with HTF structure shift
🧠 Final Notes
• 98.50 is the key decision zone, watch reaction closely
• Trend remains bearish on all major timeframes
• Don’t force the long, lean bearish unless structure proves otherwise
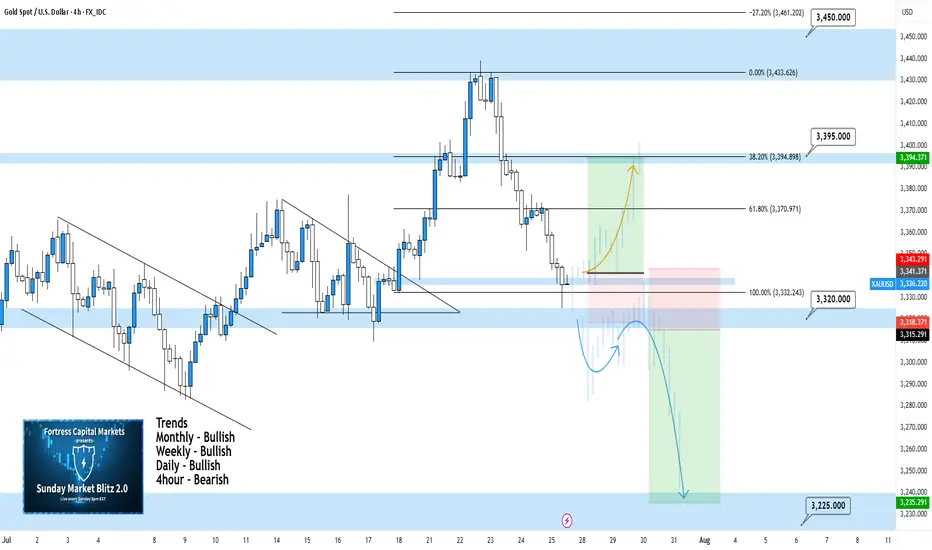
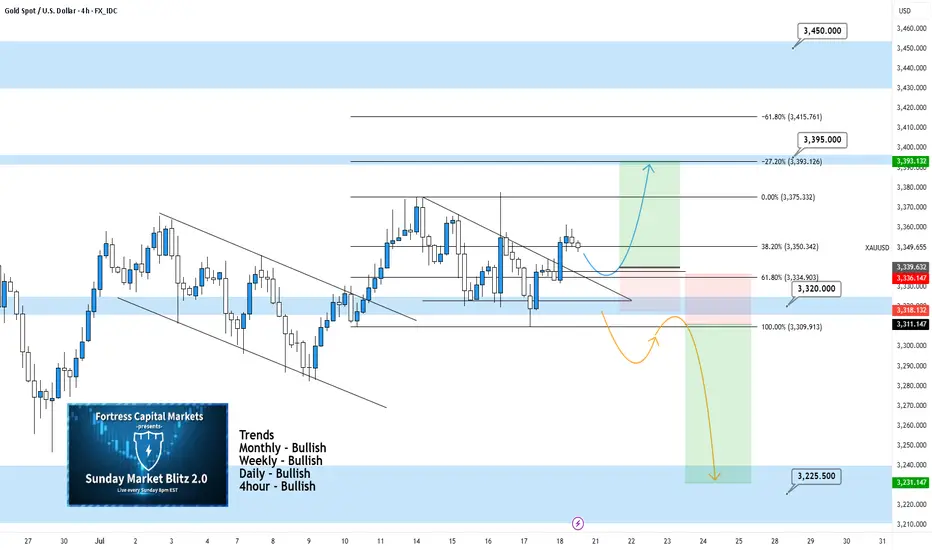
XAUUSD 4Hour TF - July 27th, 2025XAUUSD 7/27/2025
XAUUSD 4 hour Neutral Idea
Monthly - Bullish
Weekly - Bullish
Daily - Bullish
4hour - Bearish
Last week we saw a perfect setup playout and then it retraced 100% to close out the week. This is looking more bearish on the 4Hour timeframe now but we need to see how price action reacts at the 3,320 support zone first.
Here are two potential scenarios we want to see for the week ahead.
Bullish Reversal - If we are to see gold as bullish again we would ideally like to see some consolidation at the current level followed by strong bullish conviction.
We need to see convincing price action before we can begin targeting higher. Consolidation + Bullish conviction will be our best chance at a long position.
Bearish Continuation - The 4hour sure looks bearish but will it sustain? Looking ahead into the week we want to see price action push below 3,320 with bearish structure below.
I would also like to see a pattern or a few hours to a day of consolidation below 3,320. If this happens we can begin to target lower toward major support levels like 3,225.
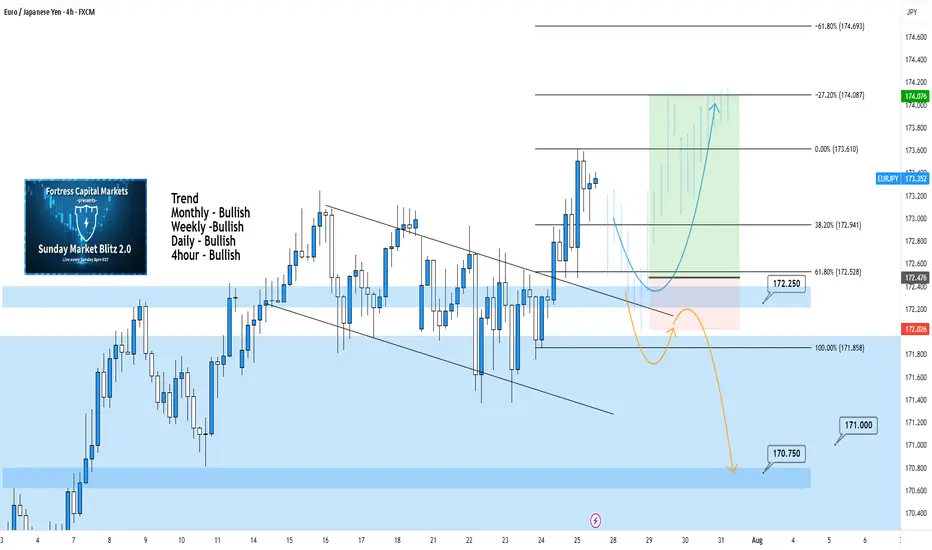
EURJPY 4Hour TF - July 27th, 2025EURJPY 7/27/2025
EURJPY 4hour Bullish Idea
Monthly - Bullish
Weekly - Bullish
Daily - Bullish
4hour - Bullish
All timeframes suggest we are bullish and after last week that is clear. We’re expecting a bit of a pullback but let’s get into two potential setups for the week ahead:
Bullish Continuation - If we are to continue with the bullish trend we would like to enter a trade at the next point of structure. In this scenario, the next point of structure would be a higher low as close to 172.250 support & our 61.8% fib level as possible.
Look to target higher toward our -27% fib level if this happens.
Bearish Reversal - For us to consider EJ bearish again we would need to see a strong break below our support at 172.250.
If we see bearish structure below this zone we can say price action will most likely fall lower, potentially down to 170.750.
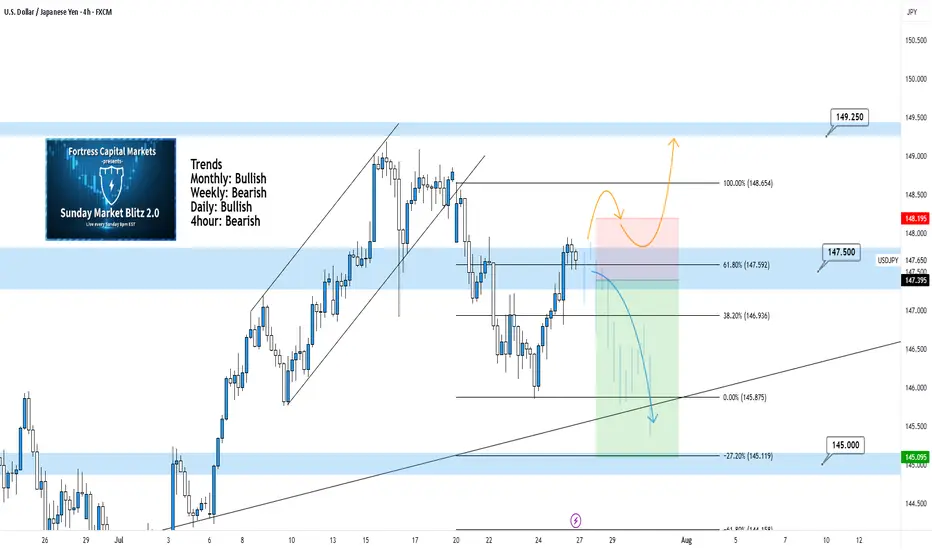
USDJPY 4Hour TF - July 27th, 2025USDJPY 7/27/2025
USDJPY 4Hour Neutral Idea
Monthly - Bullish
Weekly - Bearish
Daily - Bullish
4Hour - Bearish
We’re getting some mixed signals going into this week on UJ but it does look primarily bearish, especially after the move last week.
Currently price action is resting at 147.500 and we’re waiting to see if it will hold as resistance.
Here are two potential ways price action could play out for the week ahead:
Bearish Continuation - This is the most likely based on the context clues of last week. We’re clearly bearish and that lines up with the DXY bias at the moment.
For us to spot a confident short position on UJ we would need to see some bearish conviction coming off our 147.500 zone. We could see this happen after some consolidation or immediately so be cautious and be patient.
Bullish Reversal - This is the only bullish set up I'd be interested in if it plays out. We need to be convinced price action will move higher so I would need to see a significant push above 147.500 resistance with new structure in the form of higher low above. I’d look to target higher toward key levels of resistance if this happens.
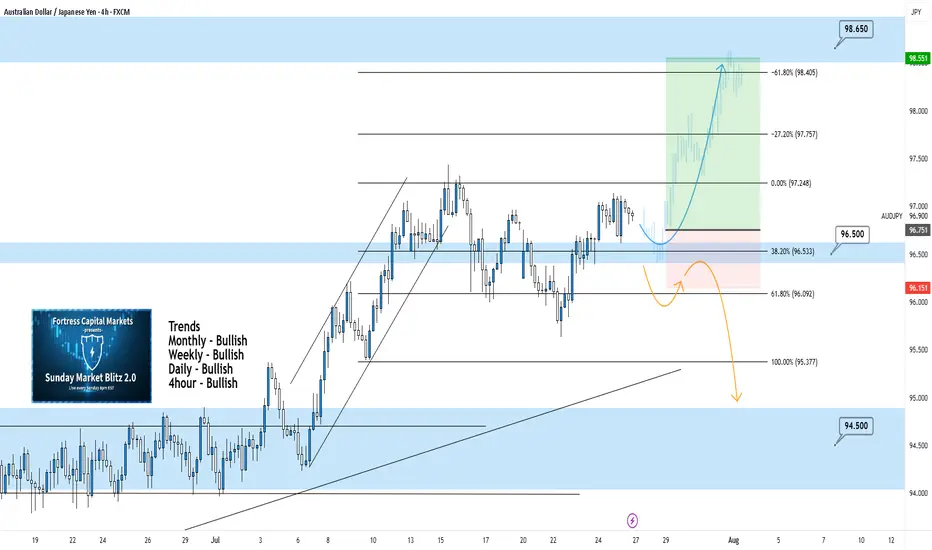
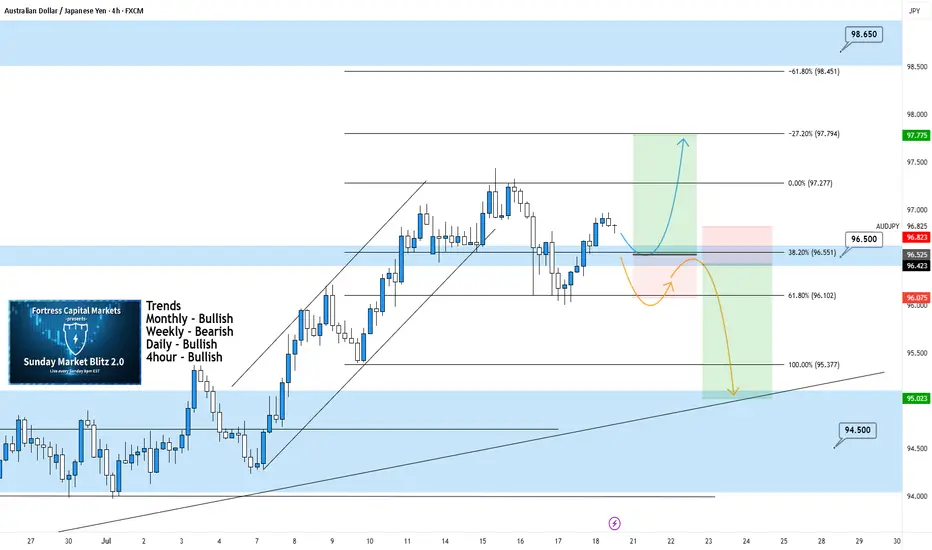
AUDJPY 4Hour TF - July 27th, 2025AUDJPY 7/27/2025
AUDJPY 4hour Bullish Idea
Monthly - Bullish
Weekly - Bullish
Dailly - Bullish
4hour - Bullish
We’re looking bullish again on AUDJPY for the week ahead, but will it stick? The overall higher timeframes suggest we are bullish as well but we will need to see key structure before entering any trades. Let’s take a look at two potential scenarios we would want to see happen this week.
Bullish Continuation - We ended last week in a perfect spot, right above our 96.500 zone. This leaves us in a position for a potential long opportunity where we only need to see 1 or two more forms of confirmation.
Look for our 96.500 zone to be tested and held as support. If this happens and we can confirm a higher low above 96.500 we’ll be looking to enter and target higher toward major levels of resistance like 98.650.
Bearish Reversal - For us to consider AJ bearish again we would need to see a strong break below the current zone at 96.500.
Look for signs of structure (LL, LH) to form below the current zone. If this happens we can consider targeting lower toward major levels of support like 94.500
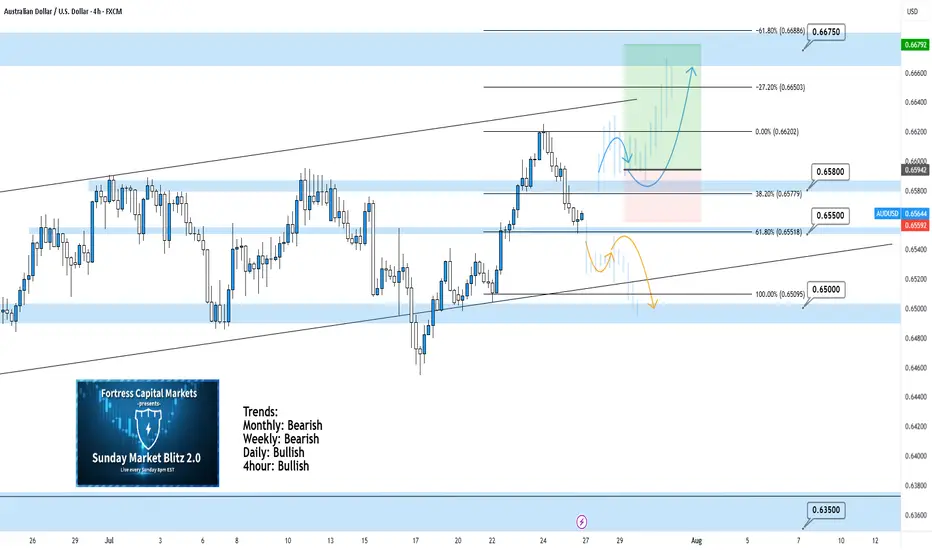
AUDUSD 4Hour TF - July 27th, 2025AUDUSD 7/27/2025
AUDUSD 4hour Bullish idea
Monthly - Bearish
Weekly - Bearish
Dailly - Bullish
4hour - Bullish
AUDUSD is holding steady in this weekly channel but has been showing signs of high volume ranging over the last month. Going into this week we’re looking mostly bullish but we have some minor zones that could slow price action down.
Here are two scenarios we are looking out for, for the week ahead:
Bullish Continuation - This is our ideal scenario as we want the trend to continue so we can have the best quality trade. For us to get comfortable going long AU we need to see structure above our 0.65800 zone. We want to see price action use this zone as support and establish structure (the next higher low).
If this happens we can look to target higher toward major resistance levels and key fib levels.
Bearish Reversal into range - If we fail to see bullish conviction at the current zone it’s possible price action will fall back into the range. This is a likely scenario as we have seen price action bounce between 0.65800 and 0.65000 multiple times over the last month.
I wouldn’t recommend trading this scenario as I don’t like trading ranges but we could see price action head lower to 0.65000.
DXY 4Hour TF - July 27, 2025DXY 7/27/2025
DXY 4hour Bearish Idea
Monthly - Bearish
Weekly - Bearish
Dailly - Bearish
4hour - Bearish
**We analyze DXY as an indicator of USD strength on a week to week basis**
This week is looking like we can expect bearish momentum on USD but here are two scenarios breaking down the potential:
Bearish Continuation - USD pulled a strong bearish reversal all last week which pushed us below our major 98.000 support zone.
We are now testing that same 98.000 zone as resistance and are looking to see if it will hold. Ideally, we can confirm further bearish structure to gain confidence in a bearish USD for the week ahead.
Bullish Reversal- For us to consider DXY as bullish again we would need to see bullish structure above our 98.000 zone. This would include: A break back above 98.000 with an established HH and HL.

XAUUSD 4Hour TF - July 20th, 2025XAUUSD 7/20/2025
XAUUSD 4 hour Long Idea
Monthly - Bullish
Weekly - Bullish
Daily - Bullish
4hour - Bullish
GOLD,GOLD,GOLD. This thing has been bullish on all timeframes and doesn’t really show any signs of stopping just yet.
We can see two scenarios for the week ahead so let’s dive in:
Bullish continuation - Price action on gold is breaking out of a descending triangle pattern. This is a strong bullish move but for us to consider trades we want the confirmation.
Look for a retest of our 61.8% fib level and mostly recently broken structure. If we can spot bullish conviction coming off this level we can then consider targeting higher resistance levels like 3.395.000. Our -27% fib level lines up with this zone as well.
Bearish Reversal - For us to consider Gold bearish again we would need to see something very convincing. If we did see a break below 3,320.000 with a confirmed lower high I would then consider short scenarios.
Look to target toward major support levels on the way down to 3,225.000, our next monthly support zone.
EURJPY 4Hour TF - July 20th, 2025EURJPY 7/20/2025
EURJPY 4hour Bullish Idea
Monthly - Bullish
Weekly - Bullish
Daily - Bullish
4hour - Bullish
Bullish Continuation - This is the most likely scenario for EJ this week as nothing suggests anything other than Bullish activity.
EJ could take off right at market open and start pushing up without giving us a retest to enter on. If we do get some sort of retest or pullback, look for rejection as close to 172.400 as possible before looking long.
If this does execute it looks like it will be a very small window of opportunity to enter. Trade cautiously with EJ in this bullish scenario.
Bearish Reversal - This scenario is less likely but is much more favorable in my opinion.
For us to consider EJ bearish we would need to see a clear break below 172.400 with a lower high below. This would give us enough confidence to consider short scenarios and start looking lower toward major support levels like 170.750.

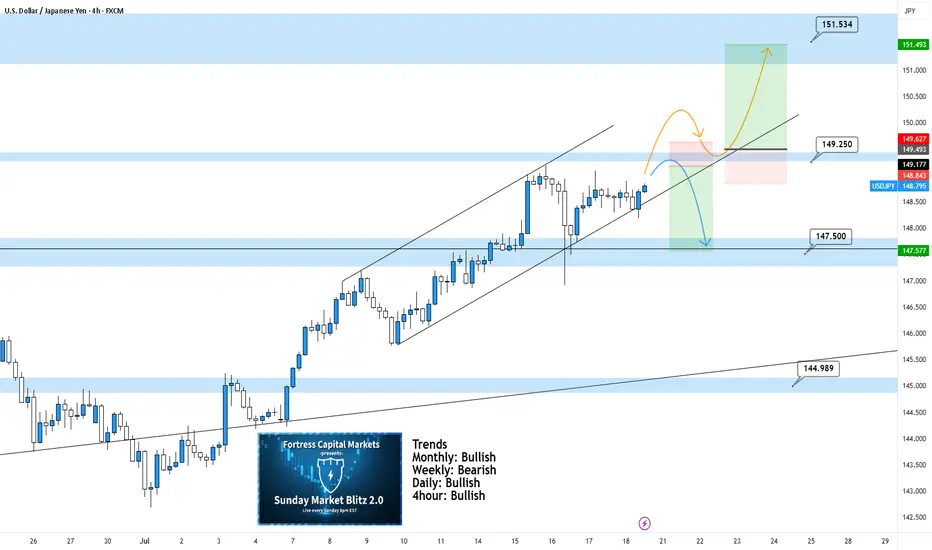
USDJPY 4Hour TF - July 20th,2025USDJPY 7/20/2025
USDJPY 4Hour Neutral Idea
Monthly - Bullish
Weekly - Bearish
Daily - Bullish
4Hour - Bullish
UJ is looking better than a couple weeks ago and at least we can spot some decent setups for the week ahead. These are NOT perfect setups but we have two scenarios that we are ready for if price action shows it is ready too. Here are the two scenarios we’re looking at for the week:
Bullish Continuation - We can see UJ in a nice 4hour channel but we are currently seeing a bit of flat price action. For us to consider UJ long setups again we would need to be convinced. Look for a break above our 149.250 zone with a confirmed higher low above. This would be enough to consider longs and target higher toward key levels of resistance.
Bearish Reversal - If price action continues to stall, this bearish setup will become more and more likely. Ideally, we want to see some strong rejection from our 149.250. If this happens look to target lower toward 147.500.
AUDJPY 4Hour TF - July 20th,2025AUDJPY 7/20/2025
AUDJPY 4hour Bullish Idea
Monthly - Bullish
Weekly - Bearish
Dailly - Bullish
4hour - Bullish
We’re looking mostly bullish on AJ going into this week but will this 96.500 hold as support? Let’s take a look at two potential scenarios for the week ahead:
Bullish Continuation - This is the most likely for AU this week according to the trends in play. For us to get confident in long scenarios, we would like to see strong bullish rejection from support around 96.500. If this happens look to target higher toward our negative fib levels and key resistance.
Bearish Reversal - For us to consider AJ bearish for the week, we would need to see some bearish pressure step in and push us below 96.500. If this happens we only need confirmation in the form of a lower high below 96.500.
Look to target lower toward major support levels like 94.500 area if this happens.
AUDUSD 4Hour TF - July 20th, 2025AUDUSD 7/20/2025
AUDUSD 4hour Neutral idea
Monthly - Bearish
Weekly - Bearish
Dailly - Bullish
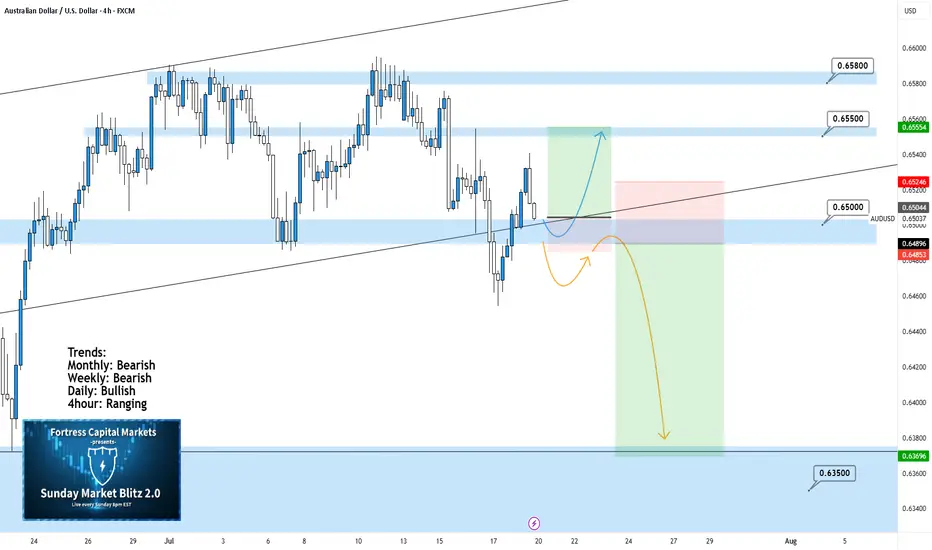
4hour - Ranging
We’re looking at a fairly large range here on AU and although the higher timeframe suggests a potential bearish move, I am unsure until we have some clarity around 0.65000. Here are two scenarios that break down what could happen this week and how 0.65000 plays into it:
Range Continuation - Since late June we have seen price action establish this large range and stick to it (0.65800 Resistance & 0.65000 Support).
Currently, we can see price action attempting to break 0.65000 support but it has not done so yet. If we don’t break below 0.65000 early this week it is very likely we will see a rally into the top of the range.
Bearish Breakout - This is the setup we want to see play out this week as it presents a beauty of a trade.
For us to see AU as bearish on the 4hour we need to see a clear break below 0.65000 with a confirmed lower high below. If this happens look to target toward major support levels like 0.63500 area.