NIFTY KEY LEVELS FOR 19.08.2025NIFTY KEY LEVELS FOR 19.08.2025
Sorry for the delayed post..
If the candle stays above the pivot point, it is considered a bullish bias; if it remains below, it indicates a bearish bias. Price may reverse near Resistance 1 or Support 1. If it moves further, the next potential reversal zone is near Resistance 2 or Support 2. If these levels are also broken, we can expect the trend.
If the range(R2-S2) is narrow, the market may become volatile or trend strongly. If the range is wide, the market is more likely to remain sideways
📢 Disclaimer
I am not a SEBI-registered financial adviser.
The information, views, and ideas shared here are purely for educational and informational purposes only. They are not intended as investment advice or a recommendation to buy, sell, or hold any financial instruments.
Please consult with your SEBI-registered financial advisor before making any trading or investment decisions.
Trading and investing in the stock market involves risk, and you should do your own research and analysis. You are solely responsible for any decisions made based on this research.
Niftyoutlook

GST related jump; Auto, Consumption & others breaks market slumpThere was some positive game changing news required to break the market slump which was provided by honourable PM in his Independence day speech. Now exact GST slots and how the same is implemented is yet to be seen. There was some negative news as well as EU and Ukraine and US do not seem to be on the same page with respect to ceasefire between Russia and Ukraine. So still there are some Global issues which are yet to be answered.
Additionally the Tariff war in general and with respect to India is not yet solved. Additionally the Trade talks between India and US have gone for a toss with next meeting which was to happen later this month has been postponed indefinitely. Thus the signal is not clear cut green. So once the GST Euphoria subsides there can be consolidation/correction again so traders have to be cautious. Long term investors can see this as an opportunity for reshuffling Portfolio in line with local consumption related stocks. Some of the Auto stocks have gone absolutely in the 5th gear. Consumption is heating up, Finance and Baking, Insurance, realty and FMCG can also join the band wagon along with Infra and capital goods in future. IT, Oil &Gas, Power can take a back seat for now but might join the band wagon if up move persists.
Overall what we saw today was a good up move. If Nifty is able to clear key resistances we can see strong up move across the sectors. If not so there can be further consolidation and sectoral rotation. Things are in balance right now. Predicting next move is difficult but certainly it was a good day on browsers.
Major events are unfolding but clarity will be there once the dust settles. Now the Nifty supports and resistances are as under:
Nifty supports remain at: 24810 (Father line of Hourly chart), 24746, 24671 (Mother line of Hourly chart), 24534 and 24334.
Nifty Resistances Remain at: 24995, 25116, 25246 (Trend Line Resistance above which Bulls will be comfortable), 25405, 25544 and finally 25639.
Disclaimer: The above information is provided for educational purpose, analysis and paper trading only. Please don't treat this as a buy or sell recommendation for the stock or index. The Techno-Funda analysis is based on data that is more than 3 months old. Supports and Resistances are determined by historic past peaks and Valley in the chart. Many other indicators and patterns like EMA, RSI, MACD, Volumes, Fibonacci, parallel channel etc. use historic data which is 3 months or older cyclical points. There is no guarantee they will work in future as markets are highly volatile and swings in prices are also due to macro and micro factors based on actions taken by the company as well as region and global events. Equity investment is subject to risks. I or my clients or family members might have positions in the stocks that we mention in our educational posts. We will not be responsible for any Profit or loss that may occur due to any financial decision taken based on any data provided in this message. Do consult your investment advisor before taking any financial decisions. Stop losses should be an important part of any investment in equity.

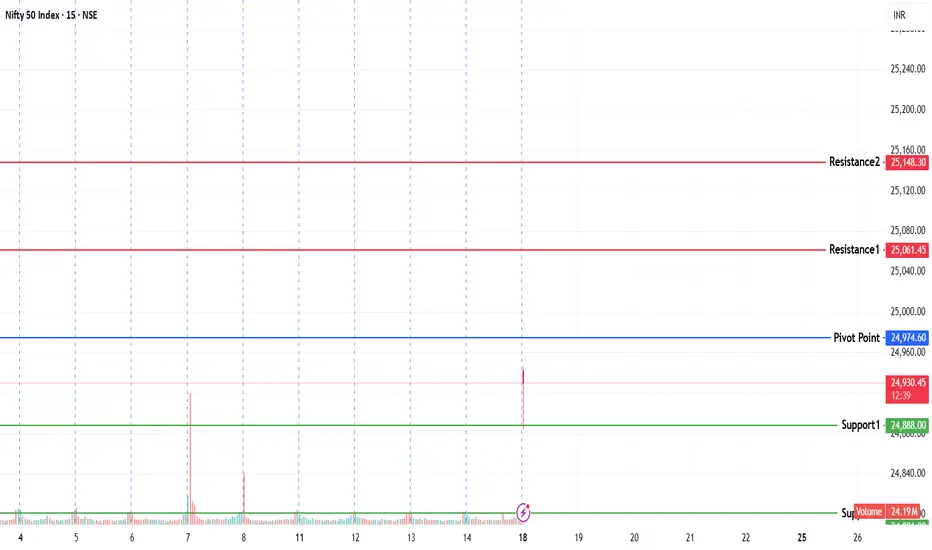
NIFTY KEY LEVELS FOR 18.08.2025NIFTY KEY LEVELS FOR 18.08.2025
If the candle stays above the pivot point, it is considered a bullish bias; if it remains below, it indicates a bearish bias. Price may reverse near Resistance 1 or Support 1. If it moves further, the next potential reversal zone is near Resistance 2 or Support 2. If these levels are also broken, we can expect the trend.
If the range(R2-S2) is narrow, the market may become volatile or trend strongly. If the range is wide, the market is more likely to remain sideways
📢 Disclaimer
I am not a SEBI-registered financial adviser.
The information, views, and ideas shared here are purely for educational and informational purposes only. They are not intended as investment advice or a recommendation to buy, sell, or hold any financial instruments.
Please consult with your SEBI-registered financial advisor before making any trading or investment decisions.
Trading and investing in the stock market involves risk, and you should do your own research and analysis. You are solely responsible for any decisions made based on this research.
GST Reforms + Cooling Inflation: Can Nifty Aim for 25,800..?🚀 Nifty 50: Breakout + Big Policy Boost ?
📉 Technical View
Nifty 50 has broken out of its downward channel and is testing higher levels.
* Key resistance: 24,850 🔑
* If sustained & retested → next target: 25,800 🎯
This could mark the start of a fresh bullish leg if momentum holds.
📊 Macro Tailwinds
* Inflation cools off ➝ July CPI at 1.55% (lowest since June 2017) 😮
* Food inflation at -1.76%, down from -1.06% in June.
👉 Softening inflation = stronger spending power + supportive environment 📈
📰 Policy Catalyst: GST Reforms by Diwali 2025
PM Modi’s Independence Day speech highlighted “Next-Gen GST Reforms” 🇮🇳:
* 12% GST slab ➝ may shift to 5% 💡
* 28% GST slab ➝ may shift to 18% 📉
* New 40% slab for sin goods (tobacco, beer, etc.) 🚬🍺
➡️ Could lighten tax burden, stimulate consumption, and lift corporate profits.
⚡ Takeaway
Technical breakout + cooling inflation + GST reforms = constructive setup for Nifty 50.
* Watch 24,850 carefully → breakout & retest opens gates to 25,800.
📌 Note: Global risk remains. Trump’s proposed additional tariffs could hinder the trend and inject volatility 🌍⚠️.

Nifty Rebounds After Six-Week Fall, Consolidation Continues● Nifty finally ended its six-week losing run, closing the week with a 1.10% gain despite trading in a narrow range.
● Volatility inched higher, with India VIX rising 2.68% to 12.35, reflecting a slightly elevated risk perception, though it remains comfortably low.
● On the technical front, the 24,300–24,400 zone is likely to act as immediate support, while resistance is seen at 24,700–24,800.
● Heading into nest expiry, the index is expected to remain in a neutral phase as it continues to consolidate below key resistance levels. Without a decisive breakout, aggressive buying should be avoided.
● Traders are advised to closely monitor price action around these key levels and manage risk carefully while planning trades.
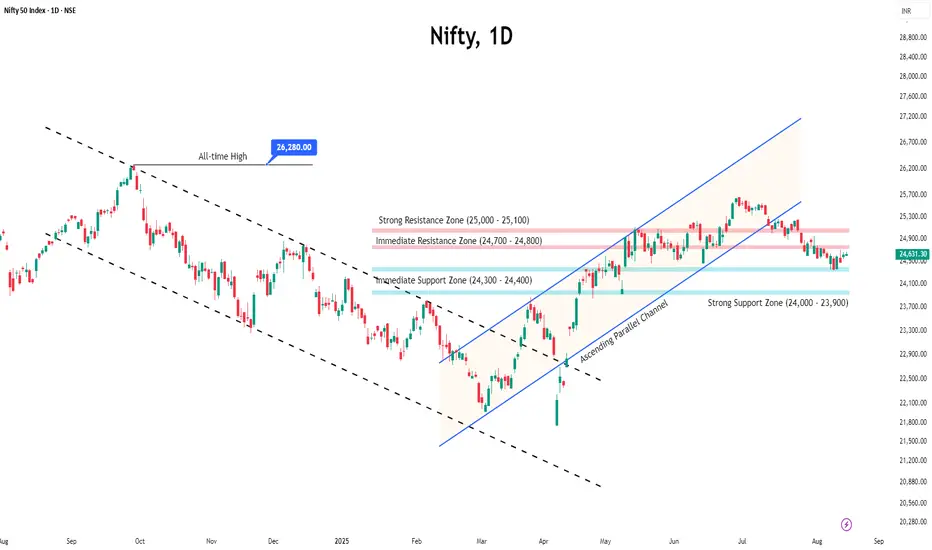
Wkly Market Wrap – Nifty Breaks Losing Streak, Bulls Eye 25,100Nifty closed the week at 24,631, up 270 points from last week’s close, after hitting a high of 24,702 and a low of 24,347. As I highlighted in last week’s outlook, Nifty once again respected my range of 24,800–23,900 to the dot.
After five straight weeks of red, we finally saw a green weekly close—a much-needed breather for the bulls. But remember, this is the first pullback after a prolonged downtrend, so sellers are likely to make another attempt to drag the markets lower.
📌 Key levels for next week:
Support: 24,300 – If bulls defend this level, we could see a rally toward 25,000–25,100.
Resistance: 25,100 – Strong selling pressure likely here.
Even if 24,300 breaks, I don’t expect Nifty to slip below 24,200–24,150 this week.
💡 Opportunity Alert: For those who’ve been patiently waiting for a dip to enter, this week could present a good buying window—possibly followed by another opportunity by the second week of September. Have your list of fundamentally strong stocks ready to pounce.
Global Cue – S&P 500 on Fire
The S&P 500 once again closed at a new all-time high of 6,468, and the momentum suggests it’s on track to test the key Fibonacci level of 6,568. If you’re invested in the US markets, trail your stop-loss to 6,200 to safeguard profits.
Bulls are back in the game, but sellers haven’t left the field—next week will be all about who controls the pitch!

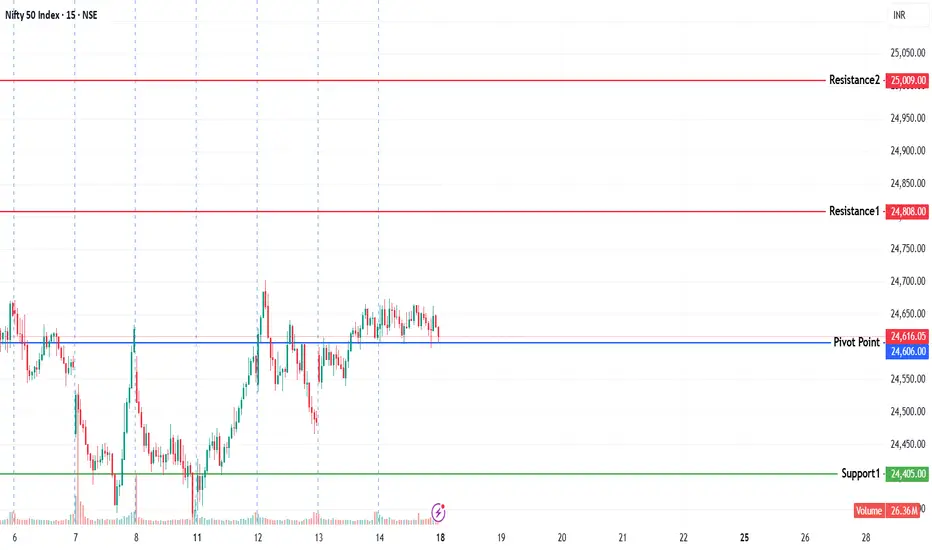
Nifty Weekly Outlook (15–21 August 2025)Nifty Weekly Outlook (15–21 August 2025)
Above pivot = bullish bias.
Below pivot = bearish bias.
Watch for reversals near R1/S1, then R2/S2, and finally R3/S3 if levels break.
📢 Disclaimer
I am not a SEBI-registered financial adviser.
The information, views, and ideas shared here are purely for educational and informational purposes only. They are not intended as investment advice or a recommendation to buy, sell, or hold any financial instruments.
Please consult with your SEBI-registered financial advisor before making any trading or investment decisions.
Trading and investing in the stock market involves risk, and you should do your own research and analysis. You are solely responsible for any decisions made based on this research.
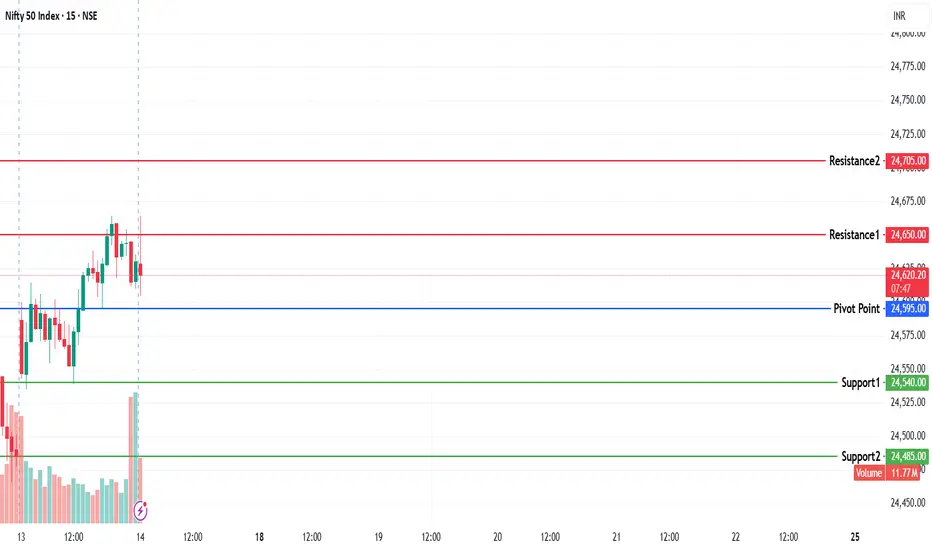
NIFTY KEY LEVELS FOR 14.08.2025NIFTY KEY LEVELS FOR 14.08.2025
If the candle stays above the pivot point, it is considered a bullish bias; if it remains below, it indicates a bearish bias. Price may reverse near Resistance 1 or Support 1. If it moves further, the next potential reversal zone is near Resistance 2 or Support 2. If these levels are also broken, we can expect the trend.
If the range(R2-S2) is narrow, the market may become volatile or trend strongly. If the range is wide, the market is more likely to remain sideways
📢 Disclaimer
I am not a SEBI-registered financial adviser.
The information, views, and ideas shared here are purely for educational and informational purposes only. They are not intended as investment advice or a recommendation to buy, sell, or hold any financial instruments.
Please consult with your SEBI-registered financial advisor before making any trading or investment decisions.
Trading and investing in the stock market involves risk, and you should do your own research and analysis. You are solely responsible for any decisions made based on this research.
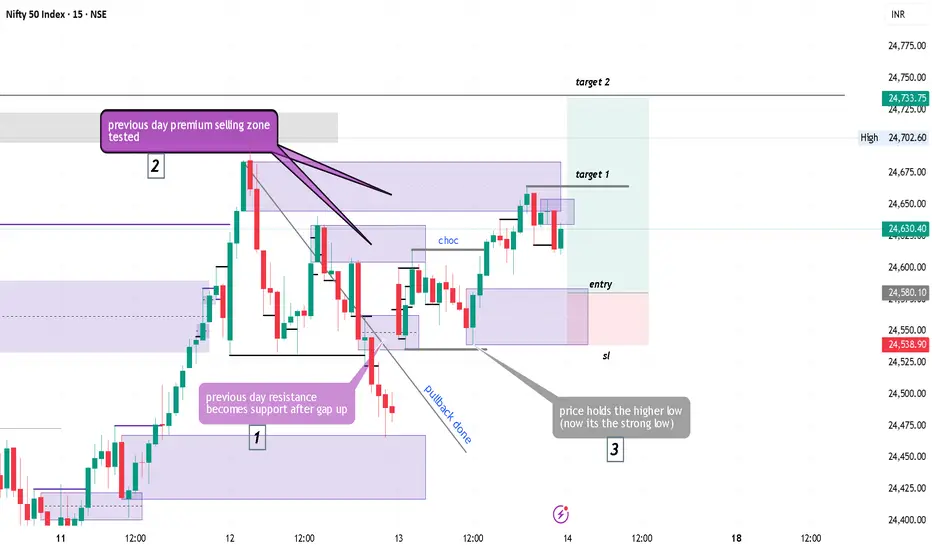
Nifty50 trade Technical Analysis for tomorrow (14 aug)As the market opened on 13 August, it gapped up above Resistance #1, directly entering the premium zone. The resistance, marked as (1), has now turned into support.
Following this, point (2) shows that the remaining supply zones were tested. However, the price did not break the day’s low of 24,538 and instead formed a swing structure favoring the long side. Based on this, our bias for tomorrow remains bullish.
Towards the close, the price tested the top supply zone on the 15-minute chart and showed signs of a pullback. This suggests that the price is likely to retrace into the new demand zone, which lies around the 24,583–24,538 area.
The strong low formed on 13 August is expected to hold. However, since the market is dynamic, it is best to wait for the price to enter the zone and reject bearish pressure before making any moves.
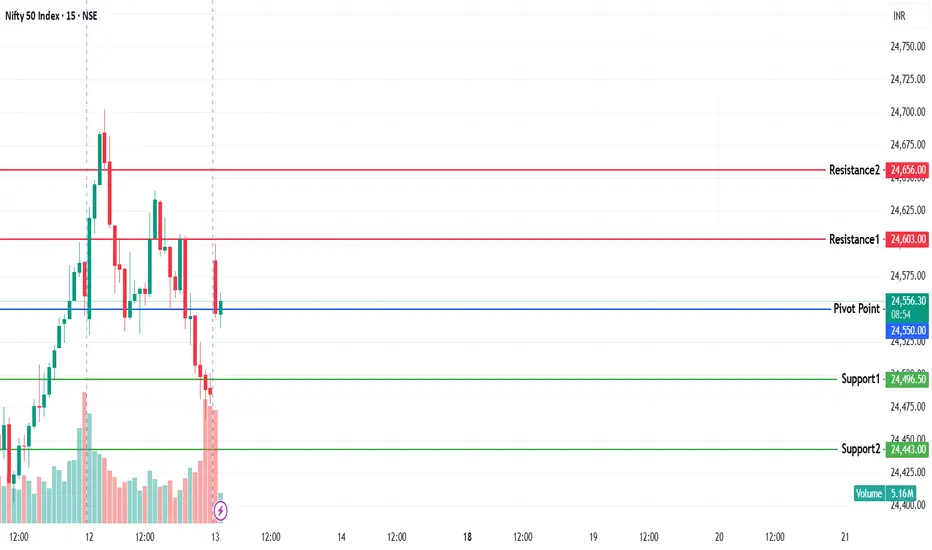
NIFTY KEY LEVELS FOR 13.08.2025NIFTY KEY LEVELS FOR 13.08.2025
If the candle stays above the pivot point, it is considered a bullish bias; if it remains below, it indicates a bearish bias. Price may reverse near Resistance 1 or Support 1. If it moves further, the next potential reversal zone is near Resistance 2 or Support 2. If these levels are also broken, we can expect the trend.
If the range(R2-S2) is narrow, the market may become volatile or trend strongly. If the range is wide, the market is more likely to remain sideways
📢 Disclaimer
I am not a SEBI-registered financial adviser.
The information, views, and ideas shared here are purely for educational and informational purposes only. They are not intended as investment advice or a recommendation to buy, sell, or hold any financial instruments.
Please consult with your SEBI-registered financial advisor before making any trading or investment decisions.
Trading and investing in the stock market involves risk, and you should do your own research and analysis. You are solely responsible for any decisions made based on this research.
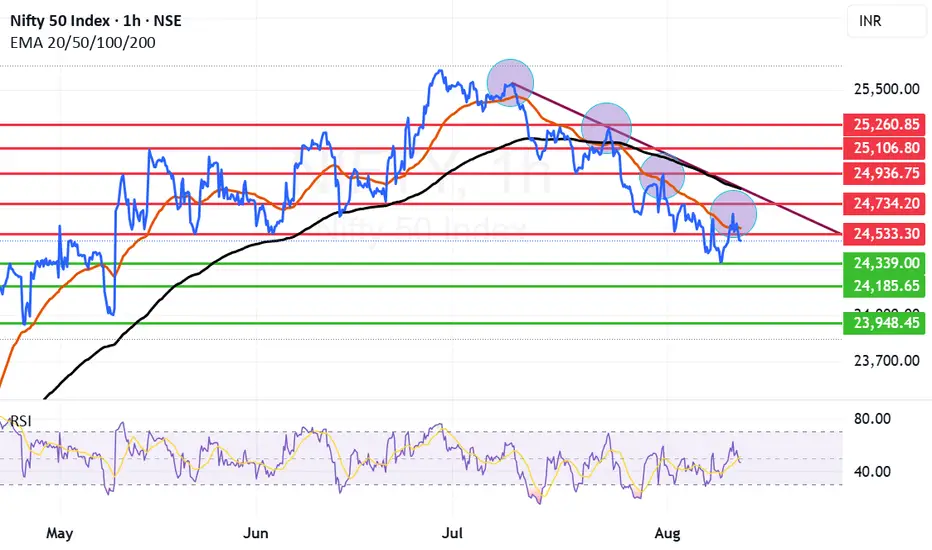
Lower High Lower Low forming in Nifty showing overall weakness. Today market showed some positive intent by reaching 24702 but could not sustain the levels and fell flat to close at 24487 giving up 215 points from the top. This proves that Nifty is continuously failing to sustain the momentum and after making a high seems to be plunging further and further. It seems to have become sell on bounce market. Every bounce is used by investors to exit theri positions. This is leads us into he current formation of lower highs and lower lows.
A change in pattern and formation is required for the market to go back to bullishness. The market seems to be waiting for some good news on Tariff front to spur the interest of retail investors. For this to happen a closing above the trend line is required. Right now market remains in a bear grip. Long term investors and dividend investors have an extended time to buy some stocks available at good value focus should be on the stocks that can maximize returns when the Bull rally begins. Buy in parts do not go all in at once as this market can present buying opportunities time and again.
Supports for Nifty remain at: 24339, 24185 and 23948. (Market may fall into total Bear grip if we get a closing below 23948.)
Resistances for Nifty remain at: 24566 (Mother line resistance of an hourly chart), 24734, 24829 (Father line resistance). 24936, 25106 and finally 25260. (Bulls will control the market after we get a weekly closing above 25260).
Disclaimer: The above information is provided for educational purpose, analysis and paper trading only. Please don't treat this as a buy or sell recommendation for the stock or index. The Techno-Funda analysis is based on data that is more than 3 months old. Supports and Resistances are determined by historic past peaks and Valley in the chart. Many other indicators and patterns like EMA, RSI, MACD, Volumes, Fibonacci, parallel channel etc. use historic data which is 3 months or older cyclical points. There is no guarantee they will work in future as markets are highly volatile and swings in prices are also due to macro and micro factors based on actions taken by the company as well as region and global events. Equity investment is subject to risks. I or my clients or family members might have positions in the stocks that we mention in our educational posts. We will not be responsible for any Profit or loss that may occur due to any financial decision taken based on any data provided in this message. Do consult your investment advisor before taking any financial decisions. Stop losses should be an important part of any investment in equity.
NIFTY KEY LEVELS FOR 12.08.2025NIFTY KEY LEVELS FOR 12.08.2025
If the candle stays above the pivot point, it is considered a bullish bias; if it remains below, it indicates a bearish bias. Price may reverse near Resistance 1 or Support 1. If it moves further, the next potential reversal zone is near Resistance 2 or Support 2. If these levels are also broken, we can expect the trend.
If the range(R2-S2) is narrow, the market may become volatile or trend strongly. If the range is wide, the market is more likely to remain sideways
📢 Disclaimer
I am not a SEBI-registered financial adviser.
The information, views, and ideas shared here are purely for educational and informational purposes only. They are not intended as investment advice or a recommendation to buy, sell, or hold any financial instruments.
Please consult with your SEBI-registered financial advisor before making any trading or investment decisions.
Trading and investing in the stock market involves risk, and you should do your own research and analysis. You are solely responsible for any decisions made based on this research.

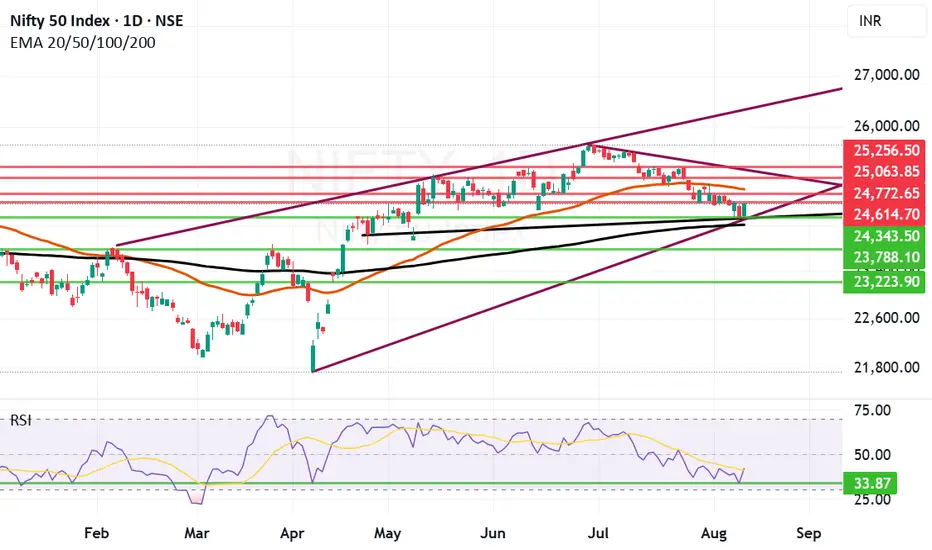
Good Bounce by Nifty from Technical RSI Support zone. We saw a good comeback and bounce by Nifty from a Technical RSI support zone which is around 33. We can by no means call this start of a Bull rally as of now. For Bull Rally to sustain we need a closing on Nifty above 24842. In such a scenario if we get a closing above 24842 the Bulls will feel comfortable. Bulls can breath easy only after we get a closing above 25256 zone. Above 25256 the Bulls can take control of the market. With Nuclear threats flowing around and still Tariff related issues prevailing it looks difficult for Bulls to take proper control of the market. The bounce we saw today can be credited to few reasons mentioned below:
1) Government announcement to support the sectors that will be most affected by Tariffs.
2) Some noises from within the Government to increase the spending to compensate for the GDP loss due to Tariff situation.
3) Silver lining in the clouds which are showing due to the upcoming Trump-Putin talks, Indian PM's proposed China visit.
4) RBI has allowed Indian banks to open special Vostro accounts to facilitate international trade settlements. (However if this has built positive sentiment is something which is yet to be fully understood). Also I am not an expert to understand the framework under which these accounts will work or how it will benefit our companies is a matter of economic experts to study.
With all this buildup the supports for Nifty remain at: 24343 and 24204. Below 24204 closing or weekly closing the Bears will take total control of the market and drag Nifty below 24K towards 23788 or 23223. Most important support remains at 24204 (Father line Support of Daily charts).
Nifty Resistances remain at: 24614, 24772, 25063 and finally 25256. Above 25256 Bulls can take control of the market and we will comment above further levels when we get there.
Disclaimer: The above information is provided for educational purpose, analysis and paper trading only. Please don't treat this as a buy or sell recommendation for the stock or index. The Techno-Funda analysis is based on data that is more than 3 months old. Supports and Resistances are determined by historic past peaks and Valley in the chart. Many other indicators and patterns like EMA, RSI, MACD, Volumes, Fibonacci, parallel channel etc. use historic data which is 3 months or older cyclical points. There is no guarantee they will work in future as markets are highly volatile and swings in prices are also due to macro and micro factors based on actions taken by the company as well as region and global events. Equity investment is subject to risks. I or my clients or family members might have positions in the stocks that we mention in our educational posts. We will not be responsible for any Profit or loss that may occur due to any financial decision taken based on any data provided in this message. Do consult your investment advisor before taking any financial decisions. Stop losses should be an important part of any investment in equity.
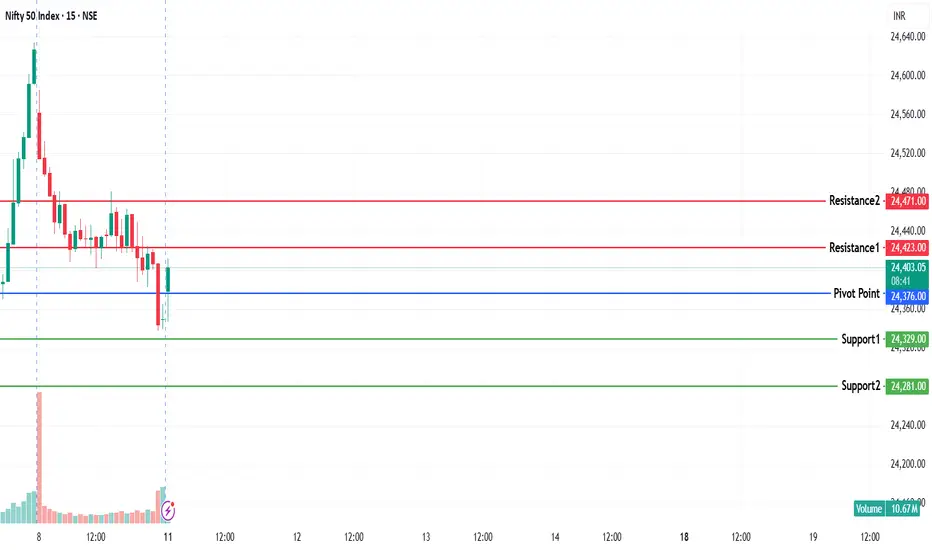
NIFTY KEY LEVELS FOR 11.08.2025NIFTY KEY LEVELS FOR 11.08.2025
If the candle stays above the pivot point, it is considered a bullish bias; if it remains below, it indicates a bearish bias. Price may reverse near Resistance 1 or Support 1. If it moves further, the next potential reversal zone is near Resistance 2 or Support 2. If these levels are also broken, we can expect the trend.
If the range(R2-S2) is narrow, the market may become volatile or trend strongly. If the range is wide, the market is more likely to remain sideways
📢 Disclaimer
I am not a SEBI-registered financial adviser.
The information, views, and ideas shared here are purely for educational and informational purposes only. They are not intended as investment advice or a recommendation to buy, sell, or hold any financial instruments.
Please consult with your SEBI-registered financial advisor before making any trading or investment decisions.
Trading and investing in the stock market involves risk, and you should do your own research and analysis. You are solely responsible for any decisions made based on this research.
Weekly Market Outlook – Nifty & S&P 500 AnalysisNifty closed the week at 24,363, down 200 points from the previous week’s close, after making a high of 24,736 and a low of 24,337. As highlighted last week, Nifty traded exactly within my projected range of 25,000–24,100, but the negative takeaway is that it has now closed below the crucial support of 24,400.
If Nifty sustains below 24,300 next week, there is a strong probability of it testing 24,000/23,900 support levels. My outlook for the coming week: expect movement within 24,800–23,900, with a potential bounce from 24,000/23,900.
Interestingly, this marks the 6th consecutive week of Nifty closing lower — something that last happened 12 years ago in August 2013. Historically, after five straight weeks of selling, we usually see at least one green candle. If that bounce comes next week, my focus will be on whether selling resumes afterward or finally takes a breather.
Remember the timeless stock market wisdom:
“When everyone is fearful, be greedy. When everyone is greedy, be fearful.”
For long-term investors waiting for a dip, the opportunity is here — consider accumulating fundamentally strong companies for the long haul. Traders, brace for volatility.
S&P 500 Outlook:
The S&P 500 closed 150 points higher than last week, validating my prediction of holding 6,200. On the weekly chart, the index is showing signs of forming an M-pattern — a bearish setup. To negate this, the S&P 500 must sustain above 6,400, which could extend its rally towards 6,454/6,500 and the key Fibonacci level of 6,568.
However, if it fails to hold 6,400, we could see a retest of 6,225. Investors in U.S. markets should trail their stop-losses to protect gains.
Key Levels to Watch Next Week:
Nifty: Support – 24,000/23,900 | Resistance – 24,800
S&P 500: Support – 6,225 | Resistance – 6,454/6,500/6,568

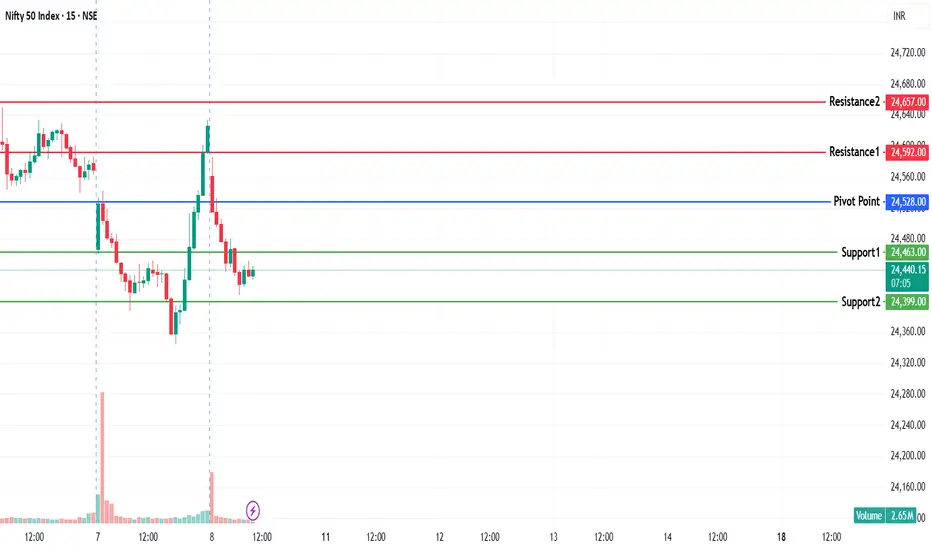
NIFTY KEY LEVELS FOR 08.08.2025NIFTY KEY LEVELS FOR 08.08.2025
Apologies for the delay in sharing this..
If the candle stays above the pivot point, it is considered a bullish bias; if it remains below, it indicates a bearish bias. Price may reverse near Resistance 1 or Support 1. If it moves further, the next potential reversal zone is near Resistance 2 or Support 2. If these levels are also broken, we can expect the trend.
If the range(R2-S2) is narrow, the market may become volatile or trend strongly. If the range is wide, the market is more likely to remain sideways
📢 Disclaimer
I am not a SEBI-registered financial adviser.
The information, views, and ideas shared here are purely for educational and informational purposes only. They are not intended as investment advice or a recommendation to buy, sell, or hold any financial instruments.
Please consult with your SEBI-registered financial advisor before making any trading or investment decisions.
Trading and investing in the stock market involves risk, and you should do your own research and analysis. You are solely responsible for any decisions made based on this research.
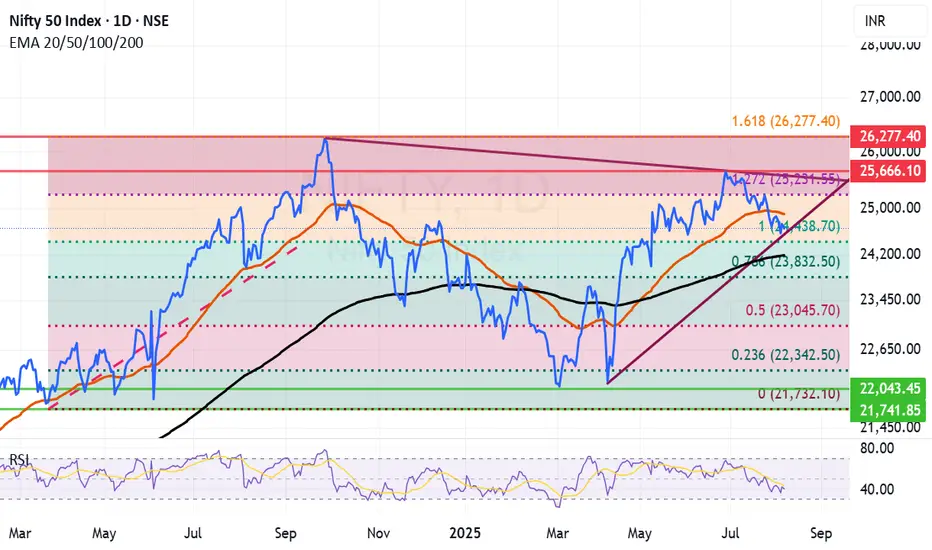
important Fibonacci retracement level approaching for NiftyVery important fibonacci retracement level for Nifty is arriving with ever increasing Trump tantrum and Indian defiance to toe US and EU line on Russian Crude and other trade practises. Market looks delicately placed at this juncture as investors fear that action from the West would undermine Indian growth story. The current fall can be utilized for shifting the balance of the portfolio towards goods that will be 100% made in India and will be consumed in India. For long term investors the current fall can be used to accumulate long term investment ideas with a horizon of 2 to 3 years.
Supports for Nifty remain at: 24438 (Important Fibonacci support), 24190 (Father line support, closing below this will enable bears to pull down Nifty towards next supports), 23832 (Next Fibonacci support), 23045 (Major Fibonacci support).
Resistance for Nifty remain at: 24896 (Mother Line Support), 25231 (Next Fibonacci resistance. A closing above this level will enable bulls to pull Nifty towards next trend line resistance), 25666 (Next Trend line resistance).
Disclaimer: The above information is provided for educational purpose, analysis and paper trading only. Please don't treat this as a buy or sell recommendation for the stock or index. The Techno-Funda analysis is based on data that is more than 3 months old. Supports and Resistances are determined by historic past peaks and Valley in the chart. Many other indicators and patterns like EMA, RSI, MACD, Volumes, Fibonacci, parallel channel etc. use historic data which is 3 months or older cyclical points. There is no guarantee they will work in future as markets are highly volatile and swings in prices are also due to macro and micro factors based on actions taken by the company as well as region and global events. Equity investment is subject to risks. I or my clients or family members might have positions in the stocks that we mention in our educational posts. We will not be responsible for any Profit or loss that may occur due to any financial decision taken based on any data provided in this message. Do consult your investment advisor before taking any financial decisions. Stop losses should be an important part of any investment in equity.
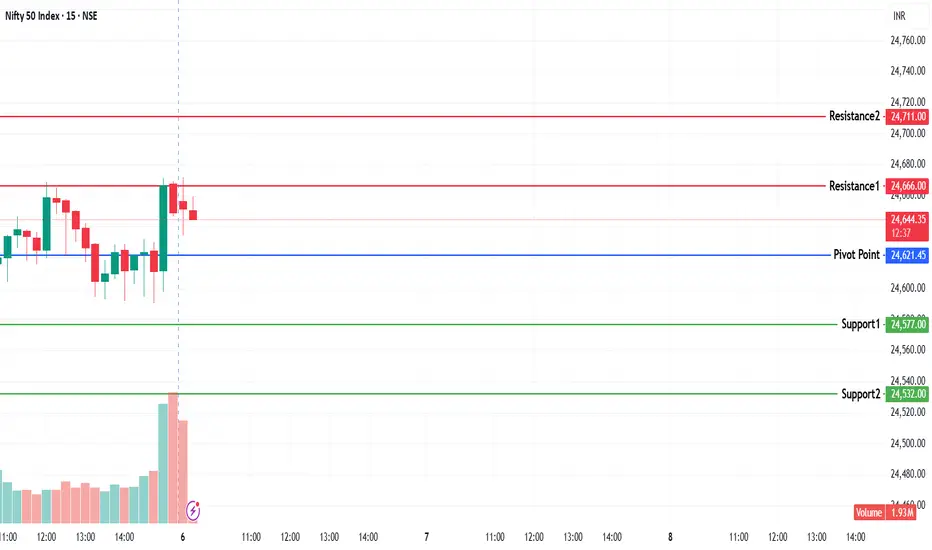
NIFTY KEY LEVELS FOR 07.08.2025NIFTY KEY LEVELS FOR 07.08.2025
If the candle stays above the pivot point, it is considered a bullish bias; if it remains below, it indicates a bearish bias. Price may reverse near Resistance 1 or Support 1. If it moves further, the next potential reversal zone is near Resistance 2 or Support 2. If these levels are also broken, we can expect the trend.
If the range(R2-S2) is narrow, the market may become volatile or trend strongly. If the range is wide, the market is more likely to remain sideways
📢 Disclaimer
I am not a SEBI-registered financial adviser.
The information, views, and ideas shared here are purely for educational and informational purposes only. They are not intended as investment advice or a recommendation to buy, sell, or hold any financial instruments.
Please consult with your SEBI-registered financial advisor before making any trading or investment decisions.
Trading and investing in the stock market involves risk, and you should do your own research and analysis. You are solely responsible for any decisions made based on this research.
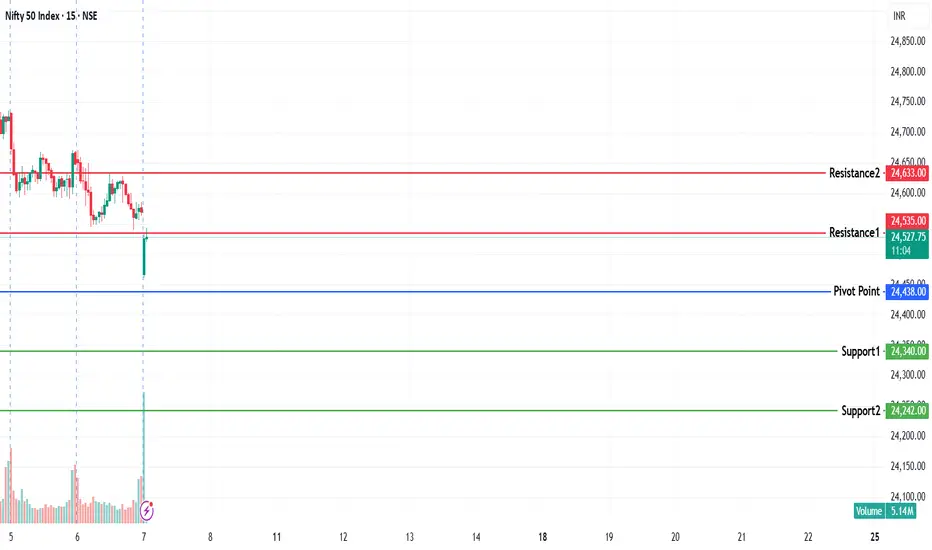
NIFTY KEY LEVELS FOR 06.08.2025NIFTY KEY LEVELS FOR 06.08.2025
If the candle stays above the pivot point, it is considered a bullish bias; if it remains below, it indicates a bearish bias. Price may reverse near Resistance 1 or Support 1. If it moves further, the next potential reversal zone is near Resistance 2 or Support 2. If these levels are also broken, we can expect the trend.
If the range(R2-S2) is narrow, the market may become volatile or trend strongly. If the range is wide, the market is more likely to remain sideways
📢 Disclaimer
I am not a SEBI-registered financial adviser.
The information, views, and ideas shared here are purely for educational and informational purposes only. They are not intended as investment advice or a recommendation to buy, sell, or hold any financial instruments.
Please consult with your SEBI-registered financial advisor before making any trading or investment decisions.
Trading and investing in the stock market involves risk, and you should do your own research and analysis. You are solely responsible for any decisions made based on this research.
Targets Achieved in NIFTY 50 THE RESULT
Follow for more Simple And accurate swing analysis on Indices, Currency, Commodities.

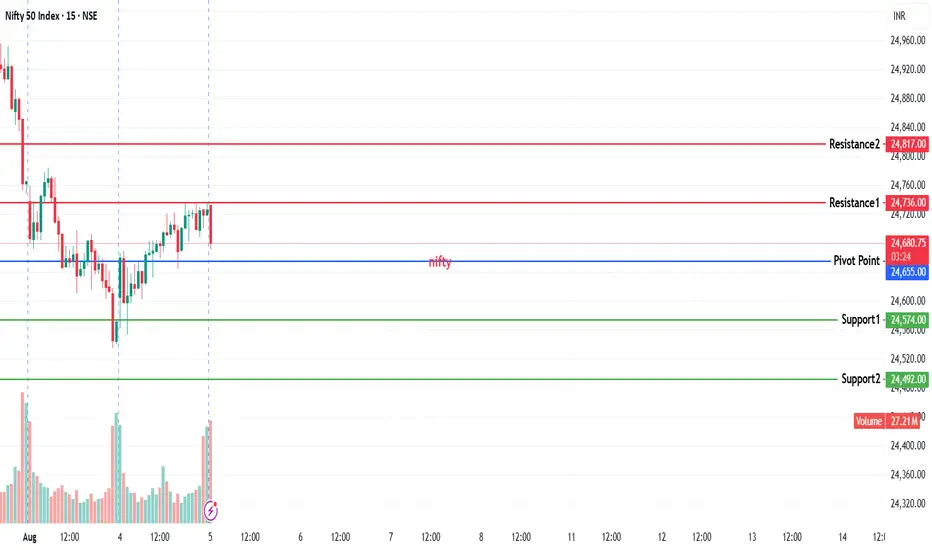
NIFTY KEY LEVELS FOR 05.08.2025NIFTY KEY LEVELS FOR 05.08.2025
If the candle stays above the pivot point, it is considered a bullish bias; if it remains below, it indicates a bearish bias. Price may reverse near Resistance 1 or Support 1. If it moves further, the next potential reversal zone is near Resistance 2 or Support 2. If these levels are also broken, we can expect the trend.
If the range(R2-S2) is narrow, the market may become volatile or trend strongly. If the range is wide, the market is more likely to remain sideways
📢 Disclaimer
I am not a SEBI-registered financial adviser.
The information, views, and ideas shared here are purely for educational and informational purposes only. They are not intended as investment advice or a recommendation to buy, sell, or hold any financial instruments.
Please consult with your SEBI-registered financial advisor before making any trading or investment decisions.
Trading and investing in the stock market involves risk, and you should do your own research and analysis. You are solely responsible for any decisions made based on this research.
Good comeback candle by Nifty today. Nifty fought back against the Tariff odds today and gained 157.4 points. The combination of Friday's candle and today's candle are forming a Bullish Harami kind of pattern. Harami in Japanese means pregnant woman. Usually this is a Bullish pattern but it requires a follow up positive candle in its support. So if we get a positive candle tomorrow then we can consider Friday's low as a good temporary support.
Supports for Nifty currently remain at: 24482 (Important Trend line resistance), 24317, 24186 (Father line support on daily chart), The zone between 23932 (final support, below this level Bears can take total control of the index).
Resistances for Nifty currently remain at: 24802, 24906 (Mother line resistance on daily chart), 25007, 25249-25346 (Important trend line resistance zone, a closing above 25346 will give control of the index to Bulls).
Disclaimer: The above information is provided for educational purpose, analysis and paper trading only. Please don't treat this as a buy or sell recommendation for the stock or index. The Techno-Funda analysis is based on data that is more than 3 months old. Supports and Resistances are determined by historic past peaks and Valley in the chart. Many other indicators and patterns like EMA, RSI, MACD, Volumes, Fibonacci, parallel channel etc. use historic data which is 3 months or older cyclical points. There is no guarantee they will work in future as markets are highly volatile and swings in prices are also due to macro and micro factors based on actions taken by the company as well as region and global events. Equity investment is subject to risks. I or my clients or family members might have positions in the stocks that we mention in our educational posts. We will not be responsible for any Profit or loss that may occur due to any financial decision taken based on any data provided in this message. Do consult your investment advisor before taking any financial decisions. Stop losses should be an important part of any investment in equity.

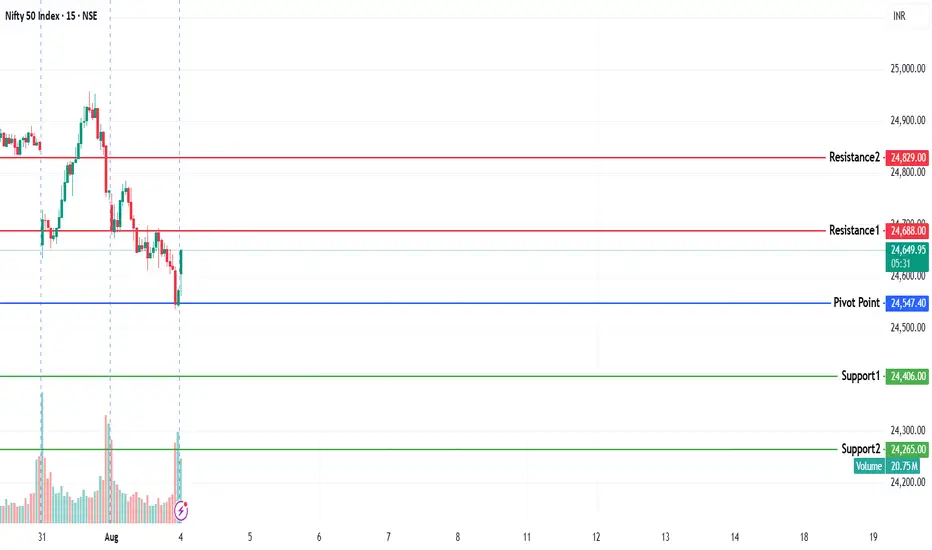
NIFTY KEY LEVELS FOR 04.08.2025NIFTY KEY LEVELS FOR 04.08.2025
If the candle stays above the pivot point, it is considered a bullish bias; if it remains below, it indicates a bearish bias. Price may reverse near Resistance 1 or Support 1. If it moves further, the next potential reversal zone is near Resistance 2 or Support 2. If these levels are also broken, we can expect the trend.
If the range(R2-S2) is narrow, the market may become volatile or trend strongly. If the range is wide, the market is more likely to remain sideways
📢 Disclaimer
I am not a SEBI-registered financial adviser.
The information, views, and ideas shared here are purely for educational and informational purposes only. They are not intended as investment advice or a recommendation to buy, sell, or hold any financial instruments.
Please consult with your SEBI-registered financial advisor before making any trading or investment decisions.
Trading and investing in the stock market involves risk, and you should do your own research and analysis. You are solely responsible for any decisions made based on this research.