After good start Nifty fizzles under trend line + Trump PressureAfter the announcements of GST reforms Nifty started the day with the bang reaching 24980 just short of 25K but selling pressure came immediately after Nifty hit the trend line resistance. Also Bears took the advantage of the rally to short the Nifty on account of Trump's fresh salvo of further increasing Tariffs on India in phase 2 and phase 3. The results of GST reforms will shortly start showing within a quarter or 2. The FMCG, Auto, Auto ancillaries, Insurance and health care, Consumption, Infrastructure and to some extent Capital Goods, Home appliances, Travel and Holiday will definitely get a boost in the long run.
It is not easy to close above Father line resistance if you have read my Mother Father and Small child theory you know that. If not you can read my book THE HAPPY CANDLES WAY TO WEALTH CREATION. The book is available on Amazon and is one of the highest rated books in the category.
Resistance for Nifty remain at: 24781 (Father line resistance), 24880, 24980 (Trend line resistance), 25081 and 25172. (Above this level Bulls will become more active).
Supports for Nifty remain at: 24700 (Mother line support), 24660 (Trend line support), 24515, 24397 and finally 24339 (Below this support there will be total bear grip).
Disclaimer: The above information is provided for educational purpose, analysis and paper trading only. Please don't treat this as a buy or sell recommendation for the stock or index. The Techno-Funda analysis is based on data that is more than 3 months old. Supports and Resistances are determined by historic past peaks and Valley in the chart. Many other indicators and patterns like EMA, RSI, MACD, Volumes, Fibonacci, parallel channel etc. use historic data which is 3 months or older cyclical points. There is no guarantee they will work in future as markets are highly volatile and swings in prices are also due to macro and micro factors based on actions taken by the company as well as region and global events. Equity investment is subject to risks. I or my clients or family members might have positions in the stocks that we mention in our educational posts. We will not be responsible for any Profit or loss that may occur due to any financial decision taken based on any data provided in this message. Do consult your investment advisor before taking any financial decisions. Stop losses should be an important part of any investment in equity.
Niftyresistances

Nifty is trying to break the cage to fly upwards. As you can see Nifty staged a recovery today and crossed the first hurdle that is the Mother line (50 Hours EMA) and closed about it. Not the 2 important hurdles staring at it are the trend line resistance at 24740 and Father line (200 Hours EMA) at 24780.
Bulls will be comfortable after we get a closing above these 2 hurdles. Once these hurdles are crossed we will find some resistances near 24917, 25029 and finally 25148.
The support zones for Nifty currently are at 24674 (Mother line support of 50 hours EMA), 24527 and finally 24339. Bears will control the market if we get a closing below 24339.
Disclaimer: The above information is provided for educational purpose, analysis and paper trading only. Please don't treat this as a buy or sell recommendation for the stock or index. The Techno-Funda analysis is based on data that is more than 3 months old. Supports and Resistances are determined by historic past peaks and Valley in the chart. Many other indicators and patterns like EMA, RSI, MACD, Volumes, Fibonacci, parallel channel etc. use historic data which is 3 months or older cyclical points. There is no guarantee they will work in future as markets are highly volatile and swings in prices are also due to macro and micro factors based on actions taken by the company as well as region and global events. Equity investment is subject to risks. I or my clients or family members might have positions in the stocks that we mention in our educational posts. We will not be responsible for any Profit or loss that may occur due to any financial decision taken based on any data provided in this message. Do consult your investment advisor before taking any financial decisions. Stop losses should be an important part of any investment in equity.

Nifty unable to cross Important Resistances today. Nifty failed to capitalise a good start today and fell sharply from highs of the day to close in the negative. Nifty today made a high of 24756 but closed 177 points below this level at 24759. This was due to a Trend line resistance near the day's high. It is a complex chart giving mixed signals but for further growth of Nifty it has to close above 3 important resistances which are at 24682 Mother line resistance of hourly chart, 24756 trend line resistance and finally 24790 which is the father line of hourly chart. If we get a closing above 24790 we can see further resistance at 24927 before Nifty is able to touch 25K again. Support for Nifty currently are at 24522, 24410 and 24336. If the support at 24336 is broken we will see further down side in Nifty.
Disclaimer: The above information is provided for educational purpose, analysis and paper trading only. Please don't treat this as a buy or sell recommendation for the stock or index. The Techno-Funda analysis is based on data that is more than 3 months old. Supports and Resistances are determined by historic past peaks and Valley in the chart. Many other indicators and patterns like EMA, RSI, MACD, Volumes, Fibonacci, parallel channel etc. use historic data which is 3 months or older cyclical points. There is no guarantee they will work in future as markets are highly volatile and swings in prices are also due to macro and micro factors based on actions taken by the company as well as region and global events. Equity investment is subject to risks. I or my clients or family members might have positions in the stocks that we mention in our educational posts. We will not be responsible for any Profit or loss that may occur due to any financial decision taken based on any data provided in this message. Do consult your investment advisor before taking any financial decisions. Stop losses should be an important part of any investment in equity.

Nifty delicately placed near resistance zones. Today we have seen Good recovery by Nifty on the back of extraordinary GDP numbers of 7.8% in the last Quarter. Now Nifty is delicately placed with chances of V shaped recovery if it can surpass 4 major hurdles,
The resistances are at Mid RSI channel resistance near 24640, Mother line resistance at 24690 (hourly chart), Trend line resistance near 24766 and Father line resistance near 24800 (hourly chart). If we get a closing above 24800 then the doors for 24927, 25015 and 25160 will open. Supports for Nifty currently are at 24504 and 24399. We have a very interesting week ahead with possibility of lot of volatility.
Disclaimer: The above information is provided for educational purpose, analysis and paper trading only. Please don't treat this as a buy or sell recommendation for the stock or index. The Techno-Funda analysis is based on data that is more than 3 months old. Supports and Resistances are determined by historic past peaks and Valley in the chart. Many other indicators and patterns like EMA, RSI, MACD, Volumes, Fibonacci, parallel channel etc. use historic data which is 3 months or older cyclical points. There is no guarantee they will work in future as markets are highly volatile and swings in prices are also due to macro and micro factors based on actions taken by the company as well as region and global events. Equity investment is subject to risks. I or my clients or family members might have positions in the stocks that we mention in our educational posts. We will not be responsible for any Profit or loss that may occur due to any financial decision taken based on any data provided in this message. Do consult your investment advisor before taking any financial decisions. Stop losses should be an important part of any investment in equity.

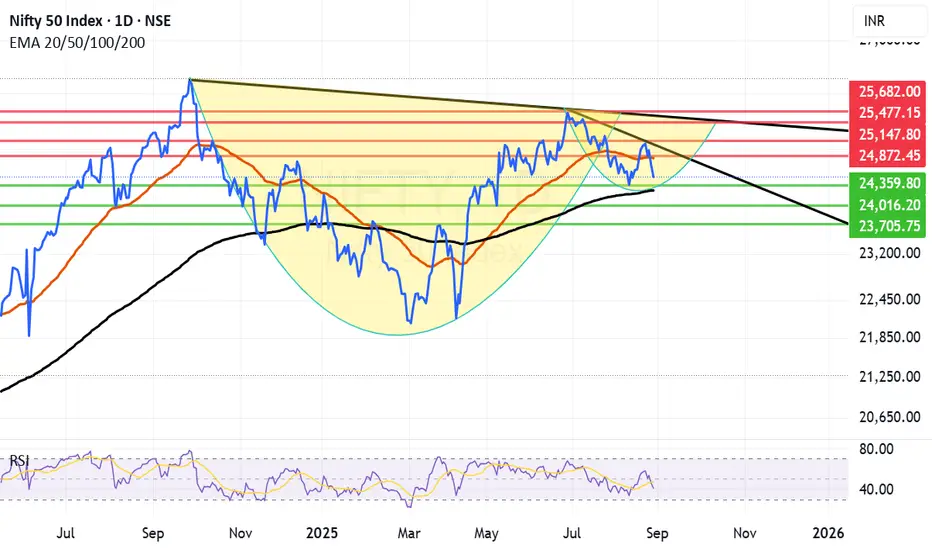
Nifty still in search of strong bottom. Nifty is still in search of a meaningful bottom to launch a fight back. Few support zones are arriving with monthly closing tomorrow Nifty was able to hold on to 24500 levels as it closed dot on that support. It is was a weak closing today indicating a firm bottom is not established yet. Thus further downside can not be ruled out.
The support zone for Nifty is between 24359 and 24266 as of now. 24266 is the Father line or 200 days EMA. If by chance we get a closing below 24359 the next support will be 24266. If 24266 is broken the next support for Nifty will be at 24016 or 23705.
The resistances for Nifty now remain at 24827 (Mother line resistance) and 24872 (Trend line resistance). Closing above 24872 will open the doors for 25147 and 25477. After closing above 25377 the major medium term resistance will be at 25682. Once we get there we will get a fair idea of levels ahead.
Long term chart of Nifty is still not that bad as it is indicating of a cup and handle breakout once we are able to close above 25682. Once we achieve that in next 1 or 2 quarters the doors for 26K and 27K will open. For that we need clarity on GST reduction proposal and Tariff related issue which is plaguing the markets. The Tariff jolt is massive but industry can overcome it in the long run by looking inwards on local consumption and exploring other overseas markets if US remains defiant in the long run.
As indicated by both US and Indian trade and commerce as well as foreign experts the issue will be eventually solved. Till then boost in local consumption / exploring other markets for India Inc. seems to be the only way out for Indian markets to recover. Long term investors should still look at investing holding on to their investments with a longer outlook. Even if there is a 0.5 or 1% reduction in GDP still India will continue to be a fastest growing market.
Years / Quarters and times like these test resolve of Investors but reward the patient handsomely. So patience is the key. Holding on and reshuffling the portfolio / Fresh investment during such phases always pays the mature investor. Always remember the Great man Warren Buffet's advice which goes like this, "Market is the device where money is transferred from the impatient to the patient."
Disclaimer: The above information is provided for educational purpose, analysis and paper trading only. Please don't treat this as a buy or sell recommendation for the stock or index. The Techno-Funda analysis is based on data that is more than 3 months old. Supports and Resistances are determined by historic past peaks and Valley in the chart. Many other indicators and patterns like EMA, RSI, MACD, Volumes, Fibonacci, parallel channel etc. use historic data which is 3 months or older cyclical points. There is no guarantee they will work in future as markets are highly volatile and swings in prices are also due to macro and micro factors based on actions taken by the company as well as region and global events. Equity investment is subject to risks. I or my clients or family members might have positions in the stocks that we mention in our educational posts. We will not be responsible for any Profit or loss that may occur due to any financial decision taken based on any data provided in this message. Do consult your investment advisor before taking any financial decisions. Stop losses should be an important part of any investment in equity.
Nifty in search of a bottom before Trump Tariff Deadline. Nifty nose dived more than 1% today as the deadline for additional Tariff implementation has arrived. With a market holiday tomorrow investor shorted their positions. The supports for Nifty travelling in the hourly parallel channel which is shown in the chart seem to be at 24689 and 24573. If we get a closing below 24573 then Nifty can fall further to 24351 or below. We are in the zone from where historical RSI support as you can see in the chart. This makes it possible for Nifty to fight back on Thursday and Friday if things go well on Political front and there is no further bad news.
In the scenario of Nifty fighting back the resistance for Nifty seems to be at 24776. If we get a closing above 24776 then there is a triple strong resistance zone between 24850 and 24939. This zone consists of 4 strong resistances which are mid-channel resistance, Mother line of hourly chart, father line of hourly chart and finally trend line resistance. Once we get a closing above 24939 the future resistances will be at 25013, 25127 and finally 25253. Above 25253 closing Bulls will be back in business.
Disclaimer: The above information is provided for educational purpose, analysis and paper trading only. Please don't treat this as a buy or sell recommendation for the stock or index. The Techno-Funda analysis is based on data that is more than 3 months old. Supports and Resistances are determined by historic past peaks and Valley in the chart. Many other indicators and patterns like EMA, RSI, MACD, Volumes, Fibonacci, parallel channel etc. use historic data which is 3 months or older cyclical points. There is no guarantee they will work in future as markets are highly volatile and swings in prices are also due to macro and micro factors based on actions taken by the company as well as region and global events. Equity investment is subject to risks. I or my clients or family members might have positions in the stocks that we mention in our educational posts. We will not be responsible for any Profit or loss that may occur due to any financial decision taken based on any data provided in this message. Do consult your investment advisor before taking any financial decisions. Stop losses should be an important part of any investment in equity.

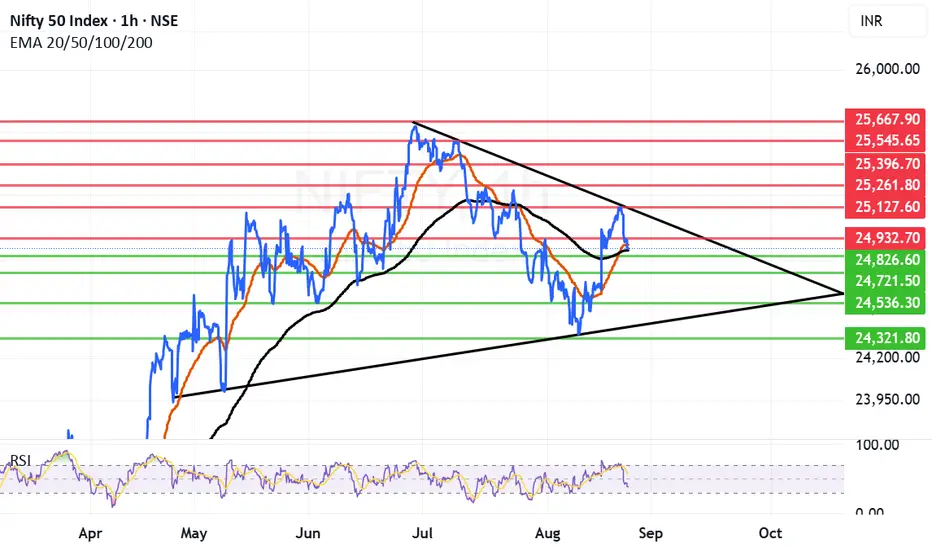
Trendline topples Nifty which is now searching for support now. Trendline resistance has toppled Nifty which is now searching for support from where it can launch a recovery. For a recovery Nifty has to find a firm support which can act as a launchpad again for next phase of move.
If the support is not found in the relevant support zone it can again fall in bear grip. The support zone nearby starts from 24857 (Father line) and a zone nearby which is at 24826. If we get a closing below 24826 then Nifty can fall towards 24721, 24536 or even 24321 levels. 24321 seems to be a strong trendline support.
If Nifty takes support near 24857 or 24826 then (Today's low was 24859) the Nifty can go upwards. In this scenario the resistances for Nifty will be at 24892 (Mother line Resistance), 24932, 25127 (trendline resistance), 25261, 25396, 25545 and finally 25667. After closing above 25261 the Bulls will be back in business.
Disclaimer: The above information is provided for educational purpose, analysis and paper trading only. Please don't treat this as a buy or sell recommendation for the stock or index. The Techno-Funda analysis is based on data that is more than 3 months old. Supports and Resistances are determined by historic past peaks and Valley in the chart. Many other indicators and patterns like EMA, RSI, MACD, Volumes, Fibonacci, parallel channel etc. use historic data which is 3 months or older cyclical points. There is no guarantee they will work in future as markets are highly volatile and swings in prices are also due to macro and micro factors based on actions taken by the company as well as region and global events. Equity investment is subject to risks. I or my clients or family members might have positions in the stocks that we mention in our educational posts. We will not be responsible for any Profit or loss that may occur due to any financial decision taken based on any data provided in this message. Do consult your investment advisor before taking any financial decisions. Stop losses should be an important part of any investment in equity.
Nifty showing strength but nearing key resistances now.Nifty had a good closing today up 103.7 points closing just below 25K at 24980.65. Things have taken a positive turn after the GST relief related announcement from GOI. Today Reliance did heavy lifting as it was up 2.84%.
Now the Nifty is entering a zone where there are few important hurdles. Once they are crossed there is a fair Chance of proper Bull run. The resistance in front of Nifty now are at 24992, 25042, 25133 and most importantly the zone between 25245 to 25328. Above 25328 there is strong Bullish territory.
The supports for Nifty remain at 24866, 24820 (Father Line support), 24742 (Mother line support). Below 24742 there can be further bearish weakness which can pull Nifty down towards 24573 or even 24341. (But that can happen only if we get a closing below 24742.
Right now the Nifty seems to be in Bullish mode with few resistances approaching.
Disclaimer: The above information is provided for educational purpose, analysis and paper trading only. Please don't treat this as a buy or sell recommendation for the stock or index. The Techno-Funda analysis is based on data that is more than 3 months old. Supports and Resistances are determined by historic past peaks and Valley in the chart. Many other indicators and patterns like EMA, RSI, MACD, Volumes, Fibonacci, parallel channel etc. use historic data which is 3 months or older cyclical points. There is no guarantee they will work in future as markets are highly volatile and swings in prices are also due to macro and micro factors based on actions taken by the company as well as region and global events. Equity investment is subject to risks. I or my clients or family members might have positions in the stocks that we mention in our educational posts. We will not be responsible for any Profit or loss that may occur due to any financial decision taken based on any data provided in this message. Do consult your investment advisor before taking any financial decisions. Stop losses should be an important part of any investment in equity.

GST related jump; Auto, Consumption & others breaks market slumpThere was some positive game changing news required to break the market slump which was provided by honourable PM in his Independence day speech. Now exact GST slots and how the same is implemented is yet to be seen. There was some negative news as well as EU and Ukraine and US do not seem to be on the same page with respect to ceasefire between Russia and Ukraine. So still there are some Global issues which are yet to be answered.
Additionally the Tariff war in general and with respect to India is not yet solved. Additionally the Trade talks between India and US have gone for a toss with next meeting which was to happen later this month has been postponed indefinitely. Thus the signal is not clear cut green. So once the GST Euphoria subsides there can be consolidation/correction again so traders have to be cautious. Long term investors can see this as an opportunity for reshuffling Portfolio in line with local consumption related stocks. Some of the Auto stocks have gone absolutely in the 5th gear. Consumption is heating up, Finance and Baking, Insurance, realty and FMCG can also join the band wagon along with Infra and capital goods in future. IT, Oil &Gas, Power can take a back seat for now but might join the band wagon if up move persists.
Overall what we saw today was a good up move. If Nifty is able to clear key resistances we can see strong up move across the sectors. If not so there can be further consolidation and sectoral rotation. Things are in balance right now. Predicting next move is difficult but certainly it was a good day on browsers.
Major events are unfolding but clarity will be there once the dust settles. Now the Nifty supports and resistances are as under:
Nifty supports remain at: 24810 (Father line of Hourly chart), 24746, 24671 (Mother line of Hourly chart), 24534 and 24334.
Nifty Resistances Remain at: 24995, 25116, 25246 (Trend Line Resistance above which Bulls will be comfortable), 25405, 25544 and finally 25639.
Disclaimer: The above information is provided for educational purpose, analysis and paper trading only. Please don't treat this as a buy or sell recommendation for the stock or index. The Techno-Funda analysis is based on data that is more than 3 months old. Supports and Resistances are determined by historic past peaks and Valley in the chart. Many other indicators and patterns like EMA, RSI, MACD, Volumes, Fibonacci, parallel channel etc. use historic data which is 3 months or older cyclical points. There is no guarantee they will work in future as markets are highly volatile and swings in prices are also due to macro and micro factors based on actions taken by the company as well as region and global events. Equity investment is subject to risks. I or my clients or family members might have positions in the stocks that we mention in our educational posts. We will not be responsible for any Profit or loss that may occur due to any financial decision taken based on any data provided in this message. Do consult your investment advisor before taking any financial decisions. Stop losses should be an important part of any investment in equity.

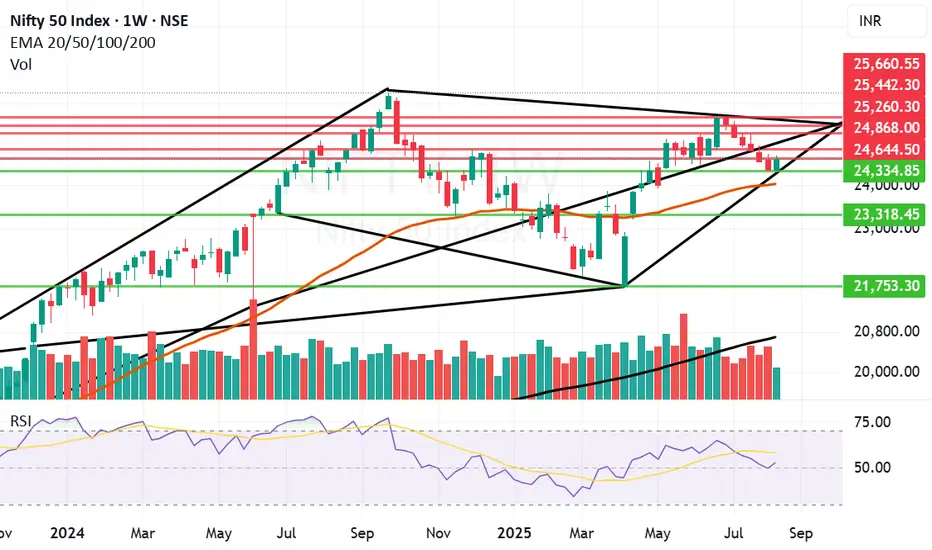
Nifty successful in breaking the falling pattern after 6 weeksNifty against all odds was successful in breaking the falling pattern after 6 weeks. However we are not out of danger yet. We need another positive weekly candle next week to confirm the reversal. As of now we do not know for sure that the low of last week that is 24337 is the bottom or bottom is yet to be made but anyway it was a great fight back against all odds of Trump Tariff Tantrum and the news of US's cozying up with our unfriendly neighbours.
Amongst all this noise the great news came this evening when S&P (Standard & Poor's global sovereign rating agency) which has changed outlook for India after 17 years this welcome change comes as India's rating improved to BBB from BBB- that is from Stable to Positive. This is for all the nay Sayers who doubted. India's long term outlook. The Tariff noise will go away in few weeks or months but Long term investors should look at buying and reshuffling the portfolios looking in tune with the tail winds.
Medium to short term supports and resistances for Nifty remain are as under:
With all this data coming in Support for Nifty remains at: 24334, 24032 (Mother line support of weekly chart), If this level is broken we may see Nifty falling temporarily towards 23318 or lower.
Resistances for Nifty remain at: 24644, 24868, 25260 (Key resistance level), 25442, 25660.
Disclaimer: The above information is provided for educational purpose, analysis and paper trading only. Please don't treat this as a buy or sell recommendation for the stock or index. The Techno-Funda analysis is based on data that is more than 3 months old. Supports and Resistances are determined by historic past peaks and Valley in the chart. Many other indicators and patterns like EMA, RSI, MACD, Volumes, Fibonacci, parallel channel etc. use historic data which is 3 months or older cyclical points. There is no guarantee they will work in future as markets are highly volatile and swings in prices are also due to macro and micro factors based on actions taken by the company as well as region and global events. Equity investment is subject to risks. I or my clients or family members might have positions in the stocks that we mention in our educational posts. We will not be responsible for any Profit or loss that may occur due to any financial decision taken based on any data provided in this message. Do consult your investment advisor before taking any financial decisions. Stop losses should be an important part of any investment in equity.
Lower High Lower Low forming in Nifty showing overall weakness. Today market showed some positive intent by reaching 24702 but could not sustain the levels and fell flat to close at 24487 giving up 215 points from the top. This proves that Nifty is continuously failing to sustain the momentum and after making a high seems to be plunging further and further. It seems to have become sell on bounce market. Every bounce is used by investors to exit theri positions. This is leads us into he current formation of lower highs and lower lows.
A change in pattern and formation is required for the market to go back to bullishness. The market seems to be waiting for some good news on Tariff front to spur the interest of retail investors. For this to happen a closing above the trend line is required. Right now market remains in a bear grip. Long term investors and dividend investors have an extended time to buy some stocks available at good value focus should be on the stocks that can maximize returns when the Bull rally begins. Buy in parts do not go all in at once as this market can present buying opportunities time and again.
Supports for Nifty remain at: 24339, 24185 and 23948. (Market may fall into total Bear grip if we get a closing below 23948.)
Resistances for Nifty remain at: 24566 (Mother line resistance of an hourly chart), 24734, 24829 (Father line resistance). 24936, 25106 and finally 25260. (Bulls will control the market after we get a weekly closing above 25260).
Disclaimer: The above information is provided for educational purpose, analysis and paper trading only. Please don't treat this as a buy or sell recommendation for the stock or index. The Techno-Funda analysis is based on data that is more than 3 months old. Supports and Resistances are determined by historic past peaks and Valley in the chart. Many other indicators and patterns like EMA, RSI, MACD, Volumes, Fibonacci, parallel channel etc. use historic data which is 3 months or older cyclical points. There is no guarantee they will work in future as markets are highly volatile and swings in prices are also due to macro and micro factors based on actions taken by the company as well as region and global events. Equity investment is subject to risks. I or my clients or family members might have positions in the stocks that we mention in our educational posts. We will not be responsible for any Profit or loss that may occur due to any financial decision taken based on any data provided in this message. Do consult your investment advisor before taking any financial decisions. Stop losses should be an important part of any investment in equity.
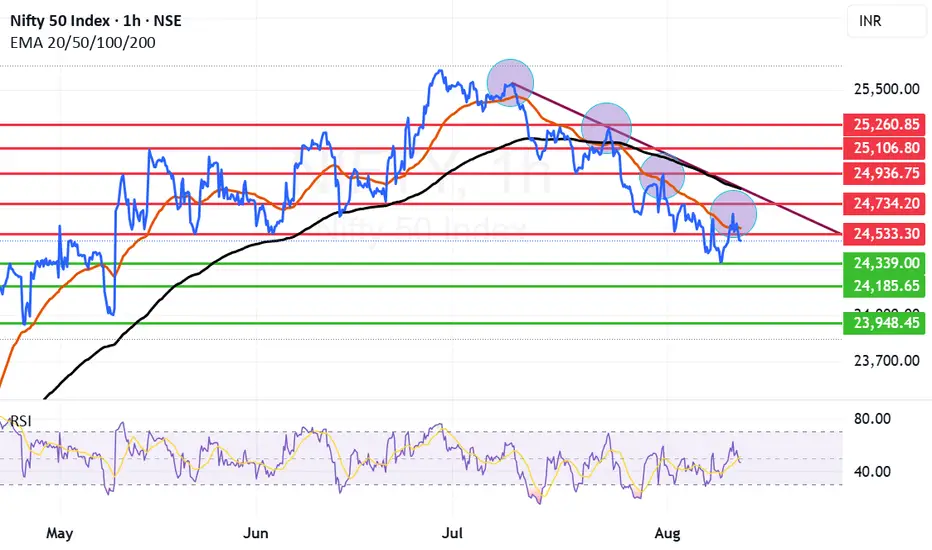
Good Bounce by Nifty from Technical RSI Support zone. We saw a good comeback and bounce by Nifty from a Technical RSI support zone which is around 33. We can by no means call this start of a Bull rally as of now. For Bull Rally to sustain we need a closing on Nifty above 24842. In such a scenario if we get a closing above 24842 the Bulls will feel comfortable. Bulls can breath easy only after we get a closing above 25256 zone. Above 25256 the Bulls can take control of the market. With Nuclear threats flowing around and still Tariff related issues prevailing it looks difficult for Bulls to take proper control of the market. The bounce we saw today can be credited to few reasons mentioned below:
1) Government announcement to support the sectors that will be most affected by Tariffs.
2) Some noises from within the Government to increase the spending to compensate for the GDP loss due to Tariff situation.
3) Silver lining in the clouds which are showing due to the upcoming Trump-Putin talks, Indian PM's proposed China visit.
4) RBI has allowed Indian banks to open special Vostro accounts to facilitate international trade settlements. (However if this has built positive sentiment is something which is yet to be fully understood). Also I am not an expert to understand the framework under which these accounts will work or how it will benefit our companies is a matter of economic experts to study.
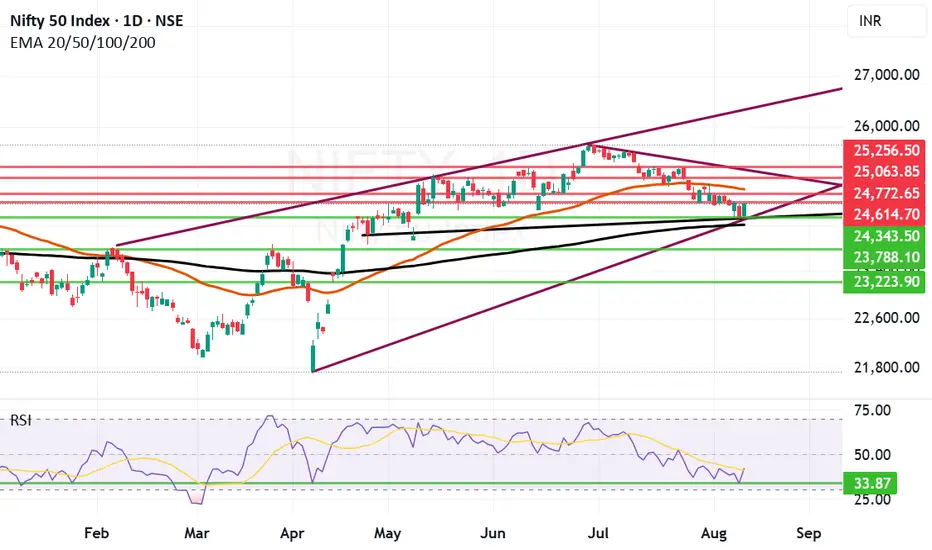
With all this buildup the supports for Nifty remain at: 24343 and 24204. Below 24204 closing or weekly closing the Bears will take total control of the market and drag Nifty below 24K towards 23788 or 23223. Most important support remains at 24204 (Father line Support of Daily charts).
Nifty Resistances remain at: 24614, 24772, 25063 and finally 25256. Above 25256 Bulls can take control of the market and we will comment above further levels when we get there.
Disclaimer: The above information is provided for educational purpose, analysis and paper trading only. Please don't treat this as a buy or sell recommendation for the stock or index. The Techno-Funda analysis is based on data that is more than 3 months old. Supports and Resistances are determined by historic past peaks and Valley in the chart. Many other indicators and patterns like EMA, RSI, MACD, Volumes, Fibonacci, parallel channel etc. use historic data which is 3 months or older cyclical points. There is no guarantee they will work in future as markets are highly volatile and swings in prices are also due to macro and micro factors based on actions taken by the company as well as region and global events. Equity investment is subject to risks. I or my clients or family members might have positions in the stocks that we mention in our educational posts. We will not be responsible for any Profit or loss that may occur due to any financial decision taken based on any data provided in this message. Do consult your investment advisor before taking any financial decisions. Stop losses should be an important part of any investment in equity.
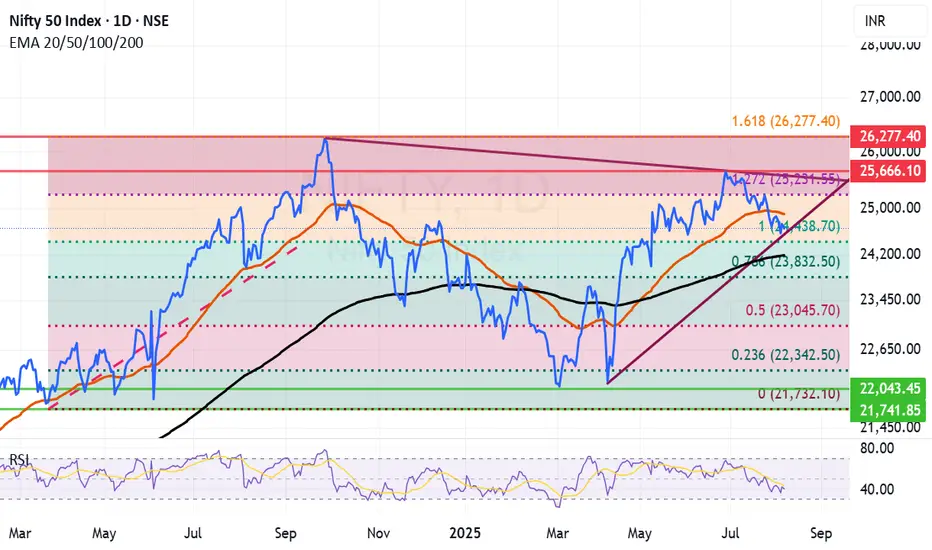
important Fibonacci retracement level approaching for NiftyVery important fibonacci retracement level for Nifty is arriving with ever increasing Trump tantrum and Indian defiance to toe US and EU line on Russian Crude and other trade practises. Market looks delicately placed at this juncture as investors fear that action from the West would undermine Indian growth story. The current fall can be utilized for shifting the balance of the portfolio towards goods that will be 100% made in India and will be consumed in India. For long term investors the current fall can be used to accumulate long term investment ideas with a horizon of 2 to 3 years.
Supports for Nifty remain at: 24438 (Important Fibonacci support), 24190 (Father line support, closing below this will enable bears to pull down Nifty towards next supports), 23832 (Next Fibonacci support), 23045 (Major Fibonacci support).
Resistance for Nifty remain at: 24896 (Mother Line Support), 25231 (Next Fibonacci resistance. A closing above this level will enable bulls to pull Nifty towards next trend line resistance), 25666 (Next Trend line resistance).
Disclaimer: The above information is provided for educational purpose, analysis and paper trading only. Please don't treat this as a buy or sell recommendation for the stock or index. The Techno-Funda analysis is based on data that is more than 3 months old. Supports and Resistances are determined by historic past peaks and Valley in the chart. Many other indicators and patterns like EMA, RSI, MACD, Volumes, Fibonacci, parallel channel etc. use historic data which is 3 months or older cyclical points. There is no guarantee they will work in future as markets are highly volatile and swings in prices are also due to macro and micro factors based on actions taken by the company as well as region and global events. Equity investment is subject to risks. I or my clients or family members might have positions in the stocks that we mention in our educational posts. We will not be responsible for any Profit or loss that may occur due to any financial decision taken based on any data provided in this message. Do consult your investment advisor before taking any financial decisions. Stop losses should be an important part of any investment in equity.
Good comeback candle by Nifty today. Nifty fought back against the Tariff odds today and gained 157.4 points. The combination of Friday's candle and today's candle are forming a Bullish Harami kind of pattern. Harami in Japanese means pregnant woman. Usually this is a Bullish pattern but it requires a follow up positive candle in its support. So if we get a positive candle tomorrow then we can consider Friday's low as a good temporary support.
Supports for Nifty currently remain at: 24482 (Important Trend line resistance), 24317, 24186 (Father line support on daily chart), The zone between 23932 (final support, below this level Bears can take total control of the index).
Resistances for Nifty currently remain at: 24802, 24906 (Mother line resistance on daily chart), 25007, 25249-25346 (Important trend line resistance zone, a closing above 25346 will give control of the index to Bulls).
Disclaimer: The above information is provided for educational purpose, analysis and paper trading only. Please don't treat this as a buy or sell recommendation for the stock or index. The Techno-Funda analysis is based on data that is more than 3 months old. Supports and Resistances are determined by historic past peaks and Valley in the chart. Many other indicators and patterns like EMA, RSI, MACD, Volumes, Fibonacci, parallel channel etc. use historic data which is 3 months or older cyclical points. There is no guarantee they will work in future as markets are highly volatile and swings in prices are also due to macro and micro factors based on actions taken by the company as well as region and global events. Equity investment is subject to risks. I or my clients or family members might have positions in the stocks that we mention in our educational posts. We will not be responsible for any Profit or loss that may occur due to any financial decision taken based on any data provided in this message. Do consult your investment advisor before taking any financial decisions. Stop losses should be an important part of any investment in equity.

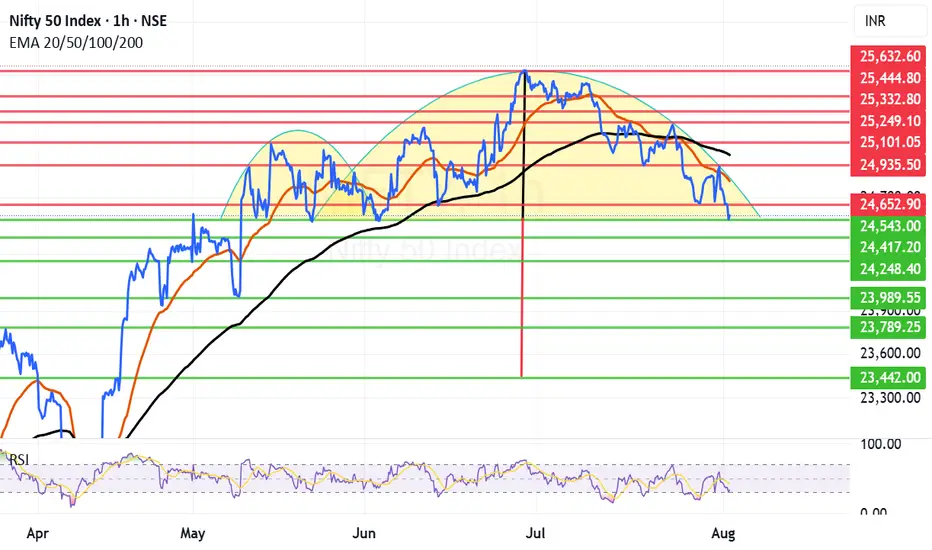
Reverse cup and Handle kind of structure formed in NiftyIn the short term time frame Nifty is seen to be forming reverse cup and handle kind of structure this is considered very bearish structure. However for this bear fest to manifest Nifty needs to close below 24543 or 24417. These 2 levels can save Nifty if not we will see it going into the bear grip.
Thus the most important supports for Nifty remain at 24543 and 24417. Below this level the supports for Nifty will be at 24248, 23989, 23789 and finally major support are is near 23442.
Important resistance areas for Nifty remain at 24652, 24821 (Mother Line Resistance), 24935, 25011 (Father Line Resistance), 25101 and finally 25249. Above 25249 Bulls can become very active.
Till the trade deal chess board and Tariffs do not relent or there is some other very important positive news Nifty will remain under pressure. Let us hope that 24253 or 24417 save us. Long term outlook on Nifty still remains positive. Long term investors should look at the tariff related event as a news that will slowly subside and give way to the Bullish outlook which has been prevailing in the market for decades all together.
Disclaimer: The above information is provided for educational purpose, analysis and paper trading only. Please don't treat this as a buy or sell recommendation for the stock or index. The Techno-Funda analysis is based on data that is more than 3 months old. Supports and Resistances are determined by historic past peaks and Valley in the chart. Many other indicators and patterns like EMA, RSI, MACD, Volumes, Fibonacci, parallel channel etc. use historic data which is 3 months or older cyclical points. There is no guarantee they will work in future as markets are highly volatile and swings in prices are also due to macro and micro factors based on actions taken by the company as well as region and global events. Equity investment is subject to risks. I or my clients or family members might have positions in the stocks that we mention in our educational posts. We will not be responsible for any Profit or loss that may occur due to any financial decision taken based on any data provided in this message. Do consult your investment advisor before taking any financial decisions. Stop losses should be an important part of any investment in equity.
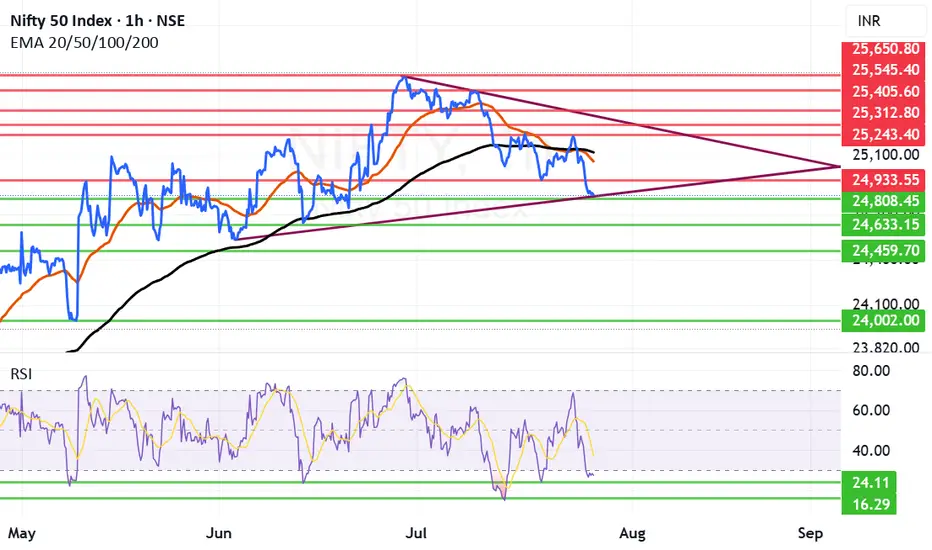
Good turnaround by market as expected from the channel bottom.We had given a message that the market was nearing the bottom and there can be a turnaround sooner than later and market turned around today. This bounce can be currently seen as a technical bounce but it can become a full fledged fightback by bulls if it crosses key resistance levels of Mother line, Father line and Mid-channel resistance. These are the 3 key resistances in front of us currently. All eyes on the important trade deal announcements and with US and China which are on going any news on that from can disrupt the market proceedings in either way. Support and resistance levels for Nifty are as under:
Key Nifty Resistances: 24849 (Trend line resistance), 24922 (Motherline Resistance of hourly chart), 25028, 25070 (Father line resistance), 25189 (Mid-channel resistance), 25243 (Very important resistance for Bulls to conquer). Above 25243 Bulls can gain control of Nifty.
Key Support levels: 25741, 25627 (Channel bottom Support), 24519.
Disclaimer: The above information is provided for educational purpose, analysis and paper trading only. Please don't treat this as a buy or sell recommendation for the stock or index. The Techno-Funda analysis is based on data that is more than 3 months old. Supports and Resistances are determined by historic past peaks and Valley in the chart. Many other indicators and patterns like EMA, RSI, MACD, Volumes, Fibonacci, parallel channel etc. use historic data which is 3 months or older cyclical points. There is no guarantee they will work in future as markets are highly volatile and swings in prices are also due to macro and micro factors based on actions taken by the company as well as region and global events. Equity investment is subject to risks. I or my clients or family members might have positions in the stocks that we mention in our educational posts. We will not be responsible for any Profit or loss that may occur due to any financial decision taken based on any data provided in this message. Do consult your investment advisor before taking any financial decisions. Stop losses should be an important part of any investment in equity.

Bollinger band indicates that we might see a recovery soon. Bollinger band in a beautiful tool of Technical analysis. There are three lines in it. The upper bandwidth line, the middle line and the lower band width line.
As you can see in the chart. Whenever the stock or an index price touches or crosses the upper line the indication it gives is that the market is overbought and there is an imminent selling pressure.
Middle line indicates either resistance or support depending on the position of the candle within the band. It further indicates that Middle line will be support when the price is above it. It also indicates that middle Bollinger band will be a resistnace when the candles are below it.
Lower bandwidth line indicates a support zone. When the candles touch or cross it the indication it gives is that the market is oversold and there can be an imminent up move once this phenomenon happens.
Bollinger band in like a channel or a parallel chanel but a more accurate one and a more asymmetric one.
Currently you can see in the chart that Bollinger band has not only touched but also crossed the bottom bandwidth. This is an indication of an over sold market. Thus the indications we get from this tool are that there are very high chances for a short covering recovery or relief rally.
The indication is in sync with Tariff deadline which is tomorrow. Thus any positive announcement on that front can also initiate a strong or mild recovery rally. Thus we might see a bottom formation and recovery rather sooner than later.
Current Nifty closing is at:24680.
Upper band width is at: 25683 (This zone will work as strong resistance zone).
Mid Bandwidth is at: 25217 (This zone will be a Strong resistance).
Mother Line: 24942 (Strong Resistance).
Lower band width is at: 24750 (Weak Resistance).
Nearby support: 24501 (Support).
Father Line: 24157 (Strong Support).
It is a good time to reshuffle your Portfolios and initiate fresh buying in the blue-chip stocks which might be available at a good valuation.
Disclaimer: The above information is provided for educational purpose, analysis and paper trading only. Please don't treat this as a buy or sell recommendation for the stock or index. The Techno-Funda analysis is based on data that is more than 3 months old. Supports and Resistances are determined by historic past peaks and Valley in the chart. Many other indicators and patterns like EMA, RSI, MACD, Volumes, Fibonacci, parallel channel etc. use historic data which is 3 months or older cyclical points. There is no guarantee they will work in future as markets are highly volatile and swings in prices are also due to macro and micro factors based on actions taken by the company as well as region and global events. Equity investment is subject to risks. I or my clients or family members might have positions in the stocks that we mention in our educational posts. We will not be responsible for any Profit or loss that may occur due to any financial decision taken based on any data provided in this message. Do consult your investment advisor before taking any financial decisions. Stop losses should be an important part of any investment in equity.

Nifty Next Week: Can Nifty make a comeback after drubbing?Nifty received proper drubbing after falling below critical supports of Mother and Father line. Trump's warning signals for IT companies and the continuing deadlock in Trade deal with US weighing on Indian markets. Additionally the earning season also giving many disappointing and few good result has broken the back of the Bull rally and now Nifty is reeling under 25K levels.
Only silver line in the cloud seems to be that RSI is below 30. Currently RSI is at 27.52. Usually RSI has found support near 24 if not 24 it might bounce back from 16. So hopefully we can see some short covering in the beginning or middle of next week. Also next week the decision for Tariffs should come. If the result will be in favour of India we might see a strong come back as lot of sectors / Large cap stocks currently are looking oversold.
The Supports for Nifty Remain at: 24808 (Strong support), 24633, 24459 Below 24459 the index will be in firm grip of Bears who might try to drag Nifty towards 24K levels or even below that in unlikely circumstances.
The Resistances for Nifty Remain at: 24933, 25058 (Mother Line Resistance of Daily Chart), 25119 (Father Line Resistance) and 25243. After we get a closing above 25243 the Bulls can gain some momentum.
Disclaimer: The above information is provided for educational purpose, analysis and paper trading only. Please don't treat this as a buy or sell recommendation for the stock or index. The Techno-Funda analysis is based on data that is more than 3 months old. Supports and Resistances are determined by historic past peaks and Valley in the chart. Many other indicators and patterns like EMA, RSI, MACD, Volumes, Fibonacci, parallel channel etc. use historic data which is 3 months or older cyclical points. There is no guarantee they will work in future as markets are highly volatile and swings in prices are also due to macro and micro factors based on actions taken by the company as well as region and global events. Equity investment is subject to risks. I or my clients or family members might have positions in the stocks that we mention in our educational posts. We will not be responsible for any Profit or loss that may occur due to any financial decision taken based on any data provided in this message. Do consult your investment advisor before taking any financial decisions. Stop losses should be an important part of any investment in equity.
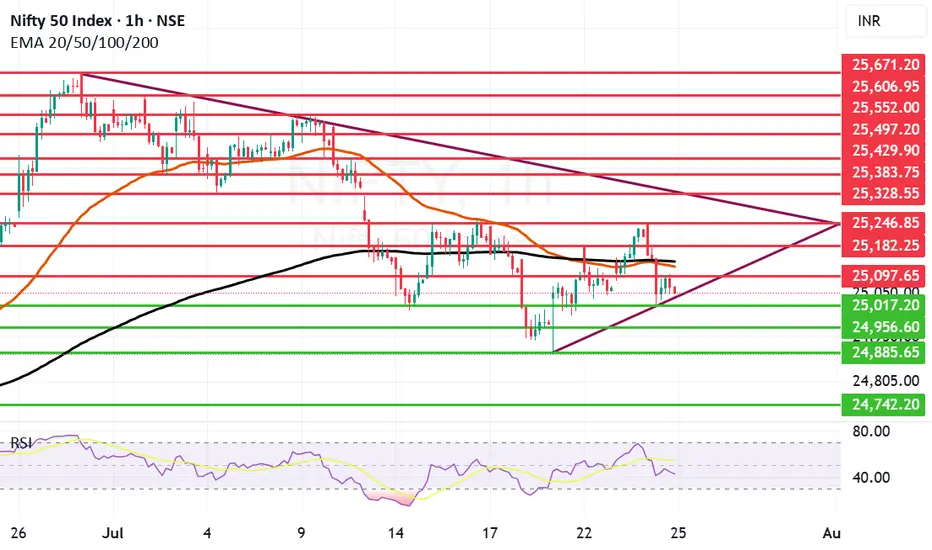
Nifty falls again as it can not sustain above 25240 level. Nifty again has shown some weakness as it was not able to sustain levels above 25240. The fall was lead by IT index which ended with deep cuts and fell 2.12% the other indices that saw fall were FMCG, Realty and Small Cap index. Trump's stance against Tech companies hiring from India and the deadlock in the trade deal also contributed to fall today. Index fell 157.8 points today and ended below both Mother and line on hourly chart. In the daily chart the candle we saw today was a bearish engulfing candle so further weakness can not be ruled out. The 2 major supports for nifty remain at 25017 and 24956 if these two supports are broken we may see Nifty falling towards 24885 or even 24742. Resistances for Nifty remain at 25097, 25138, 25182 and 25246. Only after we get a closing above 25246 we can see Nifty rally upwards.
Disclaimer: The above information is provided for educational purpose, analysis and paper trading only. Please don't treat this as a buy or sell recommendation for the stock or index. The Techno-Funda analysis is based on data that is more than 3 months old. Supports and Resistances are determined by historic past peaks and Valley in the chart. Many other indicators and patterns like EMA, RSI, MACD, Volumes, Fibonacci, parallel channel etc. use historic data which is 3 months or older cyclical points. There is no guarantee they will work in future as markets are highly volatile and swings in prices are also due to macro and micro factors based on actions taken by the company as well as region and global events. Equity investment is subject to risks. I or my clients or family members might have positions in the stocks that we mention in our educational posts. We will not be responsible for any Profit or loss that may occur due to any financial decision taken based on any data provided in this message. Do consult your investment advisor before taking any financial decisions. Stop losses should be an important part of any investment in equity.
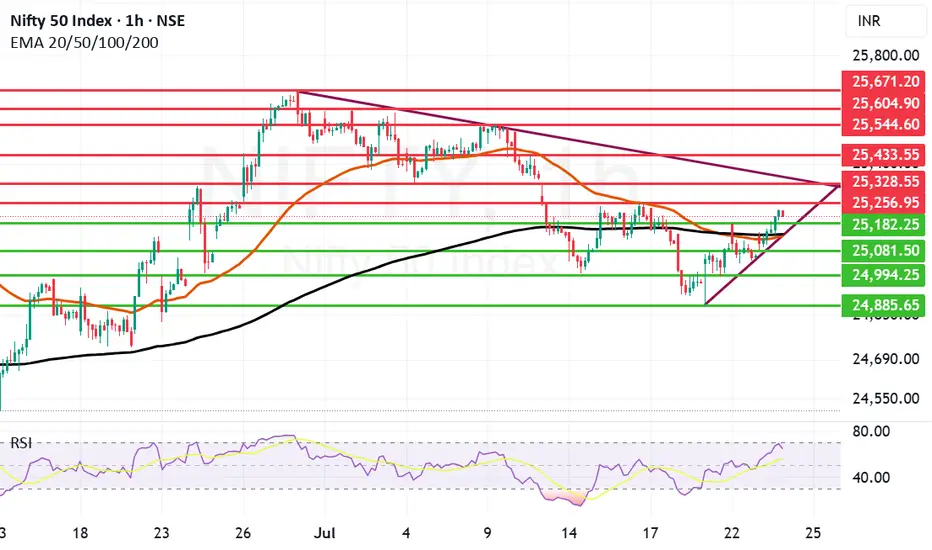
Strong Comeback by Nifty few Resistances ahead.Nifty made a remarkable comeback today ending 159 points up closing at 25219. Infosys has posted better than expected result and as of now the Infosys ADR is up by 1.26%. So if there is a turnaround in the IT sector we can see Nifty fly upwards.
The next resistance ahead of Nifty is at 25256 if we get a closing above this the next will be at 25328. These 2 will be critical resistances to cross. Once we get a closing above 25328 Nifty can target 25433 and 25544. Above 25544 Nifty becomes very strong. In case Nifty is not able to cross 25256 or 25328 levels the supports for Nifty are at 25182. After this zone there is a dual support of Mother and Father line of Hourly chart at 25136 and 25142.
These are very strong supports. (Thus the zone between 25182 to 25136 is full of supports). We hope that these supports are held. In case we get a closing below 25136 Nifty will again fall into bearish territory and can plunge towards 25081, 24994 or even 24885.
The shadow of the candles right now is positive but 2 very important resistances mentioned earlier are yet to crossed so game is in balance but only slightly in favour of Bulls.
Disclaimer: The above information is provided for educational purpose, analysis and paper trading only. Please don't treat this as a buy or sell recommendation for the stock or index. The Techno-Funda analysis is based on data that is more than 3 months old. Supports and Resistances are determined by historic past peaks and Valley in the chart. Many other indicators and patterns like EMA, RSI, MACD, Volumes, Fibonacci, parallel channel etc. use historic data which is 3 months or older cyclical points. There is no guarantee they will work in future as markets are highly volatile and swings in prices are also due to macro and micro factors based on actions taken by the company as well as region and global events. Equity investment is subject to risks. I or my clients or family members might have positions in the stocks that we mention in our educational posts. We will not be responsible for any Profit or loss that may occur due to any financial decision taken based on any data provided in this message. Do consult your investment advisor before taking any financial decisions. Stop losses should be an important part of any investment in equity.
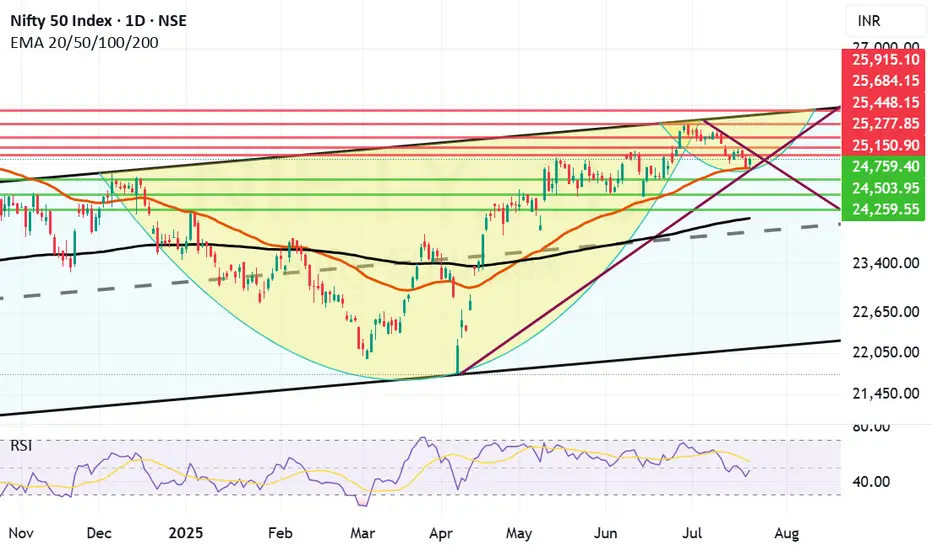
Nifty has taken support at Mother line as expected.Despite poor showing by Reliance post result and TCS continuing to fall Nifty staged a remarkable comeback on the back of Pvt Sector banking which did well. Bank Nifty came back strongly posting 1.19% gains today which enabled Nifty to rise 122 points or 0.49%. Capital Goods, Finance and Metals indices also gained more than 1% each.
Resistances for Nifty now remain at: 25150, 25277 (Trend line resistance), 25448, 25684 and finally channel top resistance at 25915.
Supports for Nifty remain at: 24938 (Mother Line Support of Daily Chart), 24759, 24503, 24259 and finally 24116 (Father Line support of Daily chart).
Shadow of the candle right now is neutral to positive and RSI is 47.63 with median RSI resistance at 54.09.
Disclaimer: The above information is provided for educational purpose, analysis and paper trading only. Please don't treat this as a buy or sell recommendation for the stock or index. The Techno-Funda analysis is based on data that is more than 3 months old. Supports and Resistances are determined by historic past peaks and Valley in the chart. Many other indicators and patterns like EMA, RSI, MACD, Volumes, Fibonacci, parallel channel etc. use historic data which is 3 months or older cyclical points. There is no guarantee they will work in future as markets are highly volatile and swings in prices are also due to macro and micro factors based on actions taken by the company as well as region and global events. Equity investment is subject to risks. I or my clients or family members might have positions in the stocks that we mention in our educational posts. We will not be responsible for any Profit or loss that may occur due to any financial decision taken based on any data provided in this message. Do consult your investment advisor before taking any financial decisions. Stop losses should be an important part of any investment in equity.
Can Reliance and Banks turn Nifty around? do or die Monday. Nifty as of now has taken support at Mother line in daily chart. As expected in my Yesterday's message. So Hopefully if Big Banks Results are in line tomorrow we might see Nifty going upwards from Monday.
Mota Bhai just announced the results. EBITDA is slightly less than expected but Net Profit and Revenue is much better than Market expectation. In my view market should react positively to this result.
Supports For Nifty remain at 24932 (Mother line), 24759, 24503. As indicated earlier if we get a closing below 24503 we may see a Fall towards 24106 or 23929 (In unlikely circumstances).
Nifty Resistances remain at: 25035, 25248, 25400 and 25613 (Channel top Resistance).
Results for tomorrow
HDFC BANK
ICICIBANK
AUSMALL BANK
RBL BANK
UNION BANK
YES BANK
CENTR BANK
PUNJA BANK
CENTR BANK
So it seems like a Do or Die Monday on cards. Shadow of the candle looks neutral as of now.
Disclaimer: The above information is provided for educational purpose, analysis and paper trading only. Please don't treat this as a buy or sell recommendation for the stock or index. The Techno-Funda analysis is based on data that is more than 3 months old. Supports and Resistances are determined by historic past peaks and Valley in the chart. Many other indicators and patterns like EMA, RSI, MACD, Volumes, Fibonacci, parallel channel etc. use historic data which is 3 months or older cyclical points. There is no guarantee they will work in future as markets are highly volatile and swings in prices are also due to macro and micro factors based on actions taken by the company as well as region and global events. Equity investment is subject to risks. I or my clients or family members might have positions in the stocks that we mention in our educational posts. We will not be responsible for any Profit or loss that may occur due to any financial decision taken based on any data provided in this message. Do consult your investment advisor before taking any financial decisions. Stop losses should be an important part of any investment in equity.
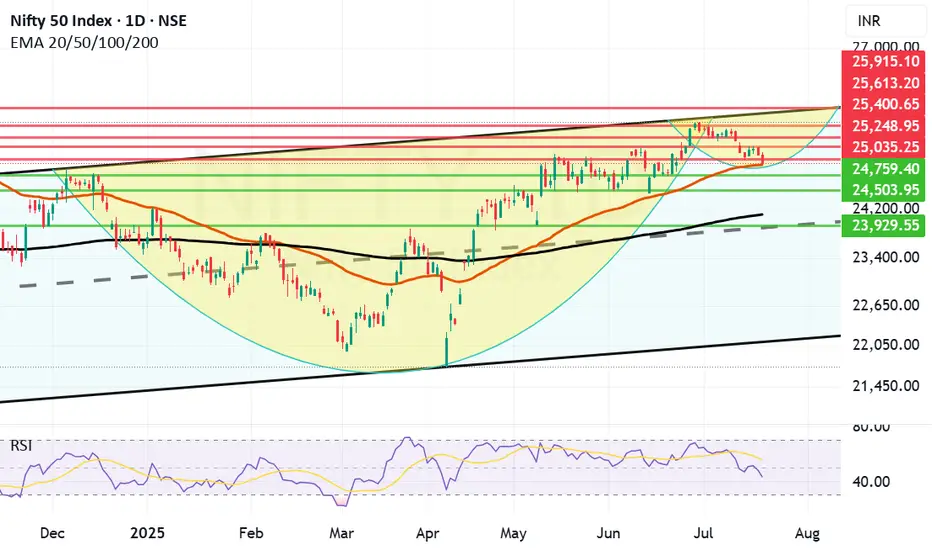
If Mother Line Support will hold, we might see a C&H formation. Although we saw a negative closing today, the chart suggests that if Mother line support will hold we might see a reversal and a Cup and Handle Formation in the near future. Cup and Handle formation is a great pattern which can help us reach the previous high and surpass it. If it happens or not only time can tell.
Supports For Nifty right now remain at: 25035, 24930 (Important Mother Line Support of Daily chart), 24759 and 24503. If 24503 is broken then there will be overall weakness in the market and we can see Nifty plummeting to 24097 (Father Line Support of Daily chart). Just below 24907 there will also be the mid channel support of 23929. (Just in case we reach there).
Resistances For Nifty Remain at: 25248, 25400, 25613 and 25915 seems to be the channel top as of now.
Nifty is delicately placed and the support of 24930 and Resistance of 25248 are the key levels to be watched. Above 25248 Bulls become strong. Below 24930 Bears become strong. Right now we are in no man's land with shadow of the candle slightly negative. If we see a bounce tomorrow or from the Mother line the shadow will has potential to turn positive later in the day tomorrow or next week.
Short term Outlook: Neutral to negative.
Medium Term Outlook: Neutral to Positive.
Long Term Outlook: Positive.
Disclaimer: The above information is provided for educational purpose, analysis and paper trading only. Please don't treat this as a buy or sell recommendation for the stock or index. The Techno-Funda analysis is based on data that is more than 3 months old. Supports and Resistances are determined by historic past peaks and Valley in the chart. Many other indicators and patterns like EMA, RSI, MACD, Volumes, Fibonacci, parallel channel etc. use historic data which is 3 months or older cyclical points. There is no guarantee they will work in future as markets are highly volatile and swings in prices are also due to macro and micro factors based on actions taken by the company as well as region and global events. Equity investment is subject to risks. I or my clients or family members might have positions in the stocks that we mention in our educational posts. We will not be responsible for any Profit or loss that may occur due to any financial decision taken based on any data provided in this message. Do consult your investment advisor before taking any financial decisions. Stop losses should be an important part of any investment in equity.
