Nasdaq - The final blow-off top!⚰️Nasdaq ( TVC:NDQ ) can rally a final +25%:
🔎Analysis summary:
Just this month, we witnessed quite some volatility on the Nasdaq with a correction of about -10%. However, bulls immediately stepped in and clearly pushed price higher. Since there is still bullish pressure, a final blow-off top rally in the near future is quite likely.
📝Levels to watch:
$25,000 and $30,000
SwingTraderPhil
SwingTrading.Simplified. | Investing.Simplified. | #LONGTERMVISION
NASDAQ 100 E-MINI FUTURES

25.12.12 Nasdaq AnalysisWelcome to Acid Trade.
Hello everyone, as of December 12th, 2025, I will be analyzing the Nasdaq chart today.
This is Acid.
15 Minute Chart Analysis
Let’s first review yesterday’s results.
In the previous video, I mentioned that a long position should be taken once the resistance trendline and the 25,566 level were broken.
That breakout occurred at the white circle, and from that entry, the market climbed approximately 152 points, resulting in a $3,000 profit.
For the short-side opportunity, the entry occurred when the rising trendline after the market opened was broken.
This sell signal appeared at the blue circle and led to a 186-point decline, giving a $3,720 profit.
Therefore, the total profit for December 11th was $6,720.
Daily Chart Analysis
Looking at yesterday’s candle (December 11), the price tapped the daily 20-EMA and bounced back, leaving a long lower wick.
Nasdaq is currently trading inside a previous volume zone, with the downside open toward 25,120 and potentially 24,945 if momentum continues lower.
Today’s Strategy
Today, Nasdaq temporarily broke below the short-term rising trendline, but this happened due to a pre-market gap-down, creating the yellow-box gap zone.
Because the sell-off was not strong and price action remains sideways, the market is effectively consolidating.
At the moment, Nasdaq is forming a larger box range:
Top: 25,879 forming a double top
Bottom: 25,400 forming a double bottom
A breakout from either side will likely determine the next major trend direction.
Today’s trading strategy should focus on identifying that breakout level and reacting once confirmation appears.
Conclusion
Nasdaq is moving within a key range between 25,879 and 25,400, and a breakout will define the next major trend direction.
Watch for a confirmed break with supporting volume before taking a position.
Today’s session is all about timing the breakout and reacting quickly.

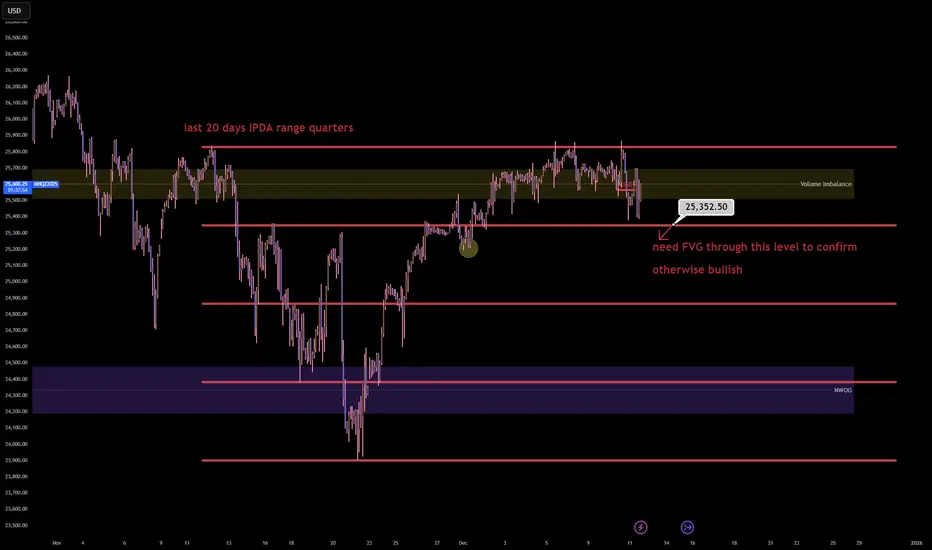
NQ1! (Nasdaq 100) has entered the terminal phaseThe Nasdaq 100 has entered the terminal phase of its 20 day institutional dealing range and is currently executing a distribution program within the premium quartile. The failure to sustain price acceptance above the 25,700.00 Volume Imbalance suggests the algorithm is preparing for a mean reversion event to rebalance the monthly ledger.
The present price action represents a classic 'Bull Trap' at the upper boundary of the range where retail momentum is being absorbed by institutional limit sell orders ahead of a repricing to equilibrium.
Entry: 25,550.00 (Sell Limit)
Stop loss: 25,880.00 (330.00 points)
Take profit: 24,850.00 (700.00 points)
Risk to reward ratio: 2.12R
CME_MINI:NQ1! CME_MINI:MNQ1! IG:NASDAQ
The Opportunity
The 20 day IPDA lookback reveals that price is oscillating within a defined premium distribution block between 25,350.00 and 25,850.00. The market has expended significant energy to reach this valuation but has failed to close the daily candles above the key Volume Imbalance at 25,700.00.
This rejection signature implies that the 'Santa Rally' narrative has been utilized to engineer exit liquidity for smart money positions accumulated at the lows. The algorithm is an efficiency engine and it cannot justify a new macro expansion leg without first revisiting the internal range equilibrium to capitalize the move.
The Entry
Initiating a short position in the 25,550.00 to 25,600.00 zone aligns with the institutional logic of selling the upper 25% of the monthly range. This zone offers the highest statistical edge as it places the entry directly against the 'Ceiling' of the current volatility profile while targeting the 'Floor' of the recent expansion.
The Volume Imbalance acts as a natural defensive barrier for the stop loss as the algorithm will typically respect this array during a distribution phase.
The Invalidation
The bearish causal chain is ontologically corrupted if price achieves a daily close above the 25,880.00 range high. Such an event would signify a 'Blue Sky' breakout and a shift in regime from range bound to trending.
If the market accepts price above this threshold it implies that the premium valuation has become the new floor and the algorithm is targeting the 26,000.00 psychological level.
Key Trajectory Waypoints
Target 1: 25,350.00 | Type: 75% Range Quartile | Probability: 70% | ETA: 24 Hours
Target 2: 24,850.00 | Type: Range Equilibrium (50%) | Probability: 60% | ETA: 2-3 Days
Target 3: 24,400.00 | Type: NWOG / Discount Target | Probability: 40% | ETA: Next Week
The Shadow Reality
A 35% probability exists for the antithetical reality: The Range Expansion.
In this scenario the current consolidation is a 'High Tight Flag' and the algorithm ignores the equilibrium requirement to force a squeeze into the 26,000.00 level immediately.
This reality is confirmed if price holds above 25,650.00 for two consecutive 4 hour closes.
NQ is bullish.Let's see if NASDAQ is bullish. Interest rate decision is today (3pm NYT) so NASDAQ is particularly volatile today. If price can break and stay above 25867 then probably it will continue bullish. The volatility after the announcement might add fuel for it to push up further. It's a risk. Happy trading.

NAS100 Retest of POC: Bullish Break or Deeper Correction?I'm keeping a close eye on NASDAQ (NAS100) right now 📉📈. We’re seeing a deep pullback—a strong retracement that makes everyone ask the classic question:
Does this want to keep pushing lower and give us a bearish weekly candle, or is it gearing up to hold a level and rally back with the higher-timeframe trend?
For me, I’m a trend-continuation trader. Even if the weekly candle prints bearish, I’m not interested in selling into higher-timeframe strength. I’d rather stay patient and stick with the bigger trend direction 🧭.
Here’s the key level I’m watching:
If NAS100 can break back above the Volume Profile POC (Point of Control) — which is basically the high-value area acting as support right now — then I’ll be looking for long opportunities.
But if price breaks below the POC, that invalidates the idea and I’ll step aside. No need to force anything 👍.
Not financial advice ⚠️

NQ1! — Fed Week: 25,650 Inflection | Tight Decision📊 NQ1! NASDAQ 100 E-MINI FUTURES
December 9, 2025 | by officialjackofalltrades
🟡 CAUTIOUS |Fed Week Special Edition
EXECUTIVE SUMMARY - THE PRE-FED SETUP
Current Price: $25,651.50 | Date: December 9, 2025 | Change: -$48.25 (-0.19%)
The Nasdaq 100 E-mini futures are consolidating in a tight range between 25,000-26,300 as markets brace for tomorrow's Federal Reserve decision. After December E-mini Nasdaq futures rose +0.10% on Tuesday, the index is now sitting in a critical decision zone with massive implications for tech stocks.
The Technical Picture:
Pattern: Range-bound consolidation (4 weeks)
Current Position: Middle of range at 25,650
Resistance: 26,200-26,300 (tested multiple times, rejected)
Support: 24,700-24,900 (solid floor since November)
Key Level: 25,200 (bull/bear line)
The Fundamental Backdrop:
Big Tech was mixed at the close: Amazon booked a modest gain, while Apple, Meta and Microsoft finished slightly in the red. More importantly, These industry titans have consistently outpaced the broader S&P 500, with the S&P 500 Top 10 rising over 600% in total since January 1, 2016.
But here's the tension: AI capex coming from tech companies listed in the S&P 500 is $400 billion or more per year, going forward. The biggest AI company OpenAI has disclosed revenues of just $13 billion for 2025.
The Trade: Long from 25,200-25,600, target 26,500-27,200, stop 24,650. Risk/reward: 1:2.5 .
MARKET CONTEXT - WHAT'S REALLY HAPPENING
The Pre-Fed Paralysis
Stock indexes gave up early gains and settled mixed on Tuesday as bond yields climbed after the Oct JOLTS report showed job openings unexpectedly rose to a 5-month high.
This is classic pre-FOMC behavior : markets waiting for the catalyst before committing.
Investing.com - U.S. stock futures inch down ahead of the start of trading for December, with investors keeping tabs on a possible rate cut.
The AI Valuation Debate
Here's what's creating the consolidation: AI optimism vs. valuation concerns .
BULLISH CAMP:
Nvidia leads the tech sector with a market cap of $4.4 trillion
24/7 Wall St. forecast projects Nvidia revenue rising from $121 billion in 2025 to more than $265 billion by 2030
For the Mag 7 group, total earnings are expected to increase by +12.6% on +9.5% higher revenues in 2025
BEARISH CAMP:
OpenAI may have lost $12 billion in the third quarter of 2025 alone, according to a disclosure by Microsoft
806 Russell 2000 companies (40%) have no earnings or negative earnings
The revenues currently being generated by AI companies are far smaller than the amount of capex being directed at them
My Take: This is why NQ is stuck in range. Bulls see AI growth, bears see bubble. Fed decision tomorrow will tip the scale.
TECHNICAL ANALYSIS - THE RANGE-BOUND BATTLE
Pattern: Consolidation Rectangle (4 Weeks)
Your purple boxes perfectly capture the support/resistance clusters . Let me break down what the chart is telling us:
Key Technical Levels:
🔴 RESISTANCE (Selling Zones):
26,200-26,300: Tested 4 times since November, strong rejection zone
26,500-26,700: If we break above, this is next target
27,000-27,200: Extension target if Fed is dovish
🟢 SUPPORT (Buying Zones):
25,200-25,400: Minor support, current price zone
24,900-25,100: Major support cluster (your bottom purple box)
24,700-24,800: Absolute floor, tested Nov 19
24,300-24,500: Nuclear support if range breaks
Current Position: The Nasdaq 100 Futures price has ranged from 25,657.50 to 25,693.75 today extremely tight range showing indecision.
Technical Indicators:
Moving Averages:
50-day MA: ~25,400 (acting as support)
200-day MA: ~24,200 (long-term uptrend intact)
Golden Cross: Active since October = bullish
Volume:
The current trading volume for Nasdaq 100 Futures is 6,395 very low , typical pre-Fed paralysis.
RSI:
Currently: ~52-55 (neutral)
Not overbought (room to run)
Not oversold (no panic)
MACD:
Flat, coiling for breakout
Waiting for directional catalyst
SCENARIO ANALYSIS - THREE FED OUTCOMES
SCENARIO A: Dovish Cut (55% Probability) - BULLISH
What Happens:
Fed cuts 25bps ✓
Dot plot shows 3-4 more cuts in 2026 ✓
Powell emphasizes "labor market concerns" ✓
Tech gets green light to continue AI spending ✓
Market Reaction:
Immediate: NQ pumps 1.5-2% to 26,000-26,200
Day 1-3: Breakout above 26,300, test 26,700
Week 1-2: Rally to 27,000-27,500
Month 1: Target 27,800-28,200 (+9-10%)
Winners:
Nvidia (NVDA), AMD (AMD), Broadcom (AVGO) lead
Mag 7 outperform
High-growth tech rallies hard
Trade Setup:
Enter: Current 25,650 OR breakout above 26,300
Add: On pullback to 26,000 after breakout
Target: 27,500 (+7.2%)
Stop: 25,100 (-2.1%)
Risk/Reward: 1:3.4
SCENARIO B: Hawkish Cut (35% Probability) - CHOPPY
What Happens:
Fed cuts 25bps ✓
BUT dot plot shows only 1-2 cuts in 2026 ❌
Powell says "inflation still concerning" ❌
Tech valuations questioned ❌
Market Reaction:
Immediate: NQ drops 1-1.5% to 25,200-25,400
Day 1: Volatility, test 24,900 support
Week 1-2: Choppy recovery to 25,800-26,000
Month 1: Grind back to 26,200-26,500 (+2-3%)
Losers:
High-valuation AI stocks hit hard
Stocks with high capex vs. revenue scrutinized
Small caps underperform
Trade Setup:
DO NOT chase before Fed
Buy: Dip to 24,900-25,100 (support)
Target: 26,000-26,300 (+5-6% from dip)
Stop: 24,650 (-2%)
Risk/Reward: 1:2.5
SCENARIO C: No Cut OR Very Hawkish (10% Probability) - BEARISH
What Happens:
Fed HOLDS at 3.75-4% ❌
OR cuts but says "this is the last one" ❌
Powell cites AI bubble concerns ❌
Tech sell-off accelerates ❌
Market Reaction:
Immediate: NQ crashes 2-3% to 24,700-25,000
Day 1: VIX spikes, panic selling
Week 1-2: Test 24,300-24,500
Month 1: Bottom around 23,800-24,200 (-7-8%)
Trade Setup:
Exit ALL longs immediately
Wait for capitulation
Buy: 24,000-24,300 (major support)
Target: Recovery to 25,500-26,000 (+6-8%)
High stress, high reward
THE TRADE SETUP - PROFESSIONAL EXECUTION
🟢 PRIMARY LONG SETUP: BUY NQ1!
Entry Strategy (Scale In):
Option A: Conservative (Wait for Dip):
25,000-25,200 (IF hawkish dip)
24,800-25,000 (IF deeper dip to support)
Best for: Risk-averse traders
Stop Loss: 24,650 (HARD STOP)
Below 24,650 = range break on daily
Below this = technical structure invalidated
Max loss from 25,650 entry:
Take Profit Targets:
TP1: 26,200-26,500
Range breakout + resistance retest
Action: Take 40% profit, move stop to 25,200
Gain: +2.1-3.3% | Risk/Reward: 1:2
TP2: 27,000-27,500
Momentum continuation post-Fed
Technical indicators show Strong Buy signal
TP3: 27,800-28,200
Full breakout, AI optimism returns
Long-term forecast shows potential to $28,452
Entry Confirmation Checklist:
Before entering, CHECK:
✅ Price holding above 25,200 (bull/bear line)
✅ Volume spike on bounce (15K+ contracts on 4H)
✅ Fed announces 25bps cut (as expected)
✅ Powell's tone dovish or neutral (not hawkish)
✅ Mag 7 stocks holding up (NVDA, MSFT, AAPL)
✅ VIX below 16 (fear contained)
WAIT FOR 4/6 BEFORE FULL POSITION
Use Micro E-minis (MNQ) for Better Sizing:
MNQ = $2/point (vs NQ $20/point)
Same moves, 1/10th capital
Better for risk management
Fed Day Protocol (December 10):
2:00 PM ET - Fed Statement:
Tighten stops to 25,100 before announcement
READ statement immediately
Ignore first 5 minutes (algo chaos)
2:30 PM ET - Powell Press Conference:
WATCH LIVE - tone matters more than words
Dovish = add to position on dip
Hawkish = cut 50%, tight stops
5. Emergency Exits:
❌ Daily close below 24,650 = EXIT ALL
❌ VIX spikes above 22 = EXIT 50%
❌ Fed announces NO cut = EXIT ALL
❌ Powell says "last cut for 6+ months" = EXIT 50%
❌ Mag 7 stocks crash 3%+ = EXIT 50%
FUNDAMENTAL ANALYSIS - THE AI CONUNDRUM
CATALYST #1: The Magnificent 7 Dominance
Nvidia, Microsoft, and Apple make up 20.7% of the S&P 500 and 43.6% of the Vanguard Information Technology ETF.
This concentration means:
NQ lives or dies by Mag 7 performance
Fed policy directly impacts these valuations
Any weakness cascades fast
Current Status:
Nvidia: $4.37T market cap
Apple: $4.20T market cap
Microsoft: $4T+ market cap
CATALYST #2: The AI Spending Paradox
Here's the $400 billion question :
AI capex from S&P 500 tech companies is $400 billion or more per year. The biggest AI company OpenAI has disclosed revenues of just $13 billion for 2025.
The Math Doesn't Add Up:
Spending: $400B/year
Revenue: $13B/year
Gap: $387B/year of unprofitable spending
"Can the 10 AI companies generate enough revenue to justify the capex?"
says Torsten Sløk, chief economist at Apollo Global Management.
BUT: Nvidia revenue projected to rise from $121B in 2025 to $265B by 2030 revenue IS growing, just not fast enough yet.
CATALYST #3: Earnings Growth Remains Strong
Mag 7 earnings expected to increase +12.6% on +9.5% higher revenues in 2025.
Excluding the Mag 7, total earnings for remaining S&P 500 companies expected to grow +8.7% in 2025.
Translation: Even without AI hype, earnings are solid.
CATALYST #4: Fed Policy is CRITICAL
With U.S. 10-year Treasury yields hovering just above 4% and the Fed set to decide on a widely expected rate cut, growth stocks remain sensitive to even small changes in rate expectations.
Why This Matters:
Lower rates = higher valuations for growth
Higher rates = multiple compression
Tech has highest duration risk
RISK FACTORS - THE BEAR CASE
RISK #1: AI Bubble Concerns
Nvidia's Jensen Huang says he doesn't believe we're in an AI bubble. Amazon's Jeff Bezos says we probably are in one. OpenAI's Sam Altman has invoked a bubble, adding, "I do think some investors are likely to lose a lot of money".
Even AI leaders are split!
RISK #2: Valuation Stretched
OpenAI may have lost $12 billion in Q3 2025 alone, yet is valued at $500 billion by VCs.
If valuations reset, NQ drops 15-20%.
RISK #3: Concentration Risk
Since October 2022, roughly 75% of gains in S&P 500 have come from just seven stocks.
If Mag 7 stumbles, entire index falls .
RISK #4: Technical Breakdown
Break below 24,650 = target 23,800-24,200 (-6-7%)
THE BOTTOM LINE
Here's what I KNOW on December 9, 2025:
✅ Fed expected to cut 25bps tomorrow
✅ NQ technical indicators show Strong Buy
✅ Mag 7 earnings growing +12.6% in 2025
✅ NQ in consolidation range 25,000-26,300
✅ Support at 24,900 has held 4 times
✅ Your purple boxes show clear support/resistance
Here's what I DON'T know:
Will Powell be dovish or hawkish?
How many 2026 cuts will dot plot show?
Will AI bubble concerns accelerate?
But here's the MATH:
Risk: 25,650 → 24,650
Reward: 25,650 → 27,500
Extended: 25,650 → 28,200
The Play:
Small position NOW 25,650
IF hawkish dip to 24,900-25,100
IF dovish → ADD on breakout above 26,300
Stop 24,650
Target 27,500, then 28,200
Position accordingly.
Follow officialjackofalltrades for institutional-grade futures analysis, Fed-day strategies, and professional risk management.
Drop a 📊 if you're trading NQ through the Fed decision.
Drop a 🎯 if this analysis helped your setup.
Drop a 💰 if you're ready for 27,500+ breakout.
Disclaimer: This is not financial advice. This post is for educational and informational purposes only. Always do your own research and manage your own risk.

AMD Hull MA Pullback: Strong Upside Projection Ahead!🔥 AMD Profit Playbook — Hull MA Pullback Power Move 🔥
Asset: AMD – Advanced Micro Devices Inc.
Market: NASDAQ
Style: Day/Swing Trade Profit Playbook
📈 Trade Thesis
The bullish structure stays intact with a clean HULL Moving Average pullback confirming continued upside momentum. The flow remains constructive as long as price respects trend behavior and avoids deep retracements.
🎯 Entry Plan
You can enter at any valid price zone based on your personal system, confirmation signals, or preferred demand levels. Traders use different timing tools — choose what aligns with your process. ⚙️📊
🛑 Stop Loss Zone
SL: 160.00
This is the “Thief SL” level — tight, sharp, and designed for aggressive traders only.
Note: Dear Ladies & Gentlemen (Thief OG’s), this is not a mandatory SL. Choose your own SL based on your risk appetite. Your money = your responsibility. Stay smart, stay safe. 💼⚠️
🎯 Take Profit Targets
Target 1 → 236.00
📌 Strong resistance + trap + liquidity pocket — smart place to escape with clean profits.
Target 2 → 260.00
📌 Heavy resistance + overbought zone + trap formation — high-reaction level, so secure profits before the crowd reacts.
Note: Dear Ladies & Gentlemen (Thief OG’s), TPs are guidance only. You decide your exits. You make money → you take money at your own risk. 💸🫡
👀 Related Pairs to Watch (Correlated / Sector Influence)
These tickers often react together due to semiconductor sector rotation, AI-demand cycles, and ETF weightings:
NASDAQ:NVDA
– Direct peer. Moves with AI spending cycles. Large swings can influence AMD sentiment.
NASDAQ:SMH (VanEck Semiconductor ETF)
– Sector trend indicator. If SMH pumps, AMD usually follows.
NASDAQ:SOXX (iShares Semiconductor ETF)
– Broad chip-market strength gauge. Market-wide chip themes impact AMD direction.
NASDAQ:QCOM
– Tech-chip correlation, especially during macro chip-cycle expansions.
NYSE:TSM
– Manufacturing leader. Capacity signals often impact AMD pricing expectations.
Watching these pairs helps you gauge risk-on/off behavior across semiconductors and improves timing on AMD entries/exits. ⚡📊
📘 Final Notes
This setup is crafted for fun with a “thief-style trading twist”, but still aligned with proper technical structure and TradingView’s rules.
Nothing here is a financial recommendation — just pure charting vibes, strategy style, and technical storytelling. 🎨📉📈
✨ “If you find value in my analysis, a 👍 and 🚀 boost is much appreciated — it helps me share more setups with the community!”
Disclaimer:
This is thief-style trading strategy just for fun. Not financial advice. Trade responsibly.
#AMD #NASDAQ #SwingTrade #DayTrade #HULLMA #BullishSetup #LiquidityZones #Semiconductors #SMH #SOXX #NVDA #TSLAstyleCharts #PriceAction #TechnicalAnalysis #ThiefStyleTrader 🚀🔥

Bearish Scenario on NQEyeing a bearish scenario on NQ after retracing it to 0.5 to 0.618 fib levels.
Bearish points
- Bearish Divergence on daily
- Rising wedge broken and retested
- Head n shoulder forming
Just waiting on breaking 24000 level to take a legendary short. And I beleive it should retrace back to atleast 0.5 fib level which is close to 21430.
Let's see....
Currently it seems it is going to pump from here to make a LH and then drop from there since it's oversold on Daily timeframe.
Please share your thoughts.

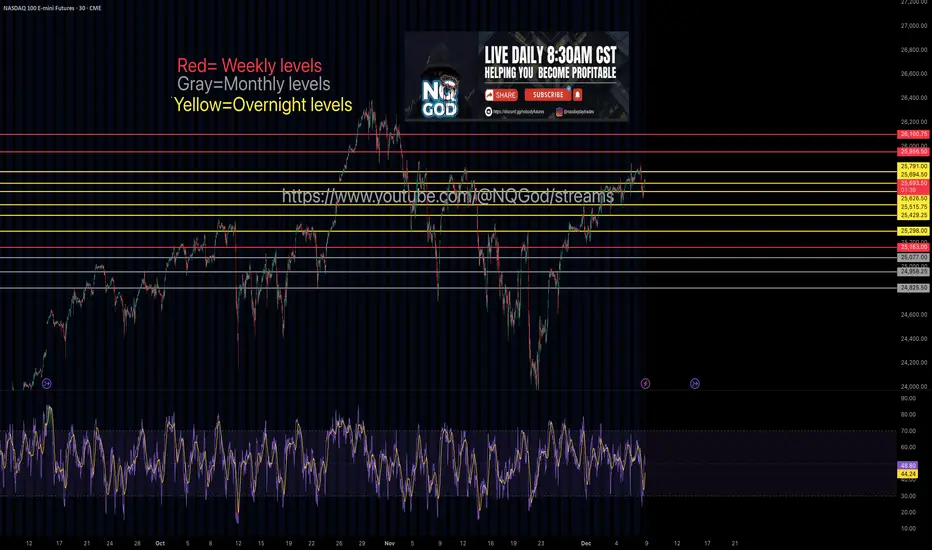
NQ Weekly, monthyl, Overnight levels from a Funded traderPing me with any quetions pretty straight forward levels here
NASDAQ formed its 1st 4H Golden Cross in 7 months!Nasdaq (NDX) completed last Friday its first 4H Golden Cross formation in more than 7 months (since May 01). This is taking place while the index is inside a Channel Up, making a V-shaped recovery from the November 21 Low.
The last time all the above conditions were fulfilled was exactly during the May Golden Cross. With the 4H MA200 (orange trend-line) as its Support, the index eventually hit its previous All Time High (ATH).
As we've entered the Fed week, we can finally see this move to the ATH Resistance, so our short-term Target on Nasdaq remains 26200.
---
** Please LIKE 👍, FOLLOW ✅, SHARE 🙌 and COMMENT ✍ if you enjoy this idea! Also share your ideas and charts in the comments section below! This is best way to keep it relevant, support us, keep the content here free and allow the idea to reach as many people as possible. **
---
💸💸💸💸💸💸
👇 👇 👇 👇 👇 👇

NASDAQ 100 (NQ1!): Bullish! Look For Valid Buys Only!Welcome back to the Weekly Forex Forecast for the week of Dec. 8 - 15th.
In this video, we will analyze the following FX market: NASDAQ (NQ1!) NAS100
The NASDAQ is showing bullish order flow, and it has been strong over the past couple of weeks.
Trading above 25,600 is making looking for shorts a no no.
A weakened US Dollar supports the idea of higher prices.
Wait for valid buy setups.
Enjoy!
May profits be upon you.
Leave any questions or comments in the comment section.
I appreciate any feedback from my viewers!
Like and/or subscribe if you want more accurate analysis.
Thank you so much!
Disclaimer:
I do not provide personal investment advice and I am not a qualified licensed investment advisor.
All information found here, including any ideas, opinions, views, predictions, forecasts, commentaries, suggestions, expressed or implied herein, are for informational, entertainment or educational purposes only and should not be construed as personal investment advice. While the information provided is believed to be accurate, it may include errors or inaccuracies.
I will not and cannot be held liable for any actions you take as a result of anything you read here.
Conduct your own due diligence, or consult a licensed financial advisor or broker before making any and all investment decisions. Any investments, trades, speculations, or decisions made on the basis of any information found on this channel, expressed or implied herein, are committed at your own risk, financial or otherwise.

NAS100 Trade Opportunity: Will Buyers Defend the Pullback?📊 NAS100 (NASDAQ-100) Swing Trade Opportunity 🚀
Bullish Pullback Setup | Super Trend ATR + TMA Confirmation
🎯 TRADE SETUP OVERVIEW
Instrument: NAS100 (NASDAQ-100 Index)
Timeframe: Swing Trade (4H-Daily)
Bias: BULLISH ✅
Setup Type: Super Trend ATR Line Pullback + Triangular Moving Average (TMA) Confirmation
🎬 ENTRY STRATEGY - "LAYERING METHOD" 📍
This strategy employs multiple limit order placement (Layer Entry Technique) to optimize entry points during the pullback phase.
Recommended Layer Entry Points:
🔵 Layer 1: 24,500
🔵 Layer 2: 24,600
🔵 Layer 3: 24,700
🔵 Layer 4: 24,800
⚡ Pro Tip: Scale layers based on your account size and risk tolerance. Each layer reduces average entry price.
🛑 STOP LOSS (SL)
Primary SL Level: 24,300
Strategy: Placed below the latest swing low + Super Trend confirmation
⚠️ DISCLAIMER: This SL is a guideline only. You must adjust based on your personal risk management strategy and account equity. Risk is YOUR responsibility.
🎁 PROFIT TARGETS (TP)
PRIMARY TARGET (TP1): 25,700 🎯
First resistance zone
Ideal for taking partial profits
Recommended exit: 30-50% position
SECONDARY TARGET (TP2): 26,200 🔥
Strong resistance + Historical overbought zone
⚠️ TRAP ALERT: Expect potential reversal or consolidation
Recommended exit: Remaining 50-70% position
Use trailing stop for final portion
📈 TECHNICAL CONFIRMATION
✅ Super Trend ATR: Aligned bullish
✅ TMA (Triangular MA): Pullback to key level confirmed
✅ Higher Lows Pattern: Intact
✅ Volume Analysis: Supporting move
🔗 RELATED PAIRS TO WATCH 💡
Positive Correlation (Move Together):
🔴 SPY (S&P 500 ETF) - $380-395 Range
Correlation: +0.92 | Often leads NAS100 lower-cap stocks
Key Point: If SPY breaks $390, expect NAS100 momentum confirmation
Watch for divergence signals
🔴 QQQ (Invesco QQQ Trust - Nasdaq 100 ETF) - $450-470 Range
Correlation: +0.99 | DIRECT tracking of NAS100
Key Point: Primary barometer for Nasdaq sentiment
Use for volume + volatility confirmation
🔴 TECH Sector ETF (XLK) - $205-215 Range
Correlation: +0.88 | Tech-heavy holdings overlap
Key Point: Tech rotation affects Nasdaq flow
Monitor for sector strength/weakness
Inverse Correlation (Move Opposite):
🔵 DXY (US Dollar Index) - $103-106 Range
Correlation: -0.65 | Stronger dollar = Risk-off mood
Key Point: If DXY spikes, expect NAS100 pullback extension
Monitor Fed rate expectations
🔵 TLT (20+ Year Treasury ETF) - $75-80 Range
Correlation: -0.58 | Rising yields hurt growth stocks
Key Point: Check 10Y yield trend for rate pressure
Watch Fed policy announcements
Key Monitoring Points:
📌 Earnings Season Impact: Tech earnings can create ±2% moves
📌 Fed Minutes/Announcements: Watch for rate guidance changes
📌 Market Breadth: Compare Advance/Decline lines for confirmation
📌 Volatility Index (VIX): Levels above 20 = Caution; Below 15 = Risk-on
📋 BEFORE YOU TRADE - CHECKLIST ✅
Is price currently at/near Layer 1 entry (24,500)?
Does current 4H chart show TMA pullback + Super Trend confluence?
Is volume confirming the setup?
Have you set your SL below 24,300?
Do you understand you're risking X to make Y?
Is this aligned with your trading plan?
🎓 FINAL NOTES
This is a mechanical swing trade setup designed for traders who use limit orders and layering technique. The confluence of Super Trend ATR + TMA creates higher probability entries during bullish pullbacks.
Remember: Trading involves substantial risk of loss. This idea is shared for educational analysis. Your trading decisions are YOUR responsibility alone.
Happy Trading! 🚀💎

Market Focus on QQQ — Bullish Setup Taking Shape!🎯 QQQ ($INVESCO NASDAQ-100) Bullish Swing Trade Setup
The Layered Entry "Thief" Strategy | Profit Playbook 💰
📈 MARKET OUTLOOK
The QQQ (INVESCO QQQ TRUST) is positioned for a bullish swing trade setup. 🚀 This technical analysis focuses on strategic multi-layer entry execution with defined risk/reward parameters suitable for intermediate swing traders.
🎪 ENTRY STRATEGY: "LAYERED THIEF" METHOD
This isn't your typical entry—we're using smart limit order layering 🎯 to accumulate positions at key support zones. Think of it as a professional scale-in approach!
📍 Limit Order Entry Layers:
Layer 1: $605.00 ⭐
Layer 2: $610.00 ⭐
Layer 3: $615.00 ⭐
Layer 4: $620.00 ⭐
💡 Pro Tip: Feel free to add additional layers ($625, $630, etc.) based on your risk tolerance and account size. The thief's advantage is patience and positioning!
Entry Triggers: Volume confirmation + Support zone bounce + Institutional accumulation signals 📊
🛑 STOP LOSS (Risk Management)
⚠️ THIEF SL: $590.00
📢 DISCLAIMER: This stop loss is a suggestion only. You are responsible for setting your own risk parameters based on your trading capital, risk tolerance, and market conditions. Trade at your own risk! 🎲
🎊 PROFIT TARGETS (Exit Strategy)
PRIMARY TARGET: $650.00 ✅
SECONDARY RESISTANCE: $660.00 ⚠️
Note: The $660 zone presents strong technical resistance combined with overbought conditions and potential reversal traps. We recommend taking profits at $650 and letting a small portion run if momentum confirms. Smart money moves!
📢 DISCLAIMER: Target levels are suggestions based on technical analysis. Your profit-taking strategy should align with your personal risk/reward ratio. Final exit decisions rest with you! 🎯
🔗 CORRELATED PAIRS TO MONITOR
Keep an eye on these related assets for confirmation signals:
🔴 QQQ Constituents & Index Correlation:
NASDAQ:AAPL (Apple Inc.) — Tech sector heavyweight; if AAPL breaks support, QQQ may follow 📱
NASDAQ:MSFT (Microsoft Corp.) — AI & cloud leader; typically leads QQQ moves upward 🤖
NASDAQ:NVDA (NVIDIA Corp.) — Semiconductor bellwether; massive correlation to tech rallies 💻
NASDAQ:TSLA (Tesla Inc.) — Growth driver; watch for momentum continuation signals ⚡
NASDAQ:GOOGL (Alphabet Inc.) — Large-cap tech anchor; supports QQQ uptrend confirmation 🔍
📊 Macro-Level Pairs:
NASDAQ:NDX (NASDAQ-100 Index) — Direct parent index; should mirror QQQ closely 📈
AMEX:SPY (S&P 500 ETF) — Broader market health check; risk-on environment confirmation ⭐
AMEX:IWM (Russell 2000 Small-Cap) — Risk sentiment gauge; divergence = caution ⚠️
TVC:DXY (US Dollar Index) — Inverse correlation; strong dollar = headwind for tech 💵
Key Correlation Points: Watch for tech sector strength continuation and macro risk-on sentiment. If NDX confirms, QQQ breakout is highly probable! 🚀
💡 STRATEGY BREAKDOWN
✅ Bullish Bias with patience-based accumulation
✅ Defined Risk at the $590 level
✅ Layered Entry for optimal position sizing
✅ Technical Confluence at resistance zones
✅ Risk/Reward Potential = Approx 1:2.5 ratio
🎓 TECHNICAL VALIDATION CHECKLIST
✅ Support zone identification at $605-620 range
✅ Volume analysis at entry levels
✅ RSI divergence confirmation
✅ Moving average alignment (200 SMA positioning)
✅ Institutional order flow patterns
✅ Market structure (Higher Highs/Higher Lows)
✨ If you find value in my analysis, a 👍 and 🚀 boost is much appreciated — it helps me share more setups with the community!
#QQQ #SwingTrade #TechETF #NASDAQ100 #TradingStrategy #ThiefStrategy #LayeredEntry #ProfitPlaybook #Bullish #TechnicalAnalysis #ETFTrading #RiskManagement #ActiveTrading

Will NAS100 Sustain Its Bullish Momentum After the Pullback?NAS100 🚀 Bullish Swing Setup | SuperTrend Pullback & Layered Entry Strategy
🎯 TRADE IDEA: NAS100 (US100) BULLISH SWING
Capitalize on a structured pullback in the NASDAQ 100! This plan leverages a proven indicator confluence for a high-probability long opportunity.
📊 ANALYSIS & CONFIRMATION:
Trend: Primary Bullish Trend is intact. ✅
Trigger: Price is pulling back into a demand zone, offering a favorable risk-to-reward entry.
Indicator: The SuperTrend ATR Line is acting as dynamic support on the 4H/Daily timeframe. A bounce from this level confirms our bullish bias.
⚡ STRATEGY: "THE THIEF" LAYERED ENTRY
This method uses multiple limit orders to average into a position, perfect for volatile markets like the NASDAQ.
Entry Zone: Look for entries between 25,200 - 25,600
Layer Example:
🟢 Limit Order 1: 25,600
🟢 Limit Order 2: 25,400
🟢 Limit Order 3: 25,200
👉 You can adjust the number of layers and prices based on your capital and risk appetite.
❗ RISK MANAGEMENT:
Stop Loss (SL): A decisive break below 24,800 would invalidate the bullish structure.
⚠️ IMPORTANT NOTE: This is MY protective stop. Dear Thief OG's 👑, you MUST adjust your position size and SL based on your personal risk management strategy. Protect your capital first!
🎯 PROFIT TARGETS:
Primary Target: 25,600 (Initial resistance & profit-taking zone).
Key Reasoning: We anticipate a reaction here due to:
Moving Average resistance.
Potential overbought conditions on lower timeframes.
A "trap" for late buyers.
👉 Smart Move: Consider taking partial profits at 25,600 and trailing your stop for the remainder. Escape the trap with your profits! 💰
⚠️ REMINDER: Dear Thief OG's 👑, your Take Profit (TP) is your own decision. Secure gains based on your trading plan and market behavior.
🔍 RELATED ASSETS & MARKET CORRELATION:
Watching these related instruments can provide confirmation and a broader market view.
TVC:DXY (U.S. Dollar Index): 🟡 NEGATIVE CORRELATION
A weakening Dollar ( TVC:DXY DOWN) is generally bullish for Nasdaq. If the Dollar is falling, it adds confidence to this long thesis.
USTECH (CFD on Nasdaq 100): 🟢 DIRECT CORRELATION
Moves in sync with NAS100. Perfect for cross-verifying price action and volume.
NASDAQ:AAPL , NASDAQ:MSFT , NASDAQ:TSLA (Mega-Caps): 🟢 HIGH IMPACT
These heavily weighted Nasdaq components drive the index. Bullish momentum in these stocks supports a rising NAS100.
FOREXCOM:SPX500 (S&P 500): 🟢 POSITIVE CORRELATION
A strong S&P 500 often lifts the Nasdaq. Monitor for overall U.S. market strength.
💬 Let me know your thoughts in the comments!
What's your entry strategy for the NAS100 this week?
#NAS100 #US100 #TradingView #SwingTrading #Bullish #SuperTrend #TradingStrategy #IndexTrading #LayeredEntry #ThiefStrategy

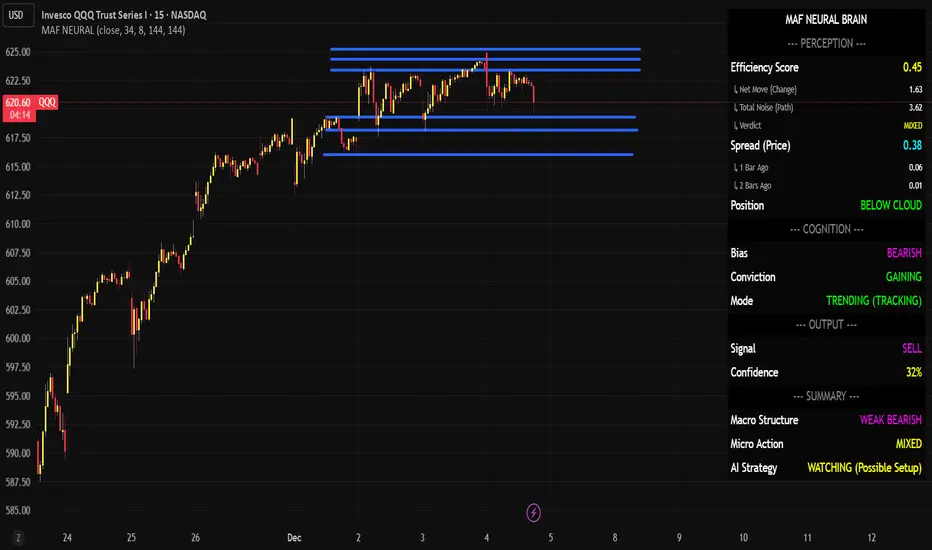
QQQ Neural Brain Analyzing Price Action — Watch ModeCurrent Status: The system is tracking a potential bearish setup, but conditions are not yet aligned for a high-probability entry. The signal is "SELL," but with low confidence (39%), suggesting caution.
1. Perception (The Data)
Efficiency Score: 0.59 (Mixed)
The market is moving with moderate efficiency. It is not purely "choppy" (which would be <0.30), but it isn't a clean, strong trend yet either.
Spread (Price): 0.44
Volatility is somewhat compressed.
Position: BELOW CLOUD
Price is trading below the key resistance cloud, which is a bearish technical characteristic.
2. Cognition (The Trend)
Bias: BEARISH
The underlying trend direction is down.
Conviction: GAINING
Despite the mixed price action, the algorithm's internal belief in the bearish bias is strengthening.
Mode: TRENDING (TRACKING)
The system is in "Tracking" mode, meaning it is following the price action closely rather than filtering it out as noise.
3. Output (The Signal)
Signal: SELL
Confidence: 39% (Low)
CRITICAL NOTE: While the directional signal is valid (Sell), the confidence is below the typical threshold for aggressive entry (usually 70%+). This indicates a higher risk of a false breakout or a "bear trap."
Final Verdict
Macro Structure: WEAK BEARISH
Micro Action: MIXED
AI Strategy: WATCHING (Possible Setup)
Trader's Takeaway: Do not short aggressively yet. The "Neural Brain" is telling you that while the structure is bearish (Price < Cloud) and conviction is building, the current moment lacks the momentum or clarity for a high-confidence trade.
Action: Wait for the Confidence to increase (ideally >60%) or for the Efficiency Score to improve before entering a short position.
NASDAQ NAS100 Analysis and My Trade Plan📊 Currently analysing NAS100 (NASDAQ), we can see that price has broken structure to the upside, confirming bullish intent. Right now, NAS100 is retesting the value area and the Point of Control (POC) on the volume profile — a critical zone to watch 👀📈
⚠️ Price action is a bit precarious. After a strong impulsive move, we’ve now seen a deep and aggressive retracement, which opens the door for potential bearish movement this week.
📆 However, my higher-timeframe bias remains bullish, with the weekly chart still supporting upward continuation.
📌 My plan:
If price holds above the current POC, then breaks and retests cleanly, I’ll be looking for long opportunities. If it breaks below the POC, I will step aside and abandon the long bias 🚫
This is not financial advice — just my personal market outlook. 💬📉📈

NASDAQ 100: Bullish! Look For Valid Buys With The Trend!Welcome back to the Weekly Forex Forecast for the week of Dec. 1-5th.
In this video, we will analyze the following FX market: NASDAQ (NQ1!) NAS100
The NASDAQ closed last week strong. It would indicated the potential for follow through going into this week, at least early.
Bear in mind that the previous 3 weeks were very bearish, coming down from ATHs, and forming a bearish MSS.
Look out for confirmations for valid trades. The overall trend is bullish, so I am personally looking for valid buys. A bearish MSS would invalidate those ideas.
Enjoy!
May profits be upon you.
Leave any questions or comments in the comment section.
I appreciate any feedback from my viewers!
Like and/or subscribe if you want more accurate analysis.
Thank you so much!
Disclaimer:
I do not provide personal investment advice and I am not a qualified licensed investment advisor.
All information found here, including any ideas, opinions, views, predictions, forecasts, commentaries, suggestions, expressed or implied herein, are for informational, entertainment or educational purposes only and should not be construed as personal investment advice. While the information provided is believed to be accurate, it may include errors or inaccuracies.
I will not and cannot be held liable for any actions you take as a result of anything you read here.
Conduct your own due diligence, or consult a licensed financial advisor or broker before making any and all investment decisions. Any investments, trades, speculations, or decisions made on the basis of any information found on this channel, expressed or implied herein, are committed at your own risk, financial or otherwise.

NASDAQ Santa Rally already underway.Nasdaq (NDX) has made a strong V-shaped recovery on its 1D MA100, as projected on our previous analysis and is extending the uptrend above the 4H MA200 (orange trend-line).
The rally may need a relief pull-back towards its 4H MA50 (blue trend-line) but technically, the seasonal end-of-the-year 'Santa Rally' is already underway.
V-shaped recovery and Inverse Head and Shoulders patterns typically target their 2.0 Fibonacci extensions. That is currently at 26600.
---
** Please LIKE 👍, FOLLOW ✅, SHARE 🙌 and COMMENT ✍ if you enjoy this idea! Also share your ideas and charts in the comments section below! This is best way to keep it relevant, support us, keep the content here free and allow the idea to reach as many people as possible. **
---
💸💸💸💸💸💸
👇 👇 👇 👇 👇 👇

CISD and Inversions for framing a narrative. My main ModelThe next day model of MMXM. Thought process on how you can frame your bias for the next day next 4h next hourly and next 15min

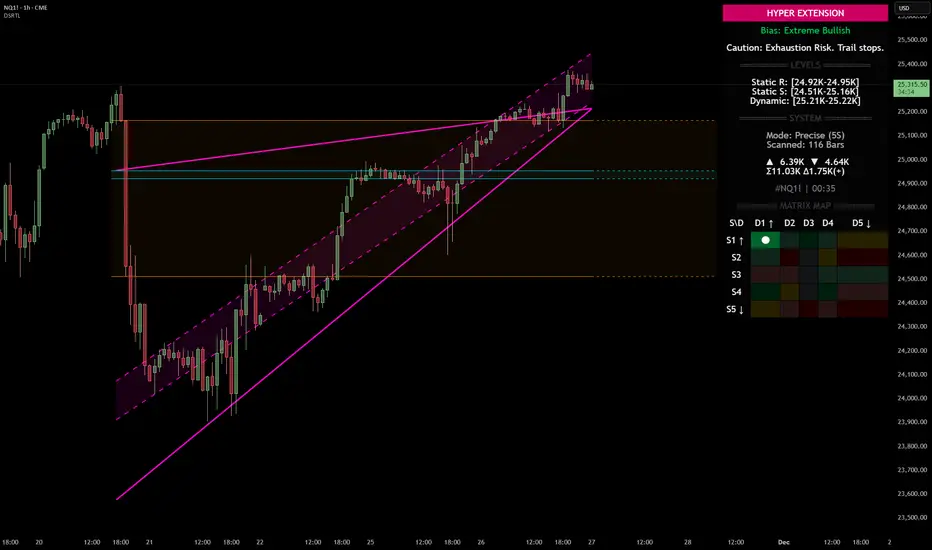
Nasdaq 100 (NQ): Hyper-Extended Momentum – Breakout or Exhaust
Category: Trend Analysis / Support & Resistance
Ticker: NQ1! (CME)
Analysis:
We are looking at the Nasdaq 100 Futures (NQ1!) on the 1H timeframe using the Dynamic Support & Resistance (DSRTL) system. The market is currently displaying a textbook example of a high-momentum breakout that has pushed into statistical extremes.
Here is the breakdown of the current technical landscape based on the indicator's Matrix Logic:
1. The "Hyper Extension" State (S1 / D1)
The indicator’s dashboard has triggered a "HYPER EXTENSION" alert. This specific state occurs when two conditions are met simultaneously:
• Static Breakout (S1): Price has cleared the horizontal resistance structures (indicated by the volume clusters).
• Dynamic Overextension (D1): Price has pierced above the upper limit of the dynamic trend channel (the purple trendlines).
2. Bias: Extreme Bullish
The current bias is rated as "Extreme Bullish". The trend is undeniably strong, confirmed by the positive Volume Delta (+965) shown on the dashboard. The price action is aggressive, creating a steep angle of ascent that has moved away from the mean.
3. The Warning Signal: Exhaustion Risk
While the trend is up, the system issues a cautionary note: "Exhaustion Risk. Trail stops."
In technical terms, when price action moves into "D1" (Dynamic Overextension), it indicates that the asset is trading significantly above its standard deviation or channel geometry. Historically, markets often seek mean reversion or consolidation after such rapid expansions to sustain the trend.
Key Levels to Watch:
• Dynamic Support (Immediate): The top of the purple channel (approx. 25,220) acts as the first layer of defense. A retest of this level is common after a breakout.
• Static Support (Structural): The breakdown level of the previous resistance, now turning into support around the 24.95K region.
Scenario Conclusion:
This is a pure momentum play. Traders should be aware that while the path of least resistance is up, the probability of a "snap-back" or consolidation increases the further price stretches above the dynamic channel. This is not a signal to short the trend immediately, but rather a signal to manage risk tightly on existing long positions.
Disclaimer: This analysis is for educational purposes only and explains the logic of the DSRTL technical indicator. It does not constitute financial advice.
Nasdaq Rallies into Thanksgiving, Meta Bounce Kicks InWall Street sentiment has perked up on renewed Fed cut bets, with the Nasdaq leading the way. This has allowed Facebook to finally rally from support levels I highlighted 3 weeks ago.
Matt Simpson, Market Analyst at City Index.

Pre open Heads Up. Index NSYECME_MINI:NQ1!
Looking for bearish prices on the Index triads for this NYO while the overall thought process is bullish on the HTF

Nasdaq 100, USD Index: Thanksgiving PerformanceToday I’m digging into my Excel data to see how the Nasdaq and the US Dollar Index performed across the three trading days either side of Thanksgiving.
Matt Simpson, Market Analyst at City Index.
