QE and YCC: What does it all mean?ECONOMICS:USCBBS
CBOT:ZB1! CBOT:ZN1! CME_MINI:NQ1!
There is growing market speculation that the Fed may tolerate inflation above 2% for longer, consistent with its Average Inflation Targeting (AIT) framework introduced in 2020.
This also implies that real rates i.e., nominal rates minus inflation are likely to fall significantly. Given this, we anticipate gold to continue trending higher as the U.S. dollar's purchasing power erodes with mounting debt, persistently higher inflation, and falling real yields.
What is QE?
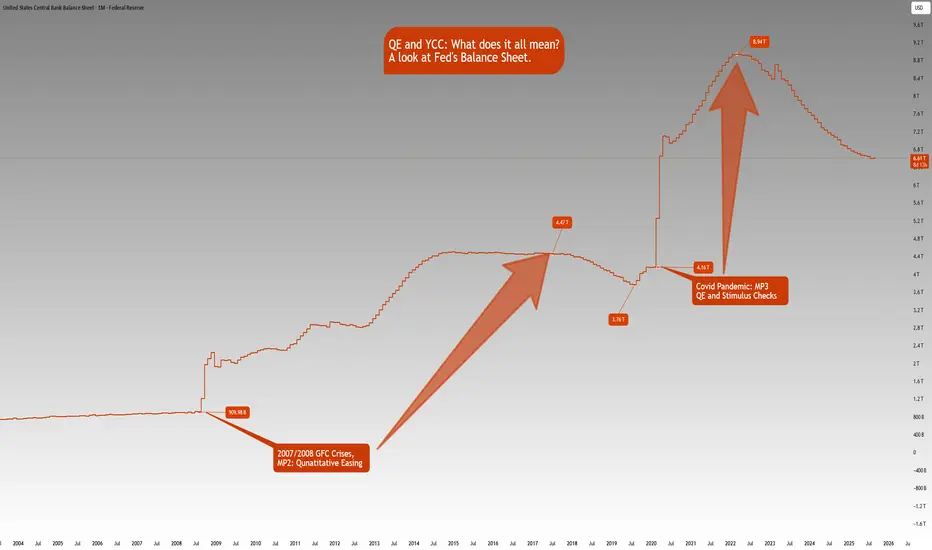
Quantitative Easing (QE) refers to the Fed injecting liquidity into financial markets by purchasing large quantities of assets such as Mortgage-Backed Securities (MBS) and U.S. Treasuries, especially during periods of economic stress like the Global Financial Crisis (2007–2008) and the COVID-19 downturn.
How Does QE Work?
Asset Purchases: The Fed buys large volumes of Treasuries and MBS from financial institutions.
Balance Sheet Expansion: These purchases expand the Fed's balance sheet (now hovering near $6.6 trillion, per FRED).
Increased Liquidity: Banks receive excess reserves in exchange, increasing system-wide liquidity.
Lower Interest Rates: Demand for bonds pushes prices higher and yields lower.
Economic Stimulus: Lower borrowing costs promote credit creation, investment, and consumer spending.
However, a key drawback of QE is asset price inflation. As seen between the GFC and the COVID-19 pandemic, low rates and excess liquidity drove significant appreciation in equities, housing, and other financial assets, even while consumer inflation remained near target.
QE vs. Stimulus Checks
If traditional interest rate policy is Monetary Policy 1 (MP1), then QE is MP2. Stimulus checks, or government handouts, fall under MP, a fusion of monetary and fiscal policy.
While QE primarily injects liquidity into financial institutions, stimulus checks inject purchasing power directly into households. This approach where the Treasury issues debt and the Fed purchases that debt, stimulates demand for real goods and services. We saw this during the post-COVID recovery, which brought a sharp rebound in consumer activity but also a surge in inflation, reaching a peak of 9.1% in June 2022 (CPI YoY).
QE impacts Asset Price Inflation
Stimulus Checks impact Goods & Services Inflation
What is YCC? (Yield Curve Control)
Yield Curve Control (YCC) is a policy whereby the central bank buys government debt across various maturities to control yields not just at the short end (via rates), but across the entire yield curve.
A prime example is the Bank of Japan, which has used YCC since 2016 to anchor 10-year JGB yields near zero. The Fed has not formally adopted YCC, but market participants believe it may lean in that direction in the future especially during crises where long-end rates rise undesirably. Mounting US debt and rising long end yields may prompt the Fed to step in and adopt YCC like BoJ has done previously.
Front-End Control: Managed via policy rates
Long-End Control: Central bank buys 5Y, 10Y, 20Y, 30Y Treasuries to anchor yields
Potential Risks of YCC:
Credibility Risk: If inflation rises while the central bank suppresses yields, it may lose market trust.
Currency Pressure: Artificially low yields may trigger speculative pressure on the currency (as seen with the yen under BoJ YCC).
We’ve kept this concise and digestible for now, but there’s more to unpack—especially on the long-term implications of coordinated monetary-fiscal policy (MP3), debt sustainability, and central bank credibility.
The Fed’s balance sheet chart shows how Fed’s balance sheet has increased:
Aug 1, 2008: $909.98B
Jul 1, 2017: $4.47T
Aug 1, 2019: $3.76T
Feb 1, 2020: $4.16T
Mar 1, 2022: $8.94T
Aug 1, 2025: $6.61T
Note that this is not just a US phenomenon. It is a world wide phenomena looking at many of the developed and emerging markets. The Debt to GDP ratios are increasing, Central Banks balance sheets are rising in tandem with rising government debt.
With the rate cutting cycle starting, it is a matter of time that we also see QE restarting.
If you’d like us to dive deeper into any of these topics in future educational blogs, let us know. We're happy to build on this foundation with more insights.
NASDAQ 100 E-MINI FUTURES
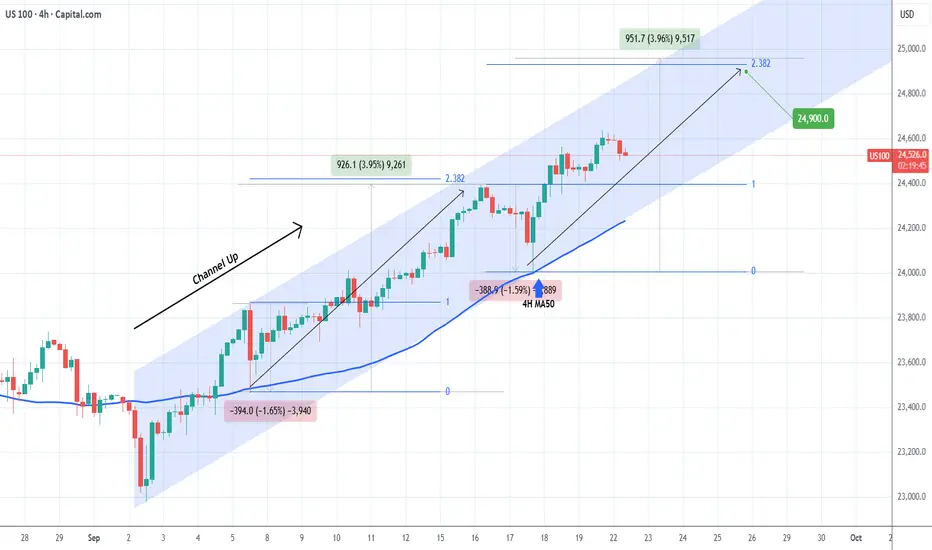
NASDAQ September's Channel Up targets 24900.Nasdaq (NDX) has been trading within a Channel Up since the September 02 Low and at the moment it is unfolding its 2nd Bullish Leg following the 4H MA50 (blue trend-line) bounce on September 17.
Based on the previous 4H MA50 Bullish Leg, the sequence should peak below the 2.382 Fibonacci extension at a maximum +3.96% rise. Our Target is slightly below those at 24900.
-------------------------------------------------------------------------------
** Please LIKE 👍, FOLLOW ✅, SHARE 🙌 and COMMENT ✍ if you enjoy this idea! Also share your ideas and charts in the comments section below! This is best way to keep it relevant, support us, keep the content here free and allow the idea to reach as many people as possible. **
-------------------------------------------------------------------------------
💸💸💸💸💸💸
👇 👇 👇 👇 👇 👇
NASDAQ 100 (NQ1!): Bullish! Wait For The Pullback, Then Buy ItWelcome back to the Weekly Forex Forecast for the week of Sept 22 - 26th.
In this video, we will analyze the following FX market: NASDAQ (NQ1!) NAS100
The NASDAQ is bullish. Let the market pullback to the +FVG (Internal Range Liquidity) a +FVG, and look for valid long setups on the lower timeframes.
Should the -FVG fail, then wait until it moves to a lower +FVG that will act as support. I do not recommend shorting this market until there is a clear bearish BOS.
Enjoy!
May profits be upon you.
Leave any questions or comments in the comment section.
I appreciate any feedback from my viewers!
Like and/or subscribe if you want more accurate analysis.
Thank you so much!
Disclaimer:
I do not provide personal investment advice and I am not a qualified licensed investment advisor.
All information found here, including any ideas, opinions, views, predictions, forecasts, commentaries, suggestions, expressed or implied herein, are for informational, entertainment or educational purposes only and should not be construed as personal investment advice. While the information provided is believed to be accurate, it may include errors or inaccuracies.
I will not and cannot be held liable for any actions you take as a result of anything you read here.
Conduct your own due diligence, or consult a licensed financial advisor or broker before making any and all investment decisions. Any investments, trades, speculations, or decisions made on the basis of any information found on this channel, expressed or implied herein, are committed at your own risk, financial or otherwise.

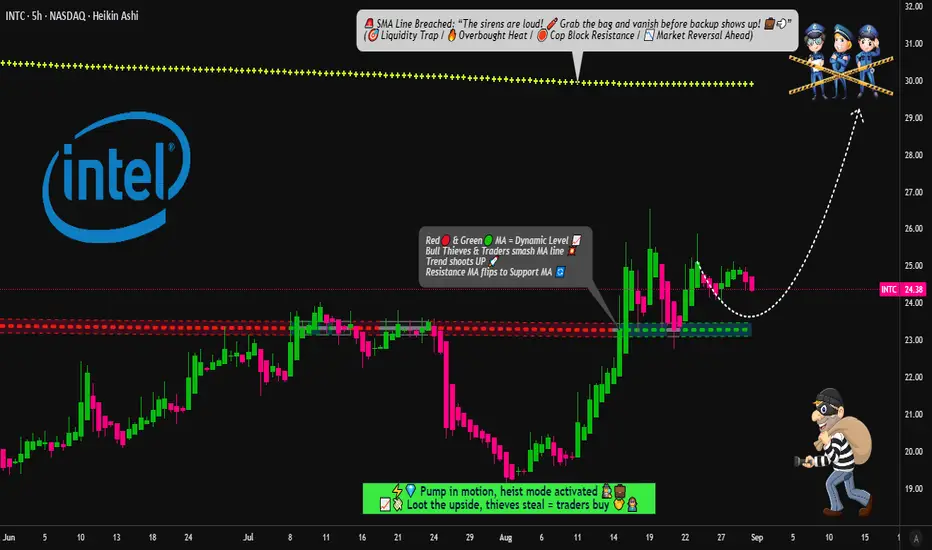
INTEL Heist Playbook: Buy the Dips, Escape Before the Sirens🔓💻 INTEL CORPORATION "Chip Heist" Stock Raid 💻🔓
🎯 Plan: Bullish Robbery | Targeting $30.00 | Stop Loss: $21.00
💰 Layered Limit Entries | Silicon Valley Loot | Calculated Takedown
🚨⚠️ Attention TRADERS, Tech Pirates & Market Mercenaries! ⚠️🚨
The INTC data vault is cracked, and the Thief Trader squad is executing a multi-layer LIMIT ENTRY HEIST – stacking shares like we're loading the getaway van. 🚐💾⚡
👀 We ain't chasing price – we're ambushing it with precision. Every discount? A planned acquisition.
💥 ENTRY: Any Price Level is a Gift 💥
"Bullish on Silicon" – we're collecting shares on any dip into value town!
Deploy buy limits at key psychological support layers: $25.00, $24.00, $23.00 (Add more layers based on your own capital).
Thief-style: We don't buy the hype; we steal the undervalued chips.
🛑 STOP LOSS: This is a Thief SL @ $21.00 🔐
Dear Ladies & Gentleman (Thief OG's), this is set at the breakdown panic zone – where the weak hands get shaken out.
Adjust your final SL based on your own risk appetite and strategy. Size wisely.
🎯 TARGET: $30.00 💸
The police barricade is there, so kindly escape with your stolen money before arrival.
We're targeting the next major resistance vault. Take profits and live to trade another day.
🧠 Swing Traders? Load the boat. Day Traders? Snatch the quick flips. Investors? Stack and hold. 💵☕
Use a trailing stop loss to protect your capital as the trend accelerates.
🕵️♂️ THIEF TRADER INSIGHTS:
📊 Backed by tech sector momentum, oversold bounces, and order block analysis.
🗞️ Earnings? Chip news? = increased volatility = adjust your layers accordingly.
⚠️ HEIST PROTOCOL:
✅ Avoid over-leveraging – this is a layering strategy, not a casino bet. 📉
✅ Use risk-adjusted position sizing on every limit order.
✅ Discipline is key. The market will deliver the discounts; you just need to be patient.
❤️🔥 Hit that 💥 LIKE & FOLLOW 💥 if you're riding with the Thief Squad!
Support the strategy. Respect the plan. Stack your gains like a true Market Outlaw.
🔔 Follow for the next HEIST. Big bags only. 💼🚀📈
“The market is a river of money—flowing from the impatient to the patient.” – Thief Trader
#INTC #Intel #StocksToWatch #TradingPlan #SwingTrading #StockMarket #Investing #LayeredEntries #ThiefTrader #ChipHeist
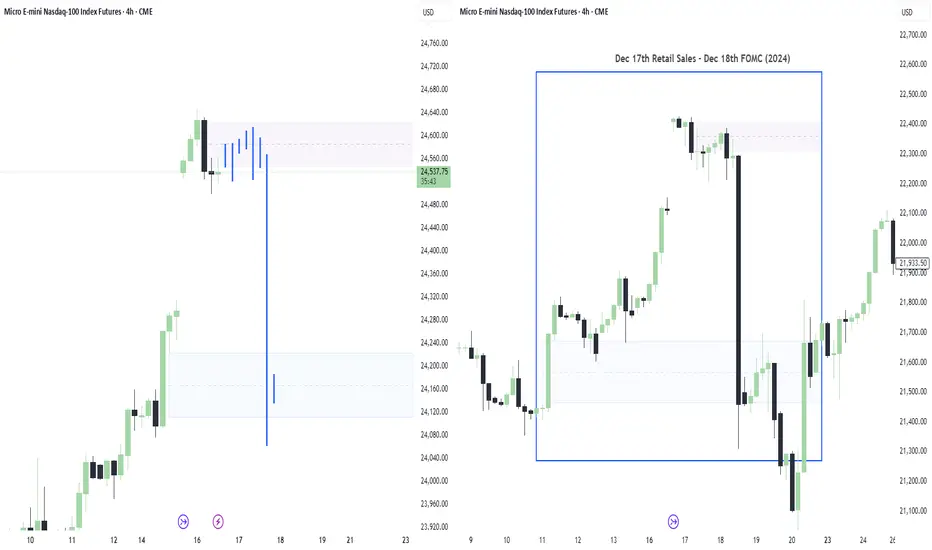
Nasdaq Echoing December FOMC| NQ1 Short SetupAfter spotting the new day opening gap, I immediately analyzed the charts for a comparable All-Time High NDOG scenario. Sure enough, I found nearly identical price action — unfolding on the same days and with the exact same news catalysts.
I’m planning to short from around 24,600.00, with the expectation that 24,200.00 will get taken out.
Let's see how this plays out⚡
Nasdaq looking downtoday as seen in the video, we are looking for a short.
yesterday showed a lot of rejection to the upside so maybe today we see the market test levels to the down side.
entry in blue.
stop in red
target in green
Elektra

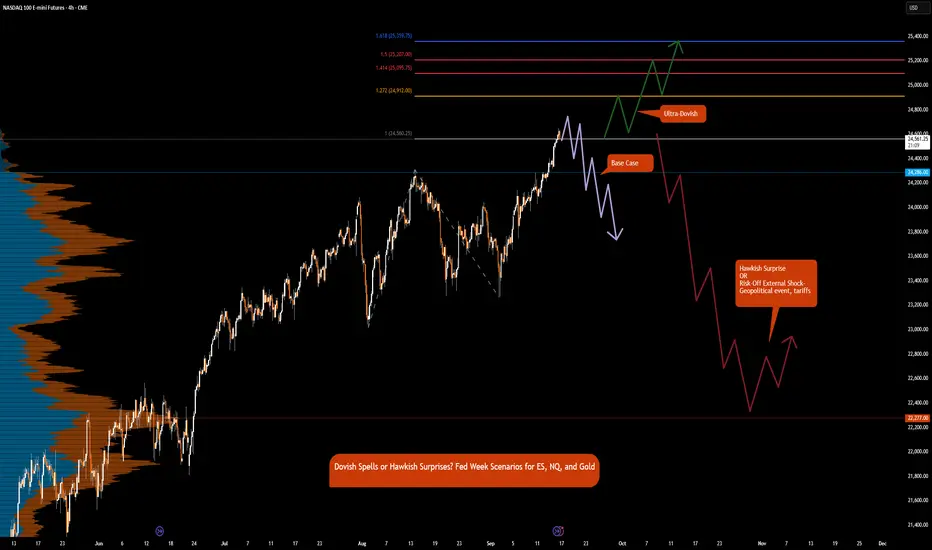
Dovish Spells or Hawkish Surprises? FOMC Prep for ES, NQ, GCLet’s start with the biggest event this week. Unless, of course, some unexpected headline swoops in and steals the spotlight — because markets love a good plot twist.
Emotions are running high, and volatility is flying around like confetti at a surprise party nobody asked for. But don’t worry, Chair Powell might just play the role of the calm voice in the chaos.
Markets are pricing in a 25 bps rate cut by the Fed this week. Interestingly, the future path of rate cut expectations has been in the doldrums. Is it a bird or a plane? No, it’s Superman. Likewise here, is it 1 cut or 2 cuts? No, it’s 3 cuts priced at this moment until the end of 2025.
Excuse the humor, but what fun is it if you cannot entertain yourself while analyzing the complexities of markets day in and day out. Execution is boring; risk management is much like dementors sucking out life force when risk is not respected. And analyzing and preparation is where the creativity and fun is.
And as Kurt Angle would say, it is “ True ”.
Index futures including ES futures and NQ futures have all climbed steadily higher since September 2 low. Markets are turning higher in anticipation of a new bull run.
Gold futures are rallying, currently trading above $3700. Since the Jackson Hole dovish pivot, gold has not looked back and has rocketed higher above major resistance.
Our focus is on the Fed meeting. All eyes will be on the forward guidance; risks to inflation, risks for the labor market and FED’s SEP (Summary of Economic Projections). This also includes GDP forecasts and the most anticipated Dot Plot.
Which of the two mandates will the Fed prioritize, labor market weakness or sticky inflation? The interesting thing to note is that despite sticky inflation, markets are anticipating 3 cuts of 25 bps for each of the meetings this year.
Thus far, as we have previously mentioned, the Fed will likely be moving away from their 2% inflation target to an average inflation target in the range of 2% to 3%.
This also implies that real rates i.e., nominal less inflation are going to fall sharply lower.
Given this, we anticipate gold to continue higher as the US Dollar's purchasing power erodes away, with mounting debt, higher inflation and falling real yields.
The real question we should be asking is:
What if the meeting outcome is hawkish with the Fed delivering just 1 cut in the September meeting and staying on hold for the remainder of the year?
What other risks are there that could pull stocks and indexes lower? And bonds higher?
Tariffs at this point seem like an old talk unless something reinvigorates and puts them on the front and center of market worries.
Based on these thoughts, here are our scenarios:
Base Case:
25 bps cuts and dovish guidance but iterates meeting by meeting approach.
ES & NQ:
Data dependent Fed, that is likely behind the curve and markets may translate this as Fed too slow to react to emerging risks, risks of recession goes higher. In this case, although stocks may push higher with rates coming down initially, in our view, much of this is priced in and this may be ‘sell the fact moment’.
Portfolio adjustment: Sell index futures, Buy Gold and Bonds.
Ultra-Dovish:
Fed’s dot plot confirms 2 additional rate cuts of 25 bps for Oct and Dec meeting and further 4 cuts till end of 2026 to bring terminal rate lower to 250-275.
USD weakens further, real rates sink, reinforcing gold bid.
Portfolio adjustment: Buy everything. Buy the dip.
Hawkish Surprise
Only 25 bps in September, then pause
ES & NQ:
• Sharp pullback as equities reprice for tighter liquidity.
• ES could retrace recent gains, downside risk toward 4,900–5,000 zone.
• NQ likely hit harder due to tech sensitivity to discount rate.
GC:
• Short-term correction as USD firms and yields spike.
• However, downside may be limited if market shifts focus back to debt & long-term inflation risks.
Risk-Off External Shock- Geopolitical event, tariffs
ES & NQ:
• Drop as risk sentiment sours; defensives outperform growth.
• Bonds rally, yields fall, curve steepens if Fed cut expectations accelerate.
GC:
• Strong safe-haven bid, spikes higher regardless of Fed stance.
Comment with your thoughts and let us know how you see the markets shaping up this week
A Tolled BellThe first bell has rung. A bridge is being paved across the $6000 range.
IF it blows up, it likely won't happen until the bridge is constructed and sentiment improves. Expect a few heartfelt endeavors to shoot above $6,660. Base case is long term crab market.

NASDAQ Approaching a critical +1 year Resistance.Nasdaq (NDX) is close to hitting our 24500 bullish target, which as we explained on our previous analysis represents a +6.78% rise, the technical Bullish Leg of the Channel Up that started back in mid-May.
This pattern is however headed towards a +1 year Resistance level, the Higher Highs trend-line that started on the July 11 2024 High. Technically, we should be expecting a rejection there and pull-back towards at least the 1D MA50 (blue trend-line), if not the 1D MA100 (green trend-line), which is where an identical Channel Up in 2024 that topped on December 16 2024, found Support at.
Even the 1D RSI sequences among the two patterns look similar. As a result, there are high probabilities to see a short-term correction there, which will in turn fuel the end-of-year rally. Our new medium-term Target is 25000.
-------------------------------------------------------------------------------
** Please LIKE 👍, FOLLOW ✅, SHARE 🙌 and COMMENT ✍ if you enjoy this idea! Also share your ideas and charts in the comments section below! This is best way to keep it relevant, support us, keep the content here free and allow the idea to reach as many people as possible. **
-------------------------------------------------------------------------------
💸💸💸💸💸💸
👇 👇 👇 👇 👇 👇

NQ Long IdeaI am not a Indices guy this is my Idea for NQ/ES We have retraced to discounted levels and OTE levels with Premium Array

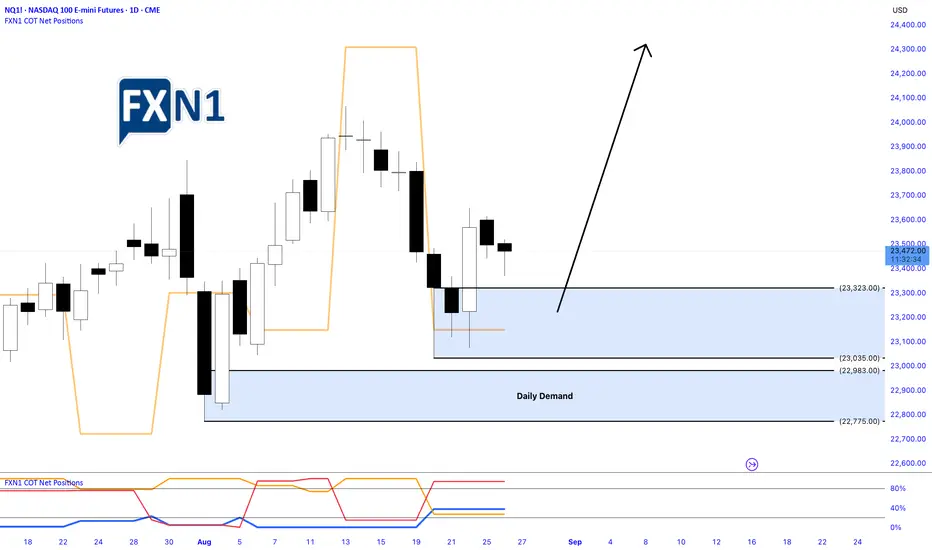
Nasdaq Pulls Back After Friday’s Rally: Identifying Demand ZoneYesterday, the Nasdaq underwent a pullback following a robust bullish surge on Friday. During this correction, a fresh Daily Demand Zone emerged on the chart, signaling potential support levels. Traders are now eyeing this area as an opportunity to position for a possible new high, should the market retrace further today. The current outlook favors a long setup, with anticipation of a continued upward move contingent on the price respecting the identified demand zone.
✅ Please share your thoughts about NQ1! in the comments section below and HIT LIKE if you appreciate my analysis. Don't forget to FOLLOW ME; you will help us a lot with this small contribution.
NasdaqNasdaq continues its bullish rally, after the last attempt to break above this key level failed, 24000 was finally broken. Let's head to 24100

Multi-Asset Market Analysis & Trade IdeasAnalysis Date : September 10, 2025
Trading Analyst : Institutional Intelligence Framework
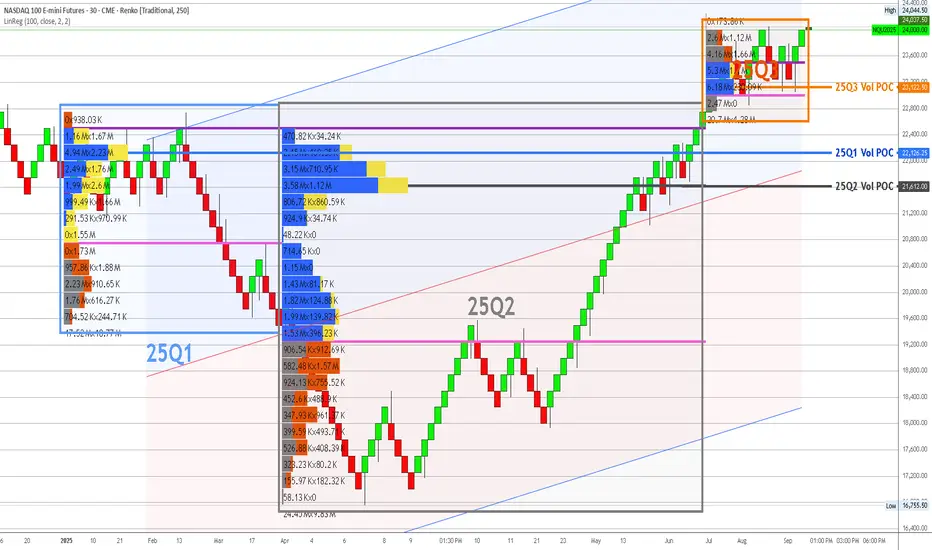
Methodology : Dual Renko Chart System with Enhanced Volume Profile Analysis
Executive Summary
Current market analysis reveals exceptional institutional opportunities across equity indices with significant commodity sector divergence. The enhanced institutional intelligence framework identifies unprecedented buying dominance in major equity markets while revealing dangerous extensions in traditional safe-haven assets.
Portfolio Allocation Strategy : 75-85% equity allocation with minimal commodity/currency exposure based on institutional positioning intelligence.
Primary Opportunities (70-85% Total Allocation)
1. NASDAQ 100 (NQ) - 25-30% ALLOCATION
Classification : PRIMARY OPPORTUNITY - Institutional Backing
YTD View:
Institutional Intelligence :
Q3 Volume Analysis : 26.8:1 buying dominance (6.18M UP vs 230.69K DOWN)
Current Position : 23,963 (+3.4% above Q3 POC 23,186)
Support Structure : Exceptional multi-quarter institutional foundation
Risk Assessment : LOWEST RISK - strongest institutional conviction identified
Trade Recommendations :
Bullish Scenario (65% probability) :
Entry : /MNQ at current levels or any pullback to 23,500-23,600
Position Size : Maximum 2.5% account risk per position
Target 1 : 24,500 (close 50% position)
Target 2 : 25,000 (close 25% position)
Target 3 : 25,500+ (trail remaining 25%)
Stop Loss : 23,000 (below Q3 institutional support)
Neutral Scenario (25% probability) :
Range : 23,200-24,200 consolidation
Strategy : Scale into positions on weakness toward 23,400
Management : Hold core position, trade edges of range
Re-evaluation : Weekly basis for breakout confirmation
Bearish Scenario (10% probability) :
Trigger : Break below 23,000 (institutional support failure)
Action : Exit all positions immediately
Re-entry : Require fresh institutional accumulation evidence
Risk Control : Maximum 2% loss on allocation
2. S&P 500 (ES) - 25-30% ALLOCATION
Classification : PRIMARY OPPORTUNITY - Strong Institutional Support
3-QTR View:
YTD View:
Institutional Intelligence :
Q3 Volume Analysis : 5.21:1 buying dominance (11.3M UP vs 2.17M DOWN)
Current Position : 6,550 (+2.7% above Q3 POC 6,375)
Support Structure : Consistent institutional accumulation across quarters
Risk Assessment : LOW RISK - exceptional institutional backing
Trade Recommendations :
Bullish Scenario (70% probability) :
Entry : /MES at current levels or pullback to 6,450-6,500
Position Size : Maximum 2.5% account risk per position
Target 1 : 6,650 (close 50% position)
Target 2 : 6,750 (close 25% position)
Target 3 : 6,850+ (trail remaining 25%)
Stop Loss : 6,300 (below Q3 institutional support)
Neutral Scenario (20% probability) :
Range : 6,400-6,600 consolidation
Strategy : Accumulate on weakness, trim on strength
Management : Maintain core position size
Monitoring : Weekly institutional level respect
Bearish Scenario (10% probability) :
Trigger : Break below 6,300 (institutional support violation)
Action : Systematic position reduction
Stop Loss : 6,250 (complete exit level)
Re-entry : Wait for institutional re-engagement signals
3. DOW JONES (YM) - 20-25% ALLOCATION
Classification : HIGH CONVICTION - YTD POC Validation
3-QTR View:
YTD View:
Institutional Intelligence :
Q3 Volume Analysis : 11.5:1 buying dominance (455.32K UP vs 83.17K DOWN)
YTD POC Alignment : Perfect alignment with Q1 POC at 45,150
Current Position : 45,651 (+1.1% above institutional consensus)
Risk Assessment : VERY LOW RISK - optimal positioning
Trade Recommendations :
Bullish Scenario (75% probability) :
Entry : /MYM at current levels (optimal positioning confirmed)
Position Size : Maximum 2.5% account risk per position
Target 1 : 46,200 (close 40% position)
Target 2 : 46,800 (close 30% position)
Target 3 : 47,500+ (trail remaining 30%)
Stop Loss : 44,800 (below YTD/Q1 POC consensus)
Neutral Scenario (20% probability) :
Range : 45,000-46,000 consolidation around institutional consensus
Strategy : Hold core position, add on dips to 45,200
Management : Optimal risk/reward positioning maintained
Advantage : Minimal downside to institutional support
Bearish Scenario (5% probability) :
Trigger : Break below 45,000 (YTD POC violation)
Action : Reduce position by 50%
Ultimate Stop : 44,500 (complete exit)
Assessment : Highly unlikely given institutional validation
Secondary Opportunities (15-20% Total Allocation)
4. WTI CRUDE OIL (CL) - 15-20% ALLOCATION
Classification : SOLID OPPORTUNITY - Strong Institutional Foundation
3-QTR View:
YTD View:
Institutional Intelligence :
Q3 Volume Analysis : 1.94:1 buying dominance (1.38M UP vs 710.76K DOWN)
Current Position : 63.27 (within Q3 institutional accumulation zone)
Support Structure : Massive Q2 institutional accumulation at 57.50
Risk Assessment : LOW RISK - multiple institutional support layers
Trade Recommendations :
Bullish Scenario (60% probability) :
Entry : /MCL at current levels or pullback to 62.50-63.00
Position Size : Maximum 2% account risk per position
Target 1 : 67.00 (close 50% position)
Target 2 : 69.00 (close 25% position)
Target 3 : 71.00+ (trail remaining 25%)
Stop Loss : 61.50 (below Q3 institutional support)
Neutral Scenario (30% probability) :
Range : 62.00-65.00 consolidation within institutional zone
Strategy : Scale into positions on weakness
Management : Patient accumulation approach
Support : Strong institutional backing provides downside protection
Bearish Scenario (10% probability) :
Trigger : Break below 61.00 (institutional support failure)
Action : Exit positions systematically
Re-entry : 58.00 area (Q2 POC support)
Risk Management : Tight stops due to support proximity
Defensive Positions (8-12% Total Allocation)
5. NATURAL GAS (NG) - 8-12% ALLOCATION
Classification : MODERATE RISK - Declining Institutional Engagement
3-QTR View:
YTD View:
Institutional Intelligence :
Q3 Volume Analysis : Mixed activity with reduced institutional participation
Q1 Peak : 10.6:1 buying dominance (697K UP vs 65K DOWN) - historical high
Current Concern : 65% volume decline from Q1 peaks
Risk Assessment : MODERATE - institutional disengagement evident
Trade Recommendations :
Bullish Scenario (45% probability) :
Entry : Current levels only with tight risk controls
Position Size : Maximum 1.5% account risk per position
Target 1 : 3.40 (close 60% position)
Target 2 : 3.60 (close remaining 40%)
Stop Loss : 2.90 (below Q3 POC support)
Neutral Scenario (35% probability) :
Range : 3.00-3.20 consolidation
Strategy : Avoid new positions, monitor for re-engagement
Management : Maintain defensive positioning
Watch : Volume quality for institutional return
Bearish Scenario (20% probability) :
Trigger : Break below 2.90 (Q3 support failure)
Action : Complete position liquidation
Assessment : Institutional abandonment acceleration
Avoidance : No re-entry until fresh accumulation evidence
Risk Management Positions (8-13% Total Allocation)
6. EURO FUTURES (6E) - 5-8% ALLOCATION
Classification : DEFENSIVE ONLY - Dangerous Extension
3-QTR View:
YTD View:
Institutional Intelligence :
YTD POC Analysis : 1.0525 (aligned with Q1 POC)
Current Position : 1.1769 (+12.9% above institutional consensus)
Extension Risk : DANGEROUS - trading far beyond smart money positioning
Risk Assessment : HIGH RISK - profit-taking territory
Trade Recommendations :
Bullish Scenario (25% probability) :
Entry : AVOID new long positions
Existing Positions : Systematic profit-taking recommended
Target : 1.1850 maximum (close all positions)
Risk : Overextension beyond institutional support
Neutral Scenario (35% probability) :
Range : 1.1650-1.1800 at dangerous extension levels
Strategy : Range trading only with tight stops
Position Size : Maximum 1% account risk
Management : Defensive positioning required
Bearish Scenario (40% probability) :
Trigger : Any breakdown below 1.1700
Target : Return to institutional consensus (1.0525)
Action : Short opportunities on strength
Strategy : Mean reversion to YTD POC likely
7. GOLD FUTURES (GC) - 3-5% ALLOCATION
Classification : EXTREME CAUTION - Maximum Extension
3-QTR View:
YTD View:
Institutional Intelligence :
Extension Analysis : 12.2% above all institutional positioning
Q2 Peak Activity : 11.5:1 buying dominance at 3,430 levels
Current Position : 2,676 (extremely overextended)
Risk Assessment : MAXIMUM RISK - correction vulnerability
Trade Recommendations :
Bullish Scenario (15% probability) :
Entry : AVOID all new long positions
Existing : Immediate profit-taking recommended
Risk : Extreme overextension unsustainable
Management : Defensive exit strategy only
Neutral Scenario (25% probability) :
Range : 2,650-2,700 at unsustainable levels
Strategy : No positioning recommended
Assessment : Range trading too risky given extension
Monitoring : Watch for breakdown signals
Bearish Scenario (60% probability) :
Target : 3,400-3,500 (return to institutional zones)
Correction Magnitude : 12-15% decline likely
Strategy : Short opportunities on any strength
Entry : /MGC shorts on rallies above 2,690
Stop : 2,720 (tight risk control)
Target : 3,450 (institutional accumulation zone)
Risk Management Protocols
Position Sizing Framework
Maximum Risk Per Trade : 2% of account value
Maximum Sector Exposure : 6% (energy, metals, currencies)
Portfolio Heat : Maximum 15% total risk across all positions
Cash Reserve : 5-12% for opportunities and margin requirements
Stop Loss Hierarchy
Tactical Stops : 2-3 Renko blocks on execution charts
Strategic Stops : Below/above institutional POC levels
Emergency Stops : Below major quarterly support levels
Time Stops : Exit if no progress within 15 trading days
Profit Taking Protocol
Systematic Approach :
Target 1 : Close 40-50% of position at 2:1 risk/reward
Target 2 : Close 25-30% of position at 3:1 risk/reward
Target 3 : Trail remaining 20-25% with institutional level stops
Correlation Management
Equity Exposure : Maximum 75-85% combined (NQ+ES+YM)
Commodity Exposure : Maximum 25-30% combined (CL+NG)
Currency Exposure : Maximum 10% (6E only)
Safe Haven Exposure : Maximum 5% (GC defensive only)
Market Scenario Planning
Scenario A: Continued Equity Strength (60% probability)
Characteristics : Institutional accumulation continues, economic resilience
Winners : NQ, ES, YM (maximize equity allocation)
Losers : GC, 6E (extension corrections)
Strategy : Aggressive equity positioning, defensive commodity stance
Scenario B: Market Consolidation (25% probability)
Characteristics : Range-bound trading around institutional levels
Winners : YM (optimal positioning), CL (institutional support)
Neutral : NQ, ES (trade ranges)
Strategy : Reduce position sizes, focus on institutional level trading
Scenario C: Risk-Off Environment (15% probability)
Characteristics : Institutional support failure, flight to quality
Winners : Cash, defensive positioning
Losers : All risk assets
Strategy : Emergency protocols, systematic position reduction
Trigger : Break below major institutional support levels
Weekly Monitoring Checklist
Daily Assessment
Institutional POC level respect across all markets
Volume quality and institutional engagement trends
Position sizing within risk parameters
Stop loss proximity to institutional levels
Weekly Review
Portfolio allocation vs. target percentages
Risk/reward ratios for all open positions
Institutional volume profile evolution
Correlation analysis across positions
Performance tracking vs. benchmarks
Monthly Evaluation
Quarterly volume profile updates
YTD POC alignment reassessment
Strategy performance attribution
Risk management protocol effectiveness
Market regime change identification
Key Success Factors
Institutional Intelligence Priority
Decision Hierarchy :
Institutional volume profile positioning (strategic)
YTD POC alignment validation (tactical)
Technical indicator confirmation (execution)
Risk management protocols (defensive)
Discipline Requirements
Systematic adherence to position sizing formulas
Emotional detachment from individual trade outcomes
Institutional level respect over short-term price action
Professional risk management with systematic protocols
Performance Expectations
Win Rate Target : 55-65% (institutional backing advantage)
Risk/Reward Minimum : 2:1 average across all trades
Maximum Drawdown : <8% of trading capital
Consistency : Positive monthly returns 65%+ of time
Disclaimer : All trading involves risk of loss. Past performance does not guarantee future results. Position sizes and risk management protocols must be adjusted based on individual account size and risk tolerance. This analysis is for educational purposes and should not be considered personalized investment advice.
Document Status : Active trading framework requiring weekly updates and quarterly reassessment.
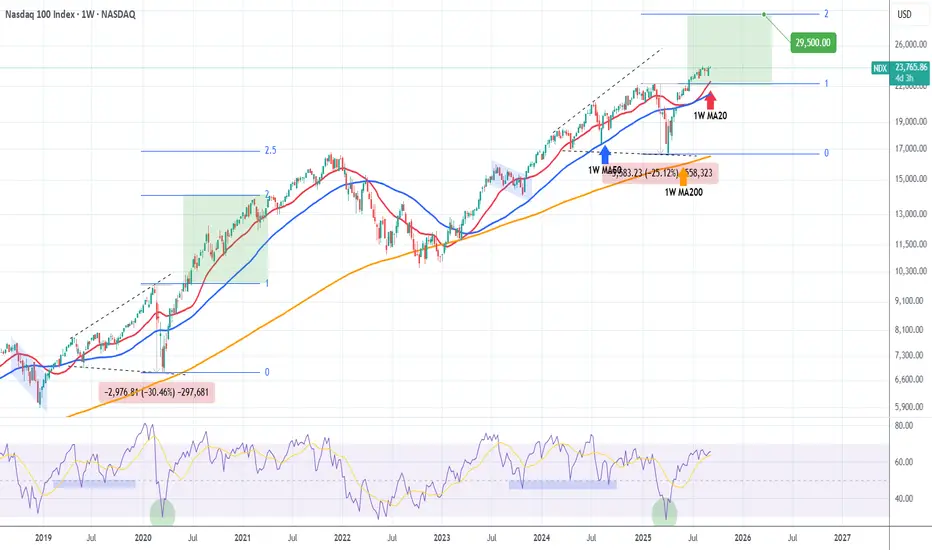
NASDAQ If this trend-line holds, it targets 29500.Nasdaq (NDX) has it's long-term bullish trend intact as it has mainly held its 1W MA50 (blue trend-line) as its Support. If it manages to hold the 1W MA20 (red trend-line) also, then it can extend the uptrend for even longer as the similarities overall with the 2020 fractal are noticeable.
As you can see, the March - April 2025 correction in particular, is very similar with the March 2020 COVID crash. Both sharp declines (-25% and -30% respectively), found Support just before hitting the 1W MA200 (orange trend-line). The 2020 fractal managed to rebound and reached its 2.0 Fibonacci extension and even extended the uptrend to the 2.5 Fib, all while the 1W MA20 remained intact (1W candles closed above it).
Even their 1W RSI sequences are identical and even on the price action that preceded the Megaphones. As a result, we remain bullish long-term as long as the 1W MA20 holds, targeting 29500 (Fib 2.0 extension).
-------------------------------------------------------------------------------
** Please LIKE 👍, FOLLOW ✅, SHARE 🙌 and COMMENT ✍ if you enjoy this idea! Also share your ideas and charts in the comments section below! This is best way to keep it relevant, support us, keep the content here free and allow the idea to reach as many people as possible. **
-------------------------------------------------------------------------------
💸💸💸💸💸💸
👇 👇 👇 👇 👇 👇
BTCUSD outlook and walkthrough. 9/9/2025, MondayBITSTAMP:BTCUSD
CSD model. Expansion. Retracement Market Profile

NASDAQ (NQ1!): Buy It Until The Market Notifies Us Otherwise!Welcome back to the Weekly Forex Forecast for the week of Sept 8 - 12.
In this video, we will analyze the following FX market: NASDAQ (NQ1!) NAS100
The NASDAQ looks poised to move higher. There is potential for it to make a new ATH.
Wait for pullbacks to poi's for valid long setups.
I do not see a reason to sell this market. Until there is a bearish break of market structure, buys are the ticket.
Enjoy!
May profits be upon you.
Leave any questions or comments in the comment section.
I appreciate any feedback from my viewers!
Like and/or subscribe if you want more accurate analysis.
Thank you so much!
Disclaimer:
I do not provide personal investment advice and I am not a qualified licensed investment advisor.
All information found here, including any ideas, opinions, views, predictions, forecasts, commentaries, suggestions, expressed or implied herein, are for informational, entertainment or educational purposes only and should not be construed as personal investment advice. While the information provided is believed to be accurate, it may include errors or inaccuracies.
I will not and cannot be held liable for any actions you take as a result of anything you read here.
Conduct your own due diligence, or consult a licensed financial advisor or broker before making any and all investment decisions. Any investments, trades, speculations, or decisions made on the basis of any information found on this channel, expressed or implied herein, are committed at your own risk, financial or otherwise.

Labor Market vs. Inflation Risks: What Traders Should WatchCME_MINI:NQ1! CME_MINI:ES1! CME_MINI:MNQ1! CME_MINI:MES1! CBOT_MINI:YM1! CBOT:ZN1! CBOT:ZB1! ECONOMICS:USNFP
The stock market is currently holding near all-time highs. Today, the BLS (Bureau of Labor Statistics) report, which includes the NFP (non-farm payrolls), will be released at 7:30 am CT.
Market participants are closely watching the non-farm payrolls, with the forecast at 75K, as well as any prior revisions to earlier NFP numbers. The unemployment rate is expected at 4.3%, a slight increase of 0.1%.
Looking ahead, upcoming key events include inflation data and the September FOMC rate decision:
• Aug PPI (Sep 10): A gauge of upstream price pressures. Hot numbers would signal renewed inflation risks.
• Aug CPI & Core CPI (Sep 11): Critical headline data. A softer print would support the dovish case.
• Fed Decision (Sep 17): This meeting comes after the Aug NFP data release (Sep 5).
While there is broad optimism and euphoria in the market, we remain cautious based on our analysis of major futures indexes. Traders should be mindful of signals that could point to a pullback.
Our reasoning:
Markets are currently pricing in two 25 bps cuts for the September and October FOMC meetings, which would bring the target rate down to 3.75%–4.00%.
Additionally, markets are now pricing in four 25 bps cuts in 2026. Prior to the Jackson Hole meeting and recent Fed-related developments, expectations were for three cuts in 2025 and two cuts in 2026.
Does this imply that the effective tariff rate is benign? Is inflation expected to fall, or does this suggest that the Fed is willing to tolerate average inflation in the 2.5%–3.0% range?
The upcoming Fed meeting is likely to emphasize risks to the labor market, while downplaying inflation risks, highlighting the tradeoff within the Fed’s dual mandate.
Other considerations:
Seasonal and cyclical flows also suggest that equity indexes tend to underperform in September and October on average.
Risk-Monitoring Framework: Signs of a Pullback
Given the deteriorating macro backdrop, further steepening of the yield curve, persistently high long-end yields, and the heavy concentration of stock market capitalization in the Mag 9 stocks, it is critical to monitor:
1. Rates & Yield Curve
• 2s10s & 5s30s steepening: Excess steepening with long-end yields above 4.5% would tighten financial conditions.
• SOFR futures spreads: Divergence vs. FOMC guidance can signal rate-path misalignment.
2. Labor Market Signals
• NFP revisions: Downward revisions of >50K would reinforce labor weakness.
• Unemployment rate: Sustained above 4.3% could mark a turning point for the Fed’s labor mandate.
3. Inflation Data
• PPI upside surprises: A risk that supply-side shocks re-ignite inflationary pressures.
• CPI/Core CPI stickiness: Core >3.1% YoY would challenge the market’s dovish pricing.
4. Equity Market Internals
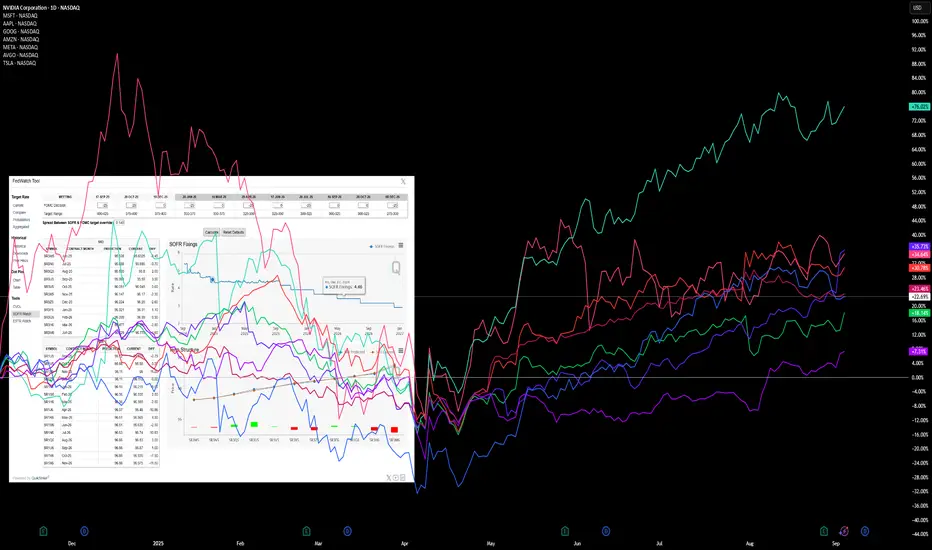
• Mag 9 leadership: Watch for relative weakness in NVDA, AAPL, MSFT, AMZN, META, TSLA, GOOG, AVGO, and BRK.A.
• Breadth indicators: Advance/decline line and % of S&P 500 above 200-day MA. Narrowing breadth = fragility.
• Volatility (VIX): A spike above 20 would indicate stress returning to equity risk sentiment.
5. Cross-Asset Indicators
• Credit spreads (IG & HY): Widening signals stress in funding markets.
• USD & Commodities: Rising USD and higher energy prices would tighten global liquidity.
Conclusion
While optimism remains strong, we caution that macro deterioration, yield curve dynamics, and concentrated equity leadership create fragility. Pullback risks rise if:
• NFP disappoints sharply,
• inflation re-accelerates, or
• outperformance in the Mag 9 begins to roll over.
Traders should monitor these risk indicators closely, as they often precede market drawdowns in September–October.
Nasdaq 100 (US100) – Short Opportunity Still AliveThe Nasdaq is still showing weakness at it's current level. There’s been more than enough time and news to push this market higher – but nothing happened. That, in itself, is a strong signal.
What we’re seeing now:
Weak jobs data: ADP and JOLTS both came in soft. Job openings hit the lowest level in nearly a year. That boosted rate-cut hopes – but the Nasdaq didn’t move.
Tech underperformance: Broader markets found some strength, but tech keeps lagging behind. Nasdaq isn’t leading like it used to – that’s bearish.
China IPO risks: New Nasdaq restrictions on Chinese listings are adding pressure to overall tech sentiment.
No follow-through: Even with dovish expectations and weak macro, bulls can’t lift the index. That says a lot.
Trade Setup (based on the chart):
Entry: between 23,480 and 23,520
Stop Loss: above 23,600 or if not high leverage even 23,720
Targets:
T1: 23,250
T2: 23,000
T3: will update depending on momentum
Why this short still makes sense:
The Nasdaq had multiple bullish triggers – weak data, Fed expectations, soft dollar – and didn’t move.
Sentiment is shaky, buyers aren’t stepping in.
Tech remains heavy while other sectors rotate.
Price is stalling right at resistance after a weak bounce.
Summary:
Plenty of chances to break out – but nothing happened. That’s a red flag.
I’m shorting between 23,480 and 23,520, with targets at 23,250 and 23,000.
Setup is invalid if we break cleanly above 23,720.
No financial advice – just how I see the chart right now.

E mini Nasdaq 100. Daily Outlook and walkthroughCME_MINI:NQU2025
Explained the reasoning and the orderflow on NQ. Clean onesided delivery during New York Open

Nasdaq - Preparing for another correction!🚔Nasdaq ( TVC:NDQ ) is starting to look weak:
🔎Analysis summary:
Over the course of the past couple of months, we witnessed an incredible rally on the Nasdaq. Following this previous price action, it is quite likely that we will soon see another correction. This could start with the current retest of the channel resistance trendline.
📝Levels to watch:
$23.000
SwingTraderPhil
SwingTrading.Simplified. | Investing.Simplified. | #LONGTERMVISION

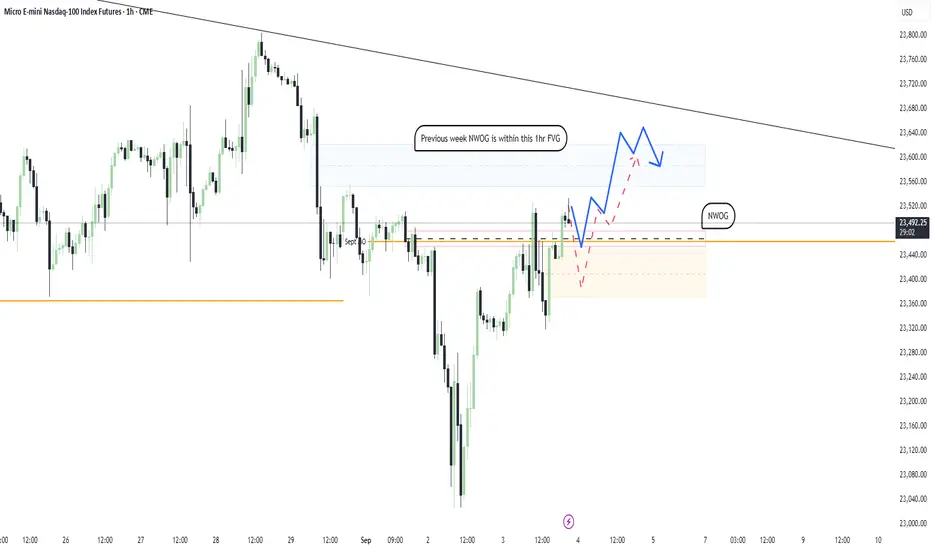
Is Nasdaq still Bullish?I’m still sensing bullish momentum on Nasdaq. My expectation is for price to retrace back into this week’s NWOG before making a push toward last week’s NWOG and the 1-hour gap at 23,583.00. There’s also a possibility we dip to fill the gap at 23,400.00 first, but if that scenario plays out, I don’t see price maintaining its bullish momentum afterward.
On the weekly chart, price continues to strongly respect the Bullish OB formed in the first week of August. As long as this level holds, I expect momentum to carry us higher in the near term.
We'll see tomorrow morning⚡
Shenandoah Telecommunications Co — September 02, 2025Sergio Richi Premium ✅
NASDAQ:SHEN — Shenandoah Telecommunications Co (NASDAQ:SHEN) Insider Activity Report | Communication Services | Telecom Services |USA | NASDAQ | September 02, 2025.
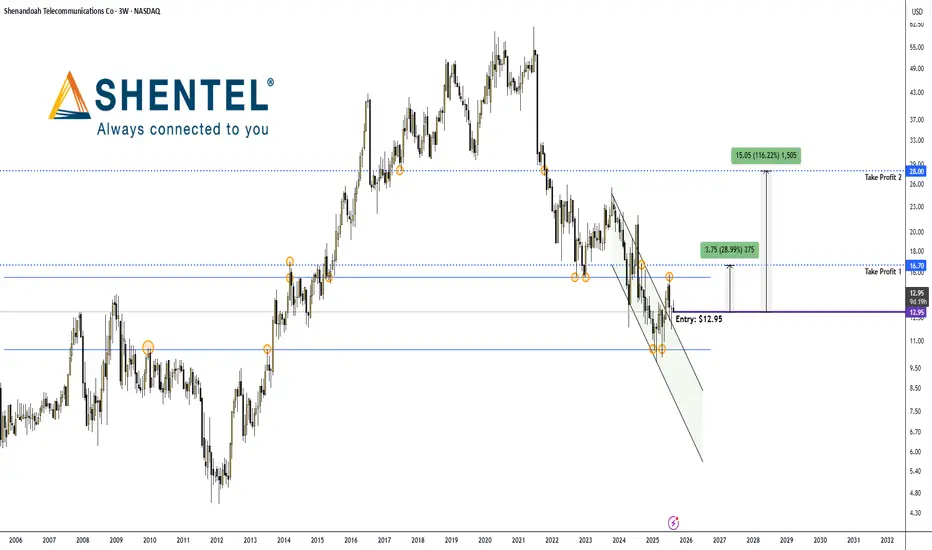
Price (Sept 2, 2025) : $12.95
Insider Activity
ECP ControlCo, a 10% owner tied to Energy Capital Partners, has been steadily loading up on SHEN since May. From late May through August 29, they picked up 864K+ shares worth over $11M, pushing their stake above 3.3M shares (~6.1% of the float). The buying wasn’t symbolic—this is real money, consistently deployed on a stock that’s been under pressure.
(SEC Form 4)
www.sec.gov
(SEC Form 4)
www.sec.gov
1. Company Overview
Shenandoah Telecommunications (Shentel) runs fiber broadband, video, and voice services across Virginia, West Virginia, Maryland, and Pennsylvania. Its flagship brand Glo Fiber is expanding fast, with 40%+ YoY revenue growth. Q2 2025 showed revenue at $88.6M (+3.2% YoY), with adjusted EBITDA up 21.9%. Despite a small net loss, the operating trend is improving.
Market cap sits just over $700M, with insiders holding ~11% and institutions ~65%.
2. Why It Matters
• Fiber-to-the-home growth is the story: Q2 Glo Fiber up 40.5%.
• Rural broadband subsidies add a tailwind.
• Institutional inflows are showing up: Southeastern Asset Mgmt (+151%), Longleaf (+151%), RBC (+184%), Two Sigma (+119%), Invesco (+104%).
• Short interest is modest (~4.4% float).
Charts:
• (3W)
Insider Trades:
SHEN seasonality:
SHEN Hedge Fund Flows:
SHEN Ownership:
3. The setup:
SHEN has been trading heavy but looks like it found a floor around $13. Insider conviction plus institutional inflows give me confidence this is a buy-the-weakness play.
Entry : $12.95–$13.35
🎯 Take Profit 1: $16.70 (+29%)
🎯 Take Profit 2: $28.00 (+116%)
My Take
Insiders are writing 8-figure checks into a depressed tape, institutions are scaling in, and fiber growth is compounding.
NASDAQ (NAS 100): Short Term Sells to the Weekly +FVG!Welcome back to the Weekly Forex Forecast for the week of Sept 1 - 5th.
In this video, we will analyze the following FX market: NASDAQ (NQ1!) NAS100
The NASDAQ failed to make a new ATH last week, indicating some weakness in the market. Frequently, Swing failures precede reversals, and this seems to be the case on the Daily TF.
Look for price to confirm bearish intent, as the sell side liquidity targets draw price down to the +FVG at 22.582.
A bullish BOS at current levels would invalidate this trade idea.
Enjoy!
May profits be upon you.
Leave any questions or comments in the comment section.
I appreciate any feedback from my viewers!
Like and/or subscribe if you want more accurate analysis.
Thank you so much!
Disclaimer:
I do not provide personal investment advice and I am not a qualified licensed investment advisor.
All information found here, including any ideas, opinions, views, predictions, forecasts, commentaries, suggestions, expressed or implied herein, are for informational, entertainment or educational purposes only and should not be construed as personal investment advice. While the information provided is believed to be accurate, it may include errors or inaccuracies.
I will not and cannot be held liable for any actions you take as a result of anything you read here.
Conduct your own due diligence, or consult a licensed financial advisor or broker before making any and all investment decisions. Any investments, trades, speculations, or decisions made on the basis of any information found on this channel, expressed or implied herein, are committed at your own risk, financial or otherwise.
