Bullish Pullback Attack – NVIDIA Heist Plan for Escape Loot!🚨💻 NVIDIA (NVDA) Stock Heist Plan 🎭 | Swing & Day Trade Robbery 💰⚡
🌟 Hey Money Makers & Market Robbers! 🌟
Welcome back to the Thief Trading Den where we don’t trade… we steal from the market vaults! 🏦💸
🔥 Asset: NVIDIA (NVDA)
🎭 Heist Type: Swing / Day Trade
🔑 Plan: Bullish Pullback Robbery
🗝️ Entry (Breaking into the Vault)
First lockpick entry above 167.00+ 🔓
Retest & pullback = perfect robbery spot
Thief layering strategy: stack multiple buy limit orders (layered entry like robbers tunneling from multiple sides 🛠️).
Any price level? Yes, thieves adapt—grab loot wherever the window cracks open! 🏃♂️💨
🛑 Stop Loss (Escape Route 🚪)
Official Thief SL: @ 161.00 ⚠️
But dear Thief OG’s, adjust based on your risk appetite, loot bag size & startergy 🎭
Remember, no thief survives without an escape route! 🚁
🎯 Target (The Electric Fence Escape ⚡)
The High Voltage Electric Shock Fence is guarding the treasure @ 196.00 ⚡⚡
Snatch your profits before the fence fries the loot 🔥
Escape fast, spend faster, rob smarter 💸🍾
⚠️ Thief Alert 🚨
The market guards (short sellers) are patrolling heavy—don’t get caught in their traps 🕵️♂️
Use layered limit orders, scale out profits, and keep your SL tight!
A true thief never overstays at the crime scene 👀
💥 Boost this Robbery Plan 💥
Every like & comment powers the Thief Trading Family 🏆
Stay sharp, stay sneaky & let’s rob NVIDIA together! 🤑🎭
Nvidia

Nvidia - This is clearly not the end!📐Nvidia ( NASDAQ:NVDA ) will simply rally more:
🔎Analysis summary:
Yes, over the past couple of months, Nvidia has been rallying another +100%. But looking at the higher timeframe, this is still not the end of the unbelievable bullrun. Following the rising channel pattern, Nvidia can rally another +20% before we might see a potential retracement.
📝Levels to watch:
$250
SwingTraderPhil
SwingTrading.Simplified. | Investing.Simplified. | #LONGTERMVISION

ALAB $304 After Consolidation Around $180 Resistance/SupportALAB had a big rise today into $180 resistance. This should be an area where a small pullback occurs or a further rise and then pullback into what will be $180 support. (Personally I'm leaning towards pullback above $180 rather than below)
Keep an eye on the major trendline as if ALAB gets too far away it will eventually want back to that trendline.
$304 is the next target. All Information Technology / Computer stocks are in the middle of the a big uptrend so this one has room to run.

Intel in Trouble or Ready for Redemption?There is growing potential for QUALCOMM Incorporated to acquire Intel.
I now believe that this development has advanced enough to warrant a fresh look at the stock
Qualcomm recently approached Intel about a takeover. According to WSJ , Qualcomm has expressed interest in acquiring Intel, which, if realized, would mark one of the most significant deals in recent history
Initially, this seemed like a long shot, with limited details emerging from the report. However, QCOM has continued to pursue the idea. Also QCOM has been in contact with Chinese antitrust regulators over the past month about this potential deal and is waiting until after the US presidential election to decide on making a formal offer. Since the election is just less than a month away, I believe this acquisition is becoming more of a possibility that investors should factor into their assessment of INTC. If a deal goes through, it’s likely that the acquisition will come at a premium to the current stock price, creating an opportunity for significant short term gains for investors
There is always a chance that no deal will occur. In that case, potential investors should evaluate whether the stock is worth holding as a long-term investment. My outlook here is not optimistic, and I’ll delve into INTC's competitive position, as indicated by its latest inventory data, in the next section
Given these two potential scenarios, I am upgrading my rating from "Sell" to "Hold." In summary, the possibility of QCOM acquiring INTC introduces a major upside catalyst that I hadn’t accounted for in my previous analysis. This potential acquisition helps offset some of the concerns about INTC as a standalone company.
Unlike many financial metrics that can be interpreted in different ways, inventory levels are more straightforward. He also explained that inventory trends can provide early indicators of business cycles. For cyclical industries, rising inventories can signal overproduction as demand wanes, while shrinking inventories can indicate strong demand
As shown in INTC’s most recent balance sheet, its inventory levels have generally been on the rise. For instance, in December 2014, inventory was valued at $ 4.273 billion, while the most recent figures show an increase to $ 11.244 billion. In some cases, rising inventory can signal business growth with increasing demand and production capacity, which was true for Intel in the early part of the last decade.
When inventory growth exceeds the pace of business growth, it becomes a red flag. In this scenario, rising inventory suggests weakened competitiveness and declining market position—an issue that Intel currently faces, in my opinion. The following chart helps illustrate this point, showing a comparison of days of inventory outstanding (DIO) for Intel and NVIDIA over the last five years, from 2020 to 2024. DIO is a measure of how many days it takes a company to sell its inventory
Given Intel's inventory buildup and declining competitive edge, I find its current valuation multiples hard to justify. Specifically, the chart highlights a comparison of price-to-earnings (P/E) ratios between Intel, NVIDIA, and AMD. Focusing on non-GAAP earnings estimates for fiscal years FY1 through FY3, Intel is currently trading with the highest P/E ratio for FY1 at 87.7 almost twice the multiple of NVIDIA and AMD, which are at 46.29 and 46.25, respectively
That said, the outlook changes somewhat when considering the years further ahead. For instance, in FY2, NVIDIA’s expected P/E ratio rises to the highest at 32.77, compared to Intel's 20.02 and AMD's 29.02. However, I want to emphasize the substantial uncertainty in Intel's earnings forecasts. As shown in the next chart, the consensus estimates for Intel's earnings per share (EPS) in FY 2024 range from a low of $0.15 to a high of $0.31 (a more than twofold variation) and from a low of $0.65 to a high of $2.1 (an almost fourfold variation). Given such uncertainty, I believe investors should be cautious about relying too heavily on forward P/E ratios too far into the future.
Both Intel and NVIDIA have experienced significant fluctuations in DIO over the years. Notably, both companies saw a spike in 2023 due to the COVID pandemic, which disrupted global supply chains. As the disruption faded, both firms saw a recovery (ie, a reduction in DIO). the difference in recovery is striking. Intel's DIO peaked at over 150 days in 2023 and has since decreased to 125 days a modest reduction but still above its historical average of 114 days. In contrast, NVIDIA's DIO surged to over 200 days but has rapidly dropped to 76 days, which is not only below its four-year average of 97.9 days but also near its lowest level in four years.
I expect Intel to face increasing competitive pressure as rivals like NVIDIA and AMD roll out their next-generation chips, particularly NVIDIA’s Blackwell chips. I recommend potential investors keep a close eye on inventory data, as it can signal changes in competitive dynamics for the reasons discussed here.
In addition to inventory issues and valuation risks, Intel faces a few other specific challenges. A significant portion of Intel’s current product lineup is concentrated in certain segments, such as PCs, which I believe are nearing market saturation plus a large share of Intel’s revenue comes from China. Given the ongoing trade tensions between the US and China, this heavy reliance on China poses a considerable geopolitical risk. These factors may limit Intel’s ability to adapt to technological advancements and shifting geopolitical conditions
The potential for a QUALCOMM acquisition has emerged as a new major upside catalyst. While my outlook on Intel’s business remains pessimistic based on the latest inventory data, the acquisition possibility partially offsets these negatives, leading me to upgrade my rating from Sell to Hold or if you are risk taker like Me, load the dip

NVIDIA BITCOIN OVERLAPAnd so it appears NVIDIA is working to develop Bitcoin mining leading to a combination of both products winning this year. Nvidia continues to astonish in value and capital.

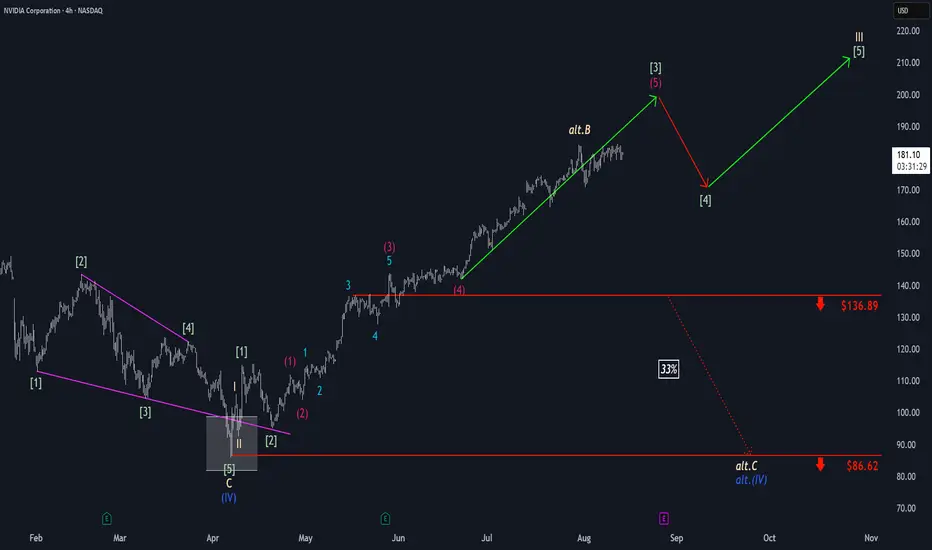
Nvidia: Extending the RallyThe bulls have maintained their momentum in Nvidia, effectively managing any interim pullbacks and allowing the stock to make further gains within the framework of green wave . We still see some additional upside potential at this stage before an interim correction of wave is likely. Well above support at $136.89, wave should then begin, pushing the stock even higher and completing the larger beige wave III. That said, we still see a 33% chance that NVDA has only recently marked the corrective top of beige wave alt.B and could soon fall below $136.89, setting a new correction low for blue wave alt.(IV) near the $86.62 level. Primarily, however, we believe wave (IV) has concluded.
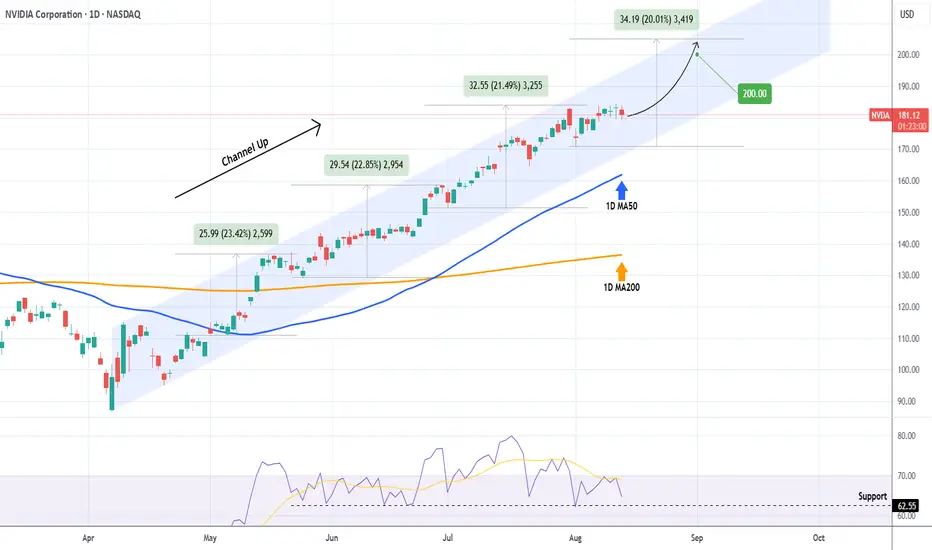
NVIDIA Is the path to $200 that easy?NVIDIA Corporation (NVDA) has been trading within a Channel Up since the April 07 market Low, being so aggressive that it has turned its 1D MA50 (blue trend-line) into Support since May 01.
The last 3 main Bullish Legs all rose by at least +20%. As long as the 1D RSI Support holds, we expect another such Leg, which would be enough for NVIDIA to reach the all important $200 psychological Target.
-------------------------------------------------------------------------------
** Please LIKE 👍, FOLLOW ✅, SHARE 🙌 and COMMENT ✍ if you enjoy this idea! Also share your ideas and charts in the comments section below! This is best way to keep it relevant, support us, keep the content here free and allow the idea to reach as many people as possible. **
-------------------------------------------------------------------------------
💸💸💸💸💸💸
👇 👇 👇 👇 👇 👇
AMD stock up over 20% off the lows- outperform NVidia?AMD is still cheap relative to its growth and still way down from all time highs.
Seeking alpha analysts expect 25-30% annual growth in earnings yearly. The stock is still in the low 20s PE. Stock can double and still be a good business worth owning for the long term and let compounding earnings work.
Low rsi and bollinger bands gave us the signal to buy, we bought with leverage, now we are in the shares unlevered.
Target would be all time highs over the next 2-3 years.

NVDA NVIDIA Price Target by Year-EndNVIDIA Corporation (NVDA) remains a dominant force in the AI and semiconductor markets, with its forward price-to-earnings (P/E) ratio currently at 19.37—a reasonable valuation considering its growth trajectory and market position.
NVIDIA’s leadership in the AI sector, particularly through its cutting-edge GPUs, has driven strong demand from data centers, cloud providers, and AI developers. The company’s recent product launches, including the Hopper and Blackwell architectures, have further solidified its competitive edge.
Despite recent market volatility, NVIDIA's consistent revenue growth and expanding profit margins support the bullish case. The current P/E of 19.37 reflects a balanced risk-reward profile, suggesting that the stock is not overvalued despite its impressive performance.
A price target of $145 by year-end reflects approximately 15% upside from current levels, driven by sustained AI demand and growing market penetration. Investors should watch for quarterly earnings reports and updates on AI chip demand, as these will likely act as key catalysts for upward momentum.

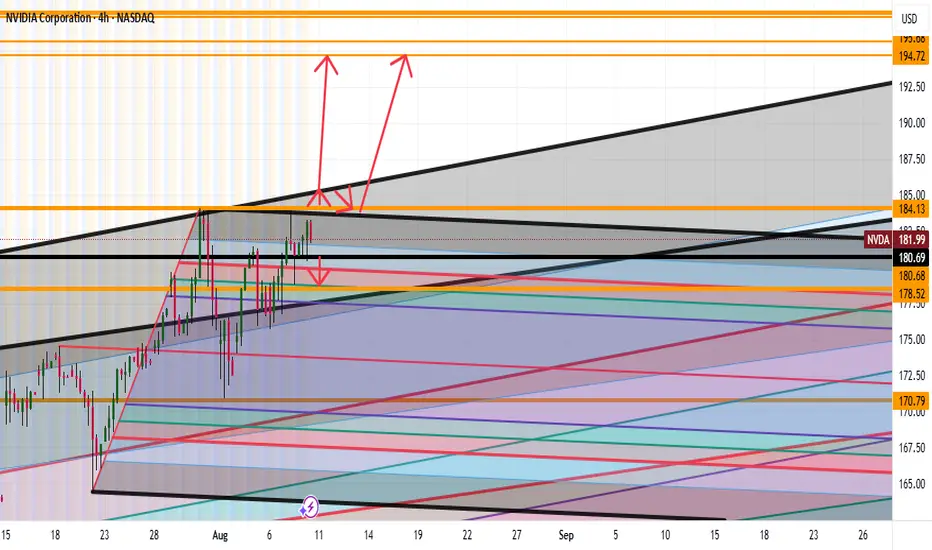
NVDA Going to 194 Full AnalysisGood afternoon Traders
So looking at NVDA we have a strong monthly bullish trend
Micro though we see the following:
Bearish: If we break the lows of 180 expect to see 178 getting hit
Bullish: Break 184 highs then expect to see a punch up to 185 then small correction then a big up to 190's or we miss the correction and blow right through to the 190's
Happy Trading Folks
Trade Smarter Live Better
Kris
Centrus Energy (LEU) - NVIDIA of Energy? Beyond ThatCentrus Energy appears to be extremely stretched but is it? What appears to be a euphoric retail frenzy may be a simple mean reversion. Incredible opportunity. Feedback appreciated

Nvidia - This is clearly not the end!📐Nvidia ( NASDAQ:NVDA ) will confirm the breakout:
🔎Analysis summary:
Over the past couple of months, Nvidia managed to rally about +100%, reaching top 1 of total market cap. Most of the time such bullish momentum just continues and new all time highs will follow. But in order for that to happen, Nvidia has to confirm the all time high breakout now.
📝Levels to watch:
$150
🙏🏻#LONGTERMVISION
SwingTraderPhil

$INTC - Best in the sector against Trump tariffsIntel is a semiconductor technology giant, renowned for its x86 processors that dominate the CPU segment, top revenue in Q2 2025 came from PC chips (Client Computing Group, ~$7.9B) and server/AI chips (Data Center & AI, ~$3.9B) . Other revenue includes foundry services ($4.4B) and legacy businesses ($1.1B).
But, for the last 4 years the company has experienced one disaster after another:
- Loss of Market Share & Intensified Competition vs AMDs Ryzen and NVIDIA AI GPUs has been major drivers for last 4 years of decline.
- Gross margin dropped to around 38–39% in 2024—a steep fall from pre‑pandemic levels above 60%, while NVIDIA maintained margins above 75%.
- Intel perpetually lagged in transitioning to advanced nodes (7 nm, 5 nm), resulting in costly delays and reduced competitiveness .
- Credit rating downgrade: In August 2025, Fitch downgraded Intel’s credit rating from BBB+ to BBB (negative outlook) due to weak demand and deteriorating profitability . S&P had already downgraded Intel to BB+, and Moody's also cut its rating in 2024 .
Recent events and price action show its time for a buy at these prices.
- Spin-off of Network & Edge (NEX) group: Intel announced the spin-off of its Network and Edge Group (NEX) into an independent entity focused on critical communications and networks, seeking external investors while retaining a major stake .
- Workforce reduction and factory cancellations: Intel confirmed layoffs of ~24,000 employees (~15% of workforce) and cancellation of chip plant projects in Germany and Poland . New CEO Lip-Bu Tan plans to cut the headcount to ~75,000 by year-end 2025 .
- Executive departures and internal reorganization: Three corporate VPs (Kaizad Mistry, Ryan Russell, Gary Patton) announced retirement from manufacturing operations amid deep restructuring . Intel also cut its manufacturing capacity planning and engineering teams as part of an efficiency-driven reorganization .
- Recent key products/services: Intel launched new Xeon 6 CPUs for AI workloads (e.g. Xeon 6776P) and is preparing Panther Lake CPUs (PCs) for 2025 . It also began 18A node production in Arizona and sold part of its Mobileye stake (~$922M) to boost liquidity .
Price/sales: Intel (0.80), AMD (10.3), NVIDIA (29.6), QCOM (3.68)
Wrap-Up
Intel's last four years have been marked by a series of structural, competitive, and strategic challenges—ranging from manufacturing delays to margin erosion and intense pressure from rivals like AMD and NVIDIA. Yet, the tide may be turning. With decisive actions like major cost-cutting initiatives, new AI-focused products, and progress in advanced node production, Intel is signaling a strategic pivot. Trading at a deep discount relative to peers based on the price-to-sales ratio, the stock reflects much of the past negativity. For investors seeking a long-term turnaround play in the semiconductor sector, now could be the moment to re-evaluate Intel’s potential.
Let’s see if this chip giant can turn the corner. Cheers!
Pablin

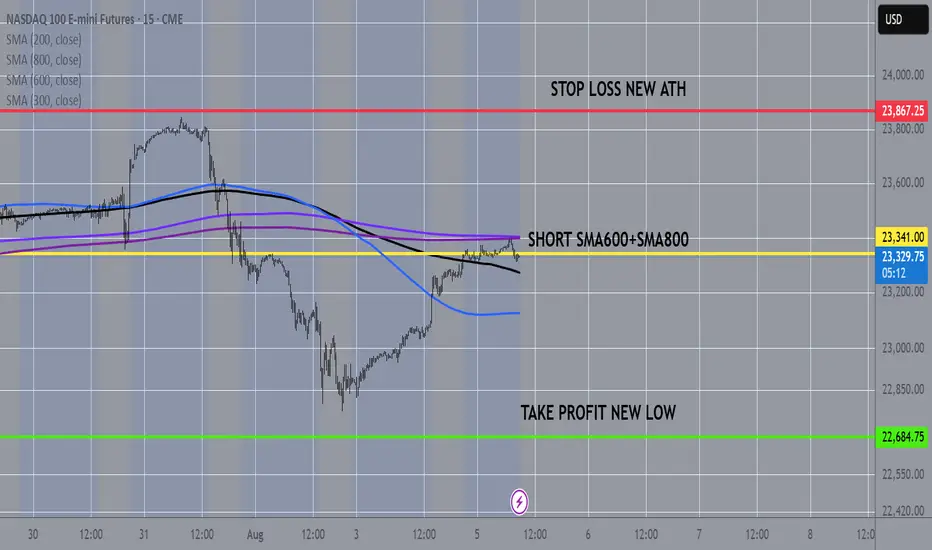
NASDAQ100 15MIN CHART FROM SMAS TO NEW LOWNasdaq100 at 10 and 15min chart touches the sma600 and the sma800 so as in many other cases before, odds are are more that it will fall from here to a new low
NVIDIA – From Thesis to Profits: How Fundamentals & Technicals 📚💡 NVIDIA – From Thesis to Profits: How Fundamentals & Technicals Aligned 🚀🧠
This isn’t just a trade —it’s a lesson in how conviction, timing, and structure come together when you truly understand what you're investing in.
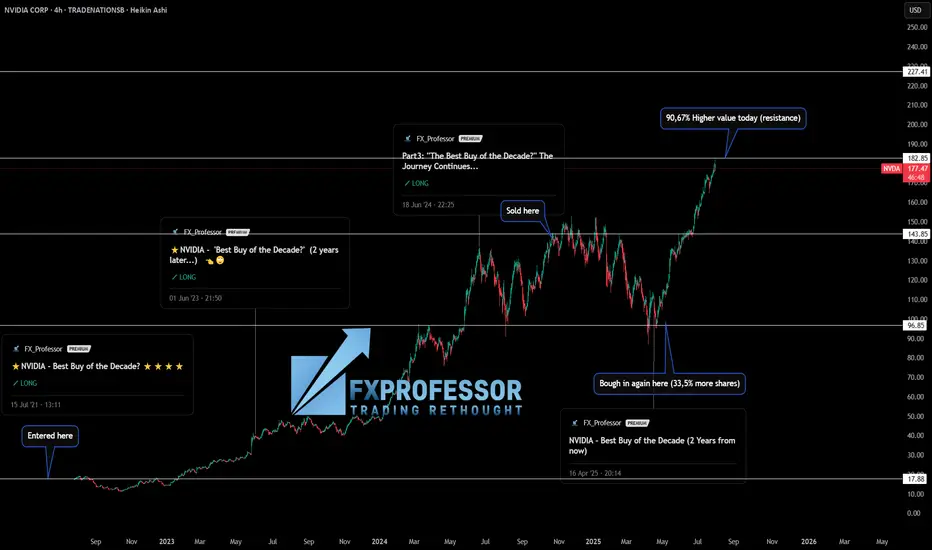
I’ve been publicly calling NASDAQ:NVDA the “Best Buy of the Decade” since July 2021 when the price was around $18. Why? Because I’m a gamer, I understand chips, and I knew exactly what NVIDIA was building long before AI became a buzzword. From graphics cards to data centers and AI compute, the fundamentals were solid.
But let me be clear: I’m not a holder forever. I use technical analysis to manage entries and exits. And that’s where the real edge comes in. 🎯
Here’s how the trade evolved:
✅ Initial entry: $17.88 (2021)
✅ First target hit: $143.85 → Took profits
✅ Re-entry: $96.85 → Got 33.5% more shares for the same money
✅ Today’s value (July 31st): Up +90.67% in just 100 days
📅 That’s from April 23rd to today.
(and it was ALL publicly posted here, for You!)
This is what happens when macro conviction meets micro execution.
🧠 The key takeaways:
Fundamentals gave me the why.
Technicals gave me the when.
And risk management gave me more shares for free.
That’s not luck —it’s structure, patience, and doing the work. If you’re just “HODLing” and hoping, consider learning how to work the chart instead of letting the chart work you.
Let me know in the comments—did you catch this move? Are you in, or waiting for the next entry?
One Love,
The FX PROFESSOR 💙
ps. in this case i did not sell many shares today i hedged with a short on SP500. Nvidia might correct a bit
Disclosure: I am happy to be part of the Trade Nation's Influencer program and receive a monthly fee for using their TradingView charts in my analysis. Awesome broker, where the trader really comes first! 🌟🤝📈
Broadcom Middle of Range RisksI like Broadcom if it gets down to $178. Right now it's still floating from the AAPL news. I wouldn't be inclined to sell here, but if looking to buy (like myself) I'd wait in hopes for $178.
Target (Potential Next Support) $302.
Good luck!

Nvidia Just Under Major SupportNvidia seems to have been pulled down by the Dow just like Apple as both are just under major support. I'm sorry for my previous Nvidia chart that drew support near 140, I recognize where I screwed up, but this chart should be good. Fortunately actual 117 support wasn't that far below and my NVDA isn't too in the red.
NVDA has the lowest revenue multiple in years right now. I know it's well off it's long term trend line, but it's growth rate is unlike anything it's ever been so expecting a steeper trend line to appear makes a lot of sense. Eventually I would imagine we'll get back to that trend line, but not anytime soon.
The Dow hitting major support should finally lift NVDA and the others that have been dragged down like AAPL and AMZN.
Good luck!

99% of people buying $NVDA don't understand this:🚨99% of people buying NASDAQ:NVDA don't understand this:
NASDAQ:GOOGL : “We’re boosting AI capex by $10B.”
Wall Street: “Cool, that’s like $1B or 0.06 per share for $NVDA.”
So from $170.50 at the time of news to $170.56 right?
No.
NASDAQ:NVDA trades at 98× earnings. So that $0.06? Turns into $6.00
Why?
Because people are expecting that to be happening every single year for 98 years and they're paying All of it Today in Full amount.
So NASDAQ:NVDA will get $1B more per year. But NASDAQ:NVDA price per share already increased by $100B in past 2 days 😂
Then it crashes 40% and everyone is wondering why.

Wall Street takes off: 5 secret growth engines for #S&P500 Record closes for the indices on July 21 came from a powerful combo: a surge in #Google , a strong start to the earnings season, gains in #Apple (+0.6%), #Amazon (+1.4%), plus #Microsoft, #Meta Platforms, and #Nvidia . This momentum, coupled with market bets on imminent Fed rate cuts and hopes for a softening US-EU tariff conflict, pushed #S&P500 and #NQ100 to new all-time highs.
5 mega drivers that could keep #S&P500 and #NQ100 on the runway through 2025:
• AI capex and monetization: Top cloud providers are ramping up spending in computing clusters and generative AI solutions. The growing lineup of paid AI products (Google Gemini, Microsoft Copilot+ Apps, Amazon Bedrock) is starting to generate significant revenue, boosting profit estimates for the “Magnificent 7.”
• Fed policy easing: If inflation keeps drifting towards 2%, we may see the first rate cut of the cycle between July and September. Historically, every 25 bps drop in 10-year UST yields adds ~2% to the #NQ100 ’s valuation multiple.
• Record buybacks and dividends: #S&P500 companies hold $3.5 trillion in cash. After tax relief on repatriated foreign earnings earlier this year, several megacap boards approved accelerated buybacks — mechanically supporting stock prices.
• Easing tariff risks: Potential trade deals between the US and EU, and the US and Mexico, would remove the threat of 20–50% tariffs priced into valuations, unlocking CAPEX in manufacturing and semiconductors — sectors with a heavy #NQ100 weight.
• Resilient consumers and services: Unemployment remains near 4%, and household spending is growing 2–3% YoY. This supports e-commerce, streaming, and platform advertising — together making up ~40% of #NQ100 and ~28% of #S&P500 .
The current highs of #S&P500 and #NQ100 aren’t a random spike — they result from strong corporate earnings, expectations of Fed cuts, and hopes of trade détente. If even some of these five drivers materialize, the indices have a strong chance to stay elevated and set new records by year-end. FreshForex analysts believe current prices could spark a new rally, with today’s market conditions offering plenty of entry points in both indices and stock CFDs.

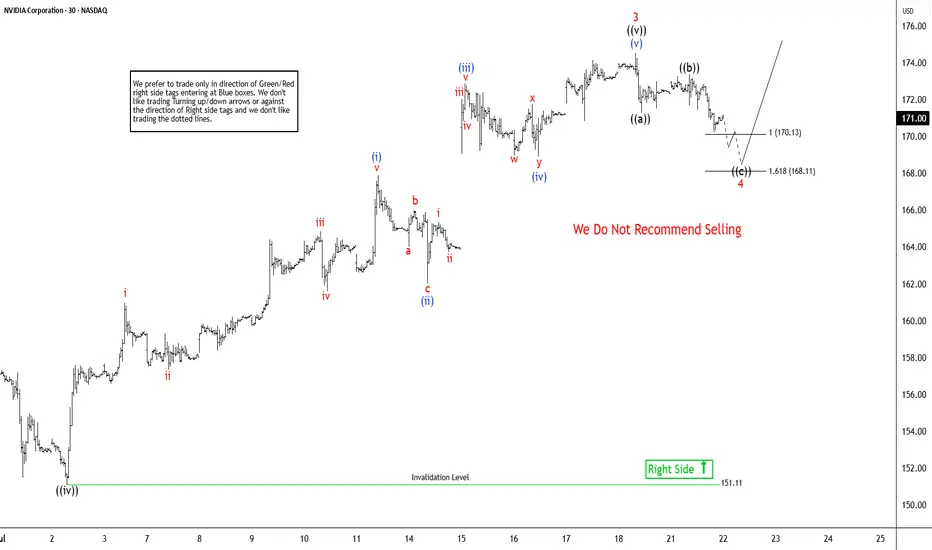
Elliott Wave Sequence In NVDA Suggests Rally From SupportNvidia (NVDA) continues rally to new all-time highs from April-2025 low and reinforcing a robust bullish outlook. In daily, it ended 7 swings pullback at 86.62 low in 4.07.2025 low started from 1.07.2025 high. Above April-2025 low, it confirmed higher high bullish sequence & pullback in 3, 7 or 11 swings should remain supported. Since April-2025 low, it favors rally in (3) of ((1)), while placed (1) at 115.44 high & (2) at 95.04 low in 4.21.2025. Above there, it placed 1 of (3) at 143.84 high, 2 as shallow connector at 132.93 low & 3 at 174.53 high. Wave (3) already extend beyond 2.0 Fibonacci extension of (1) & yet can see more upside. Within 1 of (3), it ended at ((i)) at 111.92 high, ((ii)) at 104.08 low, ((iii)) at 137.40 high, ((iv)) at 127.80 low & ((v)) at 143.84 high. Above 2 low, it placed ((i)) of 3 at 144 high, ((ii)) at 137.88 low, ((iii)) at 159.42 high, ((iv)) at 151.10 low & ((v)) at 174.53 high as 3 of (3).
It already reached the minimum area of 170.04 as inverse extension of connector. But it can see more upside as daily move showing highest momentum from April-2025 low. In 1-hour, above ((iv)) low, it placed (i) of ((v)) at 167.89 high in 5 swings, (ii) at 162.02 low, (iii) at 172.87 high, (iv) at 168.90 low & (v) of ((v)) at 174.53 high ended as 3. Currently, it favors pullback in 4 targeting into 170.13 - 168.11 area before rally in 5 or at least 3 swing bounce. Within 4, it ended ((a)) at 171.26 low, ((b)) at 173.38 high & favors lower in ((c)) of 4. It should find support in extreme area soon to turn higher for two more highs to finish ((1)). The next move in 5 of (3) can extend towards 175.9 or higher, while pullback stays above 168.11 low. The next two highs expect to come with momentum divergence to finish cycle from April-2025 low. Later it should see bigger pullback against April-2025 low in 3, 7 or 11 swings. But if it extends higher & erase momentum divergence, then it can see more upside.
NVIDIA: Stay heavy on positionsNVDA position size is adjusted in line with US market signals for underweight or overweight allocations. During panic phases, 2x leverage ETFs are on the table
Stay heavy on positions.

NVIDIA Robbery Plan: Bullish Swing Trade to Millions!🔥 NVIDIA (NVDA) Stock Heist Blueprint: Unlock Bullish Profits with Thief Trading Style! 🚀💰
🌟 Greetings, Wealth Warriors! 🌟
Hello, Ciao, Salaam, Bonjour, Hola, and Hallo to all you savvy traders and market masterminds! 🤑💸 Get ready to execute a high-octane trading plan with our Thief Trading Style—a bold fusion of technical precision and fundamental insights designed to crack the NVIDIA (NVDA) stock market vault! 💥📈
📝 The NVIDIA Heist Plan: Swing & Day Trading Mastery 🏆
Based on our proprietary Thief Trading Style, this plan targets NVIDIA (NVDA), currently riding a bullish wave fueled by strong fundamentals and technical setups. Follow the strategy outlined below to navigate the high-risk Red Zone—where overbought conditions, consolidation, and potential trend reversals create opportunities for sharp traders. 💪 Stay alert, as bearish players may set traps at key levels! 🕵️♂️
Entry Strategy: Crack the 🙂Vault! 🏦
Go long with confidence! The market is primed for a bullish breakout. Enter at current prices or set buy limit orders near recent swing lows/highs on the 15-minute or 30-minute timeframe. 📅
Pro Tip: Set price alerts on your chart to catch the optimal entry. Timing is everything in this heist! ⏰
Swing Traders: Look for pullbacks to key support levels for safer entries.
Scalpers: Focus on quick long-side trades with tight stops to maximize gains. 💨
Stop Loss: Protect Your Loot! 🔒
Place your stop loss (SL) below the recent swing low on the 30-minute timeframe (e.g., $162.00 for swing trades).
Adjust your SL based on your risk tolerance, position size, and number of orders. For larger accounts, consider tighter stops to lock in gains early. 🛡️
Scalpers: Use a trailing stop to secure profits while riding short-term momentum.
Take Profit Target: Cash Out Big! 💰
Aim for $191.00 as the primary target, or exit early if momentum slows.
Swing Traders: Hold for the full target if the trend remains strong.
Scalpers: Grab quick profits on smaller price spikes and re-enter on dips.
Pro Move: Use a trailing stop to let profits run while safeguarding gains. 🚀
📌Key Levels & Risk Management
Entry Zone: Market price or swing low – ideal for long positions. 📈
Stop Loss: $162.00 – based on 30m timeframe swing low. 🛑
Take Profit Target: $191.00 – primary target for swing/day trades. 🎯
Risky Red Zone: Overbought levels – watch for consolidation or reversal traps. ⚠️
💡 Why NVIDIA? The Bullish Case 📡
NVIDIA (NVDA) is powering through a bullish phase, driven by:
Fundamentals: Strong demand for AI, gaming, and data center chips. 📊
Macro Factors: Positive market sentiment and tech sector momentum. 🌍
COT Data (Latest Friday Update, UTC+1): Large speculators are increasing bullish positions, signaling confidence in NVDA’s upside (data sourced from reliable platforms). 📅
Geopolitical & News: Monitor upcoming earnings and industry developments for catalysts. 📰
Intermarket Analysis: Tech-heavy indices like the NASDAQ are trending higher, supporting NVDA’s rally. 📈
For a deeper dive, check fundamental reports, COT data, and sentiment analysis to align your trades with the bigger picture. 🔍
⚠️ Trading Alert: Navigate News & Volatility 🗞️
News releases can spark sharp price swings. To protect your capital:
Avoid new trades during major news events (e.g., earnings or Fed announcements). 🚫
Use trailing stops to lock in profits and limit downside risk. 🔐
Stay updated with real-time market developments to adjust your strategy dynamically. 📡
🚀 Boost the Heist! Support the Thief Trading Community 🤝
Love this plan? Hit the Boost Button to amplify our Thief Trading Style and empower our community to conquer the markets! 💥 Every like and share fuels our mission to make money with precision and style. 💪 Join us daily to unlock more high-profit heist plans! 🏴☠️
📌 Important Disclaimer
This analysis is for educational purposes only and not personalized investment advice. Always conduct your own research, assess your risk tolerance, and verify market conditions before trading. Markets move fast—stay sharp and adapt! ⚡
🌟 Stay tuned for the next heist plan, traders! Let’s keep stealing profits together! 🤑🐱👤🎉

Nvidia (NVDA) Share Price Surges Above $170Nvidia (NVDA) Share Price Surges Above $170
Yesterday, Nvidia’s (NVDA) share price rose by more than 4%, with the following developments:
→ It surpassed the psychological level of $170 per share;
→ Reached another all-time high;
→ Gained more than 9% since the beginning of the month.
The bullish sentiment is driven by Nvidia CEO Jensen Huang’s visit to China shortly after meeting with US President Trump. At the same time:
→ US Secretary of Commerce Howard Lutnick stated that the planned resumption of sales of Nvidia H20 AI chips in China is part of the US negotiations on rare earth metals.
→ The head of Nvidia stated that he was assured licences would be granted very quickly, and that a large number of orders for H20 chip deliveries had already been received from Chinese companies.
Market participants are viewing the situation with strong optimism, and analysts are raising their valuations for NVDA shares:
→ Morningstar analysts raised their fair value estimate for Nvidia shares from $140 to $170.
→ Oppenheimer analysts increased their target price from $170 to $200.
Technical Analysis of the NVDA Chart
The price trajectory of NVDA shares fully reflects the exceptionally strong demand:
→ The price is moving within an ascending channel with a steep growth angle;
→ Since early May, the RSI indicator on the 4-hour chart has not fallen below the 50 level;
→ Yesterday’s trading session opened with a large bullish gap.
The chart also shows the formation of a stable bullish market structure (shown with a purple broken line), expressed through a sequence of higher highs and higher lows.
Given the above, it is difficult to imagine what might cause a sharp shift from positive to negative sentiment. If a correction begins (for example, with a test of the $160 level), traders should watch for signs of its completion — this could present an opportunity to join the emerging rally.
This article represents the opinion of the Companies operating under the FXOpen brand only. It is not to be construed as an offer, solicitation, or recommendation with respect to products and services provided by the Companies operating under the FXOpen brand, nor is it to be considered financial advice.