HBARUSD has 3 bullish patterns stacked on top of eachotherThe inverse head and shoulders in the light blue, the light tan is the bull flag, and the pink is the double bottom. Currently price is above the Bullflag and the Inverse head and shoulders pattern. The bullflag also counts as a descending channel pattern as well. We just recently retested the neckline of the inverse head and shoulders as exact wick support which is a good sign. All 3 should provide eachother with the bullish confluence needed for them to be validated, but in addition to this technical bullishness we have some fundamental bullishness occurring just recently too as NVIDIA just announced their new Blackwell chips — claiming them to be the future backbone of AI infrastructure — which are integrating verifiable compute which has its fundamental trust layer built on Hedera. This also provides great bullish confluence and heightens the probability these 3 chart patterns will all be validated and reach their full targets. I will keep updating this post as they do so. *not financial advice*
Nvidia

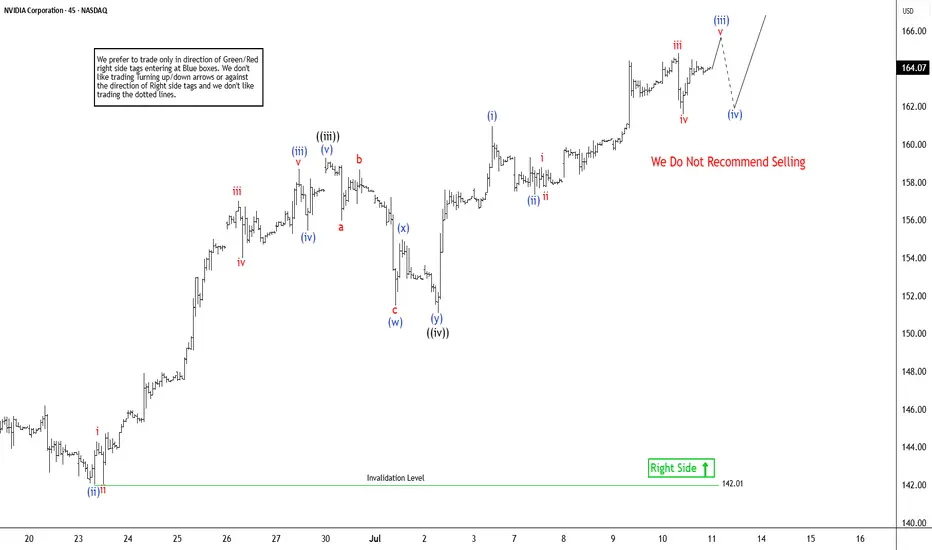
NVIDIA ($NVDA) Elliott Wave Outlook: Larger Pullback on the HoriNvidia (NVDA) continues its remarkable ascent, consistently reaching new all-time highs and reinforcing a robust bullish outlook. The ongoing rally, which began from a significant low on April 7, 2025, remains structured as an impulsive wave pattern, indicative of strong upward momentum. However, despite the potential for further short-term gains, the cycle appears mature. This suggests a larger-degree pullback could be imminent. Investors should exercise caution when considering chasing this rally in shorter time frames, as the risk of a corrective move grows.
In the short term, the cycle initiated from the June 2 low is progressing as a lower-degree impulse. From this low, wave ((i)) peaked at $144, followed by a corrective pullback in wave ((ii)) that concluded at $137.88. The stock then surged in wave ((iii)) to $159.42. The subsequent wave ((iv)) correction unfolded as a double-three structure, with wave (w) ending at $151.49, wave (x) at $154.98, and wave (y) completing at $151.10, finalizing wave ((iv)). Currently, Nvidia is advancing in wave ((v)), exhibiting a five-wave subdivision. Within this, wave (i) of ((v)) reached $160.98, with a minor pullback in wave (ii) concluding at $157.34. As long as the pivotal low at $142.01 holds, any near-term pullbacks are likely to attract buyers in a 3, 7, or 11-swing pattern, supporting further upside potential. This technical setup underscores Nvidia’s strength but highlights the need for prudent risk management.
A bit of profit taking on NVDA and then up again?NASDAQ:NVDA is the most talked about and everyone is capitalizing on that. Let's take a look.
NASDAQ:NVDA
Let us know what you think in the comments below.
Thank you.
75.2% of retail investor accounts lose money when trading CFDs with this provider. You should consider whether you understand how CFDs work and whether you can afford to take the high risk of losing your money. Past performance is not necessarily indicative of future results. The value of investments may fall as well as rise and the investor may not get back the amount initially invested. This content is not intended for nor applicable to residents of the UK. Cryptocurrency CFDs and spread bets are restricted in the UK for all retail clients.

USNAS100 Bullish Ahead of NVIDIA Milestone – 23010 in SightUSNAS100 – Outlook
The index continues its bullish momentum, supported by strong tech performance — notably NVIDIA surpassing a $4 trillion market cap.
As long as the price holds above 22880, the trend remains bullish toward:
23010 Then extended targets near 23170
However, a 1H close below 22815 would signal weakness, potentially opening the way for a retracement toward: 22705 And 22615, especially if tariff tensions escalate.
Resistance: 23010, 23170
Support: 22815, 22705, 22615

Nvidia Market Capitalisation Reaches $4 TrillionNvidia Market Capitalisation Reaches $4 Trillion
Yesterday, Nvidia’s (NVDA) share price surpassed $162 for the first time in history. As a result, the company’s market capitalisation briefly exceeded $4 trillion during intraday trading (according to CNBC), making Nvidia the first publicly listed company to reach this milestone.
The rise in NVDA’s share price is being driven by both bullish sentiment across the broader equity market—which appears optimistic ahead of the upcoming Q2 earnings season—and evidence of sustained demand for Nvidia’s products, as artificial intelligence technologies continue to gain widespread adoption.
Noteworthy developments include:
→ Nvidia may begin producing a specialised AI chip for the Chinese market this autumn, potentially circumventing current export restrictions;
→ Perplexity, a company backed by Nvidia, is launching an AI-powered browser aimed at competing with Google Chrome.
Technical Analysis of NVDA Chart
In our previous analysis of NVDA’s price action, we:
→ Drew an ascending channel;
→ Highlighted bullish conviction in overcoming the $145–150 resistance zone.
The channel remains valid, with the current price trading near its upper boundary. However, the RSI indicator is showing signs of bearish divergence, suggesting that the stock may be vulnerable to a near-term correction—potentially towards the median line of the existing upward channel.
At the same time, a major shift in the prevailing bullish trend appears unlikely. The $145–150 range may serve as a key support zone for NVDA in the foreseeable future.
This article represents the opinion of the Companies operating under the FXOpen brand only. It is not to be construed as an offer, solicitation, or recommendation with respect to products and services provided by the Companies operating under the FXOpen brand, nor is it to be considered financial advice.

DAX (Ger40): Defying Global TensionsDespite all this tariff drama, the DAX hit another record high. What gives? Markets seem to be betting that Trump enjoys the threat of tariffs more than the implementation. Some traders are pricing in yet another extension beyond the August 1 deadline.
The DAX is riding momentum from both global AI enthusiasm, thanks to Nvidia’s $4 trillion market cap milestone, and the assumption that European exporters might dodge the worst of Trump’s trade penalties, at least for now. However, this rally is precarious. If a tariff letter hits Brussels, or copper tariffs ripple into industrial demand expectations, we could see a swift correction.
Technically, near term resistance is sitting around. 24,700. However as stated, should sentiment change. A correction back down, to the support level at 24,200, which also aligns with the 50 Fibonacci retracement level, could be on the cards. Or even all the way down to 23,800, aligning with the 88% Fibonacci level.

NVIDIA – Best Buy of the Decade (4T Record but now resistance)🚀🔥 NVIDIA – Best Buy of the Decade Post #6
💡📉 Great but why am I taking half profits Today?
Back in July 2021, I named NVIDIA "The Best Buy of the Decade. " Today, it just hit a mind-blowing milestone — becoming the first company to reach a $4 trillion market cap. But here's the thing... that happened right at major resistance.
From our initial call in 2021 , to the target at $143.85 drawn via parabola in 2023, to the April 2025 re-entry at $95, it’s all on the chart — and it's been a textbook ride so far.
At the current level of $163.89, we’re pressing into serious overhead resistance. This doesn’t mean the story is over — not even close. But it could mean we take a breather before the next leg higher.
🧭 Targets ahead remain unchanged:
🔹 First stop: $182.85
🔹 Long-term vision: $227.41
What started as a bold macro call in 2021 has now become a multi-year thesis with precision updates along the way. This is post #6 in the NVIDIA journey — and if you scroll back through the chart, each piece has built on the last with clarity and conviction.
🎯 NVIDIA is not just a tech stock — it’s the AI backbone. But every cycle has pauses, and this one looks ready for a short rest before we see the next breakout.
Stay sharp, follow the structure, and honor the parabola.
One Love,
The FX PROFESSOR 💙
Additional info, for those who like to dive deeper into NVDA:
🔍 Technical Breakdown Version
For the chartists and structure followers, here’s the breakdown:
📌 2021: Original call — "Best Buy of the Decade"
📌 2023: First parabola plotted, projecting toward $143.85 — target hit precisely
📌 April 2025: Market offered $95 re-entry — second parabola begins
📌 Now: Price sits at $163.89, testing resistance from both structure and Fibonacci
📌 Next levels:
- $182.85 → Key extension level
- $227.41 → Long-term target based on full parabolic arc
Current structure suggests a possible pause before continuation. No need for panic — parabola remains valid unless structure is broken. Volume still supportive, and price action is following projection beautifully.
🧠 AI Macro Narrative Version
The big picture? NVIDIA isn't just another semi stock — it’s the nervous system of the AI revolution.
From gaming → crypto → AI, NVIDIA has consistently been first to adapt, and now it’s the leader in AI hardware infrastructure. The $4 trillion milestone is more than symbolic — it represents capital reallocation toward AI as the next dominant sector.
🧠 Key macro takeaways:
AI demand is insatiable
Data centers need NVIDIA
Generative AI isn't slowing down
Institutions are still buying — not selling
The resistance we see now isn’t weakness — it’s the market pausing to digest before another acceleration. Just like every past cycle... we ride, retrace, reload, and resume.
Disclosure: I am happy to be part of the Trade Nation's Influencer program and receive a monthly fee for using their TradingView charts in my analysis. Awesome broker, where the trader really comes first! 🌟🤝📈

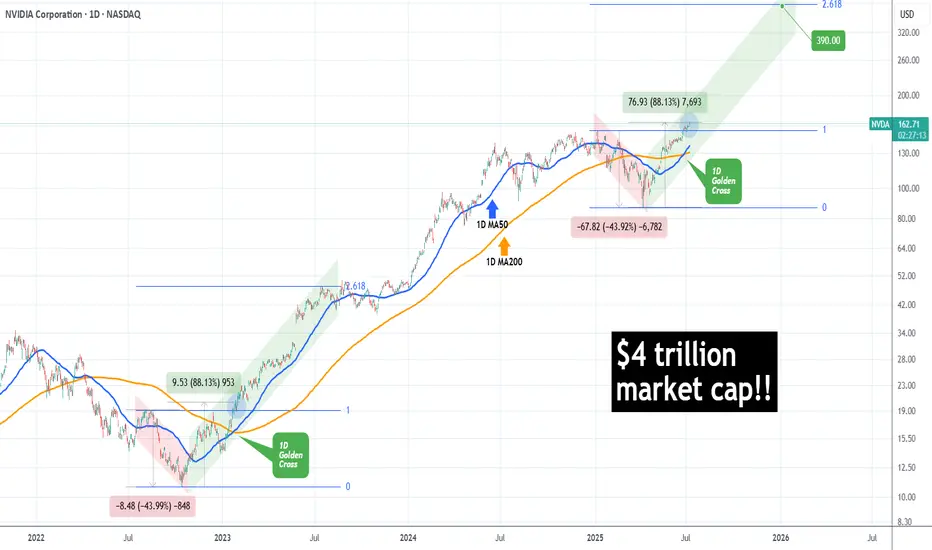
NVIDIA made history! First company with $4 trillion market cap!NVIDIA Corporation (NVDA) became today the first company in history to surpass a $4 trillion market value, as A.I. bulls extended the recent rally and pushed the price past the approximate $163.93 level needed to reach this market capitalization threshold.
The long-term trend on the 1D time-frame couldn't look more bullish. Coming off a 1D Golden Cross less than 2 weeks ago, the price has turned the 1D MA50 (blue trend-line) into Support and sits at +88.13% from the April 07 2025 Low.
This is the exact set-up that the market had when it was coming off the 2022 Inflation Crisis bottom (October 13 2022). As you can see, both fractals started with a -44% decline, bottomed and when they recovered by +88.13%, there were just past a 1D Golden Cross. In fact that Golden Cross (January 24 2023) was the last one before the current.
NVIDIA entered a Channel Up (green) on its recovery and for as long as the 1D MA50 was supporting, it peaked on the 2.618 Fibonacci extension before it pulled back below it.
If history repeats this pattern, we are looking at a potential peak around $390, which may indeed seem incredibly high at the moment, but as we pointed out on previous analyses, the market is in the early stages of the A.I. Bubble, similar to the Internet Bubble of the 1990s.
-------------------------------------------------------------------------------
** Please LIKE 👍, FOLLOW ✅, SHARE 🙌 and COMMENT ✍ if you enjoy this idea! Also share your ideas and charts in the comments section below! This is best way to keep it relevant, support us, keep the content here free and allow the idea to reach as many people as possible. **
-------------------------------------------------------------------------------
💸💸💸💸💸💸
👇 👇 👇 👇 👇 👇
Nvidia - New all time highs!Nvidia - NASDAQ:NVDA - breaks out now:
(click chart above to see the in depth analysis👆🏻)
Within two and a half months, Nvidia rallied more than +70%. Following this recent bullish strength, a retest of the previous highs was totally expected. But this does not seem to be the end at all. There is a much higher chance that we will see new all time highs soon.
Levels to watch: $150
Keep your long term vision🙏🙏
Philip (BasicTrading)

Semis ready to rip to price discoveryAMEX:SOXL NASDAQ:SMH
Semiconductors just waiting for the tarrif announcements to pass to blast off to all time highs

NVDA Analysis To 164?Quick breakdown of NVDA
Appears we hit our corrected level, we could go deeper possibly or hold at this level and drive up to 164
This is looking like a nice little setup long indeed
Trade Smarter Live Better
Kris/Mindbloome Exchange

NVIDIANVIDIA is due for correction, anytime it can start. This week probably would be a good week to start the correction.
Disclosure: We are part of Trade Nation's Influencer program and receive a monthly fee for using their TradingView charts in our analysis.

NVIDIA: More Room in Wave BNvidia’s strong rally over recent weeks lifted the stock above resistance at $153.13. Despite a brief pullback on Tuesday, we still expect beige wave B to extend toward $178.39. Afterward, beige wave C should initiate a substantial correction, likely finding its low above $81.98 to complete blue wave (IV). If Nvidia rallies directly through $178.39, that would support our alternative view that blue wave alt.(IV) has already bottomed (37% probability).
📈 Over 190 precise analyses, clear entry points, and defined Target Zones - that's what we do.

Nvidia - More Upside After Correction NVIDIA completed an irregular flat correction back in April. Since then, the price action has been strong and steady, forming higher highs and higher swing lows —a clear sign of bullish con-
continuation.
From an Elliott Wave perspective, the current move appears incomplete, as we cannot yet identify a full five five-wave advance from the April lows. This suggests that more upside may still be ahead.
However, we could see a wave four pullback develop sometime during the summer. If that occurs, the key support zone to watch would be around $140 down to $130, which could provide
an opportunity within the ongoing uptrend.
- Resistance: 170
- Support: 143 / 132
- Invalidation: 115
GH

SMCI Long Swing Setup – Positioned for AI-Driven Infrastructure Super Micro Computer, Inc. NASDAQ:SMCI is a critical player in the AI infrastructure boom, supplying high-performance servers to NVIDIA, AMD, and major data centers. With accelerating demand for compute power, SMCI is well-positioned for continued upside.
📌 Trade Setup:
• Entry Zone: Current market price or $40 – $43 support zone
• Take Profit Targets:
o 🥇 $70
o 🥈 $100
o 🥉 $120
• Stop Loss: Weekly close below $30

NVIDIA(NVDA) Jackpot – Thief Trading Blueprint for Fast Profits!🚀 NVDA Stock Heist: The Ultimate AI Gold Rush (Scalping/Day Trade Plan)
🌟 Hey there, Market Pirates! 🏴☠️💰
Thieves, Traders, and Money Makers—gather around! Based on the 🔥Thief Trading Style🔥, here’s our master blueprint to loot NVIDIA’s AI-fueled rally. Follow the strategy on the chart—long entry is LIVE! Our escape? Near the high-risk Resistance Zone. Overbought? Consolidation? Reversal trap? Bears are lurking, but we’re stealing profits first! 🎯💸
🎯 Entry (The Vault is Open!)
"Swipe the AI gold at any price—the heist is ON!"
Pro Tip: Use buy limits within 15-30min near swing lows/highs for pullback entries.
🛑 Stop Loss (Thief’s Escape Route)
SL at recent swing low (4H timeframe)—adjust based on your risk & lot size.
Scalpers/Day Traders: Tighten SL if stacking multiple orders.
🏆 Target 🎯: 165.00 (The AI Jackpot!)
📈 Why NVDA?
Bullish momentum from AI dominance, earnings hype, and institutional FOMO.
Tech sector strength + chip demand = THIEF’S PARADISE.
📰 Fundamental Heist Intel
Need macro trends, sentiment, and intermarket analysis? 🔗 Check our bioo for the full robbery toolkit.
⚠️ Trading Alert: News & Position Control
Avoid new trades during earnings/news—volatility kills heists!
Trailing SLs = Locked profits. Don’t get greedy!
💥 Boost This Heist!
👊 Hit "Like" & "Boost" to fuel our next raid. Every click = More stolen profits! 🚀💰
🤑 Stay tuned—more heists coming! NVIDIA today… what’s next? 🤫🐱👤

$5 to $32 vertical over 500% $CYN🔥 $5 to $32 vertical over 500% since market open NASDAQ:CYN on news mentioning NASDAQ:NVDA

My buy view for NVDAMy buy view for NVDA.
Nvidia has made a significant push up after the meltdown following the new US tariff news.
The push-up is likely cooling off for this baby.
If the current consolidation continues to be sustained by the support zone (TL) in this zone, we are likely to see NVDA rally to $149 and $152 as TP1 and TP2, respectively.
My SL will be around $128.9 zone for both.
RR of 1:4 and 1:4.8
Trade with care

Nvidia - 100% new all time highs!Nvidia - NASDAQ:NVDA - is just too bullish now:
(click chart above to see the in depth analysis👆🏻)
Honestly it was not unexpected that Nvidia is now the most valuable company in the world. The chart is just so strong and perfectly following structure; it seems to be just a matter of days until Nvidia will create a new all time high. If this happens, a breakout rally will follow.
Levels to watch: $150
Keep your long term vision!
Philip (BasicTrading)

NVIDIA Corporation More Bullish Than BearishIt has been a while since we looked at Nvidia and here we have a mixed and tricky chart. I will try to make an accurate prediction nonetheless, watch!
It is tricky because the bullish move stalled and found resistance. The candles started to curve and there is little growth. Nothing to worry though. There is no retrace and the action is happening above 0.786 Fib. extension. This means that the action around resistance is likely to result in additional growth. Resistance is being weakened the more it is challenged.
If the bears were going to push prices lower they had their chance but nothing. If they tried, they failed and this is all bullish.
I predict NVDA will continue growing long-term. This goes in accordance with the analyzes I made back in early April of this year. We can expect a new all-time high in the latter part of 2025.
Summary
To me, the bullish bias is now confirmed. A continuation should happen in the coming days or weeks. Growth is expected long long-term.
Namaste.

Nasdaq: Bull flag breakout on daily chart, testing ATHsBeen a while since I last posted. So figured I'd share this quick chart. Market undoubtedly have been incredibly volatile this month. However luckily, the Nasdaq has been forming bull flag on the daily chart. This follows a strong prior uptrend. The breakout took place today, sending the index to test ATHs.
Notable stocks making a move are names like NASDAQ:AMZN and NASDAQ:NVDA , mainly due to the broader market strength. Other indices, such as the S&P 500 ( SP:SPX ) also are breaking out as they form a similar bull flag pattern.
At ATHs, this is a deciding factor of where the market goes next. Either it bounces off to near-term support, or the market rallies to a new all-time high until next cooldown.
Note: not financial advice

$NVDA has topped, new lows incomingNVDA has now topped, you can see that we've just formed another high time frame lower high and the rejection up here has the potential to create a strong bearish move.
I think it's very likely that the bearish move will take us all the way down to the bottom support before it's completed.
The bounce from the bottom went higher than I initially thought it would (which is why I'm creating a new chart), but price can't escape gravity and the same outcome is inevitable.
Let's see how it plays out over the coming weeks.
NVIDIA – Best Buy of the Decade (2 Years from now) 🚀💻 NVIDIA – Best Buy of the Decade (2 Years from now) 🔥🧠
Hey everyone! Back in 2021, I called NVIDIA the best buy of the decade, and in 2023, we followed up as NVDA rocketed to my target of $143. Now in 2025, it’s time for Part 3 — and the case for NVDA being a generational play just got even stronger. 💪
✅ On April 4th, I re-entered around $96.85, right at my alert level. The setup? A rounded bottom reversal pattern forming with 4 strong bullish divergences on key indicators (Stoch, CCI, MOM, MFI). Target levels ahead:
📍 $143
📍 $182
📍 $227
📉 Yes, Nvidia took a 6% hit after announcing a $5.5B impact from U.S. export restrictions on its H20 chip to China — a reminder that macro & geopolitical factors still matter. But…
💡 The company just launched DGX Spark and DGX Station, bringing AI supercomputing to the desktop — powered by Grace Blackwell architecture. That’s next-level innovation, not just for enterprises, but for developers, students, and researchers alike. A true desktop AI revolution.
🇺🇸 And most importantly: NVIDIA will now manufacture AI supercomputers on U.S. soil — in Arizona and Texas — aiming to produce $500 billion worth over the next four years. This initiative is a bold move toward supply chain resilience, economic growth, and cementing NVIDIA’s leadership in the AI arms race.
⚠️ If we lose the $96 level, I’ll re-evaluate. But for now? The technical and fundamentals still say: Best Buy of the Decade (2 Years from now we will revisit this chart).
💬 What’s your outlook? Are you buying the dip or waiting on clarity?
One Love,
The FXPROFESSOR 💙
