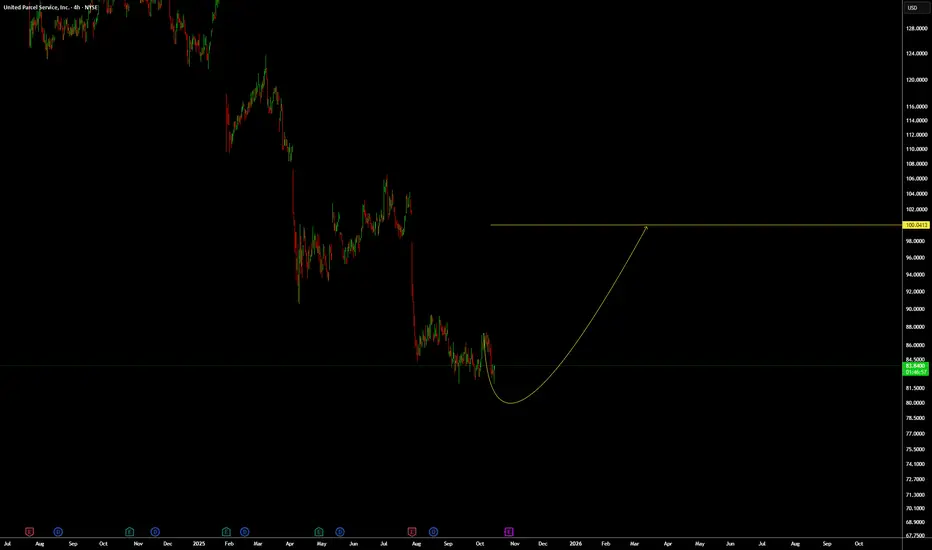
UPS: Should go up to 100 level.Based on WTW Concept and from a technical point of view, we will look for buy setups on NYSE:UPS it is ready to go up even if it will go a bit more lower.
We Trade Waves
WTW Team
Disclosure: We are part of Trade Nation's Influencer program and receive a monthly fee for using their TradingView charts in our analysis.
Nyse
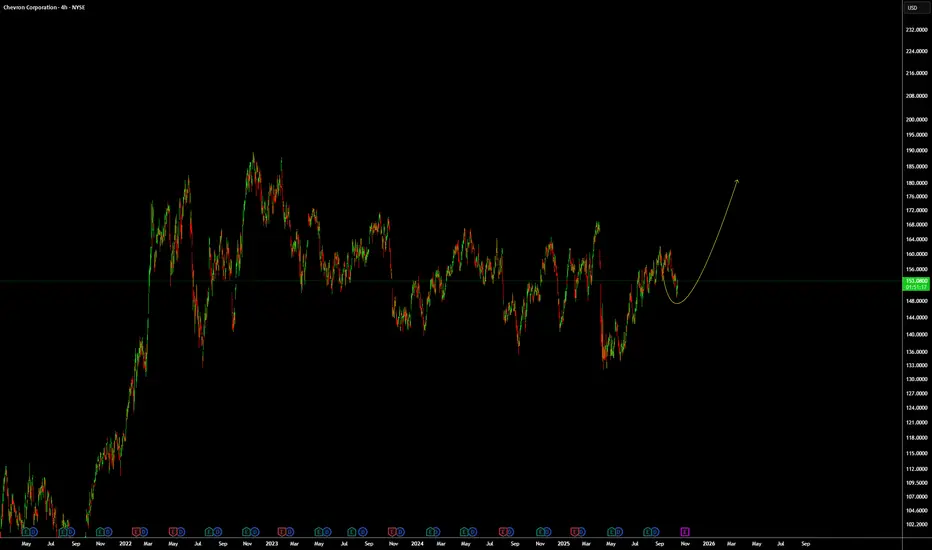
CVX: Looking for an up move/wave.From a technical point of view and based on WTW Concept, NYSE:CVX looks like it will go up.
We Trade Waves
WTW Team
Disclosure: We are part of Trade Nation's Influencer program and receive a monthly fee for using their TradingView charts in our analysis.
GME Market Strategy: Risk-Managed Swing to Resistance🚨 GME: GameStop's Great Heist! 🎮💰 Bullish Swing/Day Trade Plan
Asset: GameStop Corporation (GME)Market: NYSE (Stock)Strategy: Swing/Day Trade with a "Thief's Layered Limit Order" Approach 😎
Get ready, traders! We're about to pull off a bullish heist on GameStop (GME) with a slick, calculated plan to outsmart the market! 📈 This setup is packed with technical firepower and a cheeky vibe to keep it fun yet professional. Let’s dive into the Thief’s Wealth Strategy Map and steal some profits! 🕵️♂️
📊 Technical Breakdown: Why GME is Ripe for the Taking
Our bullish setup is backed by a rock-solid technical foundation. Here’s the intel:
🔥 382 EMA Breakout: GME has smashed through the 382-period Exponential Moving Average, signaling strong bullish momentum. This breakout is our green light for action! 🚦
💥 Accumulation Zone Pressure: Buyers are stacking up in the accumulation zone, pushing prices upward like a crew of bullish bandits ready to raid the market.
🕯️ Heikin Ashi Reversal Candle: A gorgeous bullish Heikin Ashi candle has emerged, screaming BUYING POWER and confirming the trend reversal. The bulls are in control! 🐂
🗝️ Thief’s Edge: We’re using a layered limit order strategy to sneak into the market at multiple price points, maximizing our entry precision.
🕵️♂️ The Thief’s Entry Plan: Layered Limit Orders
This isn’t your average “buy and pray” strategy. We’re using a layered limit order approach to enter like sneaky market thieves. Set your buy orders at these levels:
🪙 $24.00
🪙 $24.50
🪙 $25.00
🪙 $25.50
🪙 $26.00
Pro Tip: Feel free to add more layers based on your risk appetite and account size. The more layers, the merrier the heist! 😜 You can also enter at any price level within this range if you prefer a single strike. Just keep it sharp and calculated!
🛑 Stop Loss: Protect Your Loot
🛡️ Set your stop loss at $23.00 to guard against unexpected market traps. ⚠️
Note: Dear Ladies & Gentlemen (Thief OGs), this is my suggested stop loss, but it’s your heist! Adjust it to suit your risk tolerance. Trade smart, and don’t get caught by the market cops! 👮♂️
🎯 Target: Cash Out Before the Barricade!
🎰 Our profit target is $31.00, where a police barricade zone (aka strong resistance) awaits. This level is flagged as overbought with a potential trap for greedy thieves. 🪤 Escape with your profits before the market clamps down!
Note: Thief OGs, this is my target, but you’re the boss of your trades. Take profits at your own discretion and secure the bag! 💸
🔗 Related Pairs to Watch (Correlated Assets)
To maximize your market intel, keep an eye on these correlated assets (all in USD):
🎥 NYSE:AMC Entertainment (AMC): Another meme stock darling, often moving in tandem with GME. Watch for similar bullish setups or divergences.
📊 AMEX:SPY (S&P 500 ETF): GME’s wild swings can be influenced by broader market sentiment. If SPY is bullish, GME’s momentum could get an extra boost!
📱 NYSE:BB (BlackBerry): Another retail-favorite stock with potential for correlated volatility. Check for breakout patterns here too.
Key Correlation Points:
🚀 NYSE:GME and NYSE:AMC : Often ride the same retail-driven waves, especially during short squeezes or social media hype.
⚖️ AMEX:SPY Influence: If SPY shows weakness, GME’s bullish momentum might face resistance. Stay alert!
🔍 NYSE:BB as a Signal: If BlackBerry is pumping, GME might follow suit.
📝 Final Notes for the Heist
This is a high-octane, bullish setup designed for swing or day traders with a taste for calculated risk. The Thief’s Layered Limit Order Strategy gives you flexibility to enter the market like a pro, while the technicals (382 EMA breakout, Heikin Ashi, and accumulation pressure) provide a solid foundation. 🏦
Stay sharp, manage your risk, and don’t get greedy—escape with your profits before the market throws up a barricade! 🚓
✨ “If you find value in my analysis, a 👍 and 🚀 boost is much appreciated — it helps me share more setups with the community!”
#Hashtags: #GME #StockMarket #SwingTrading #DayTrading #Bullish #TechnicalAnalysis #TradingStrategy #MemeStocks

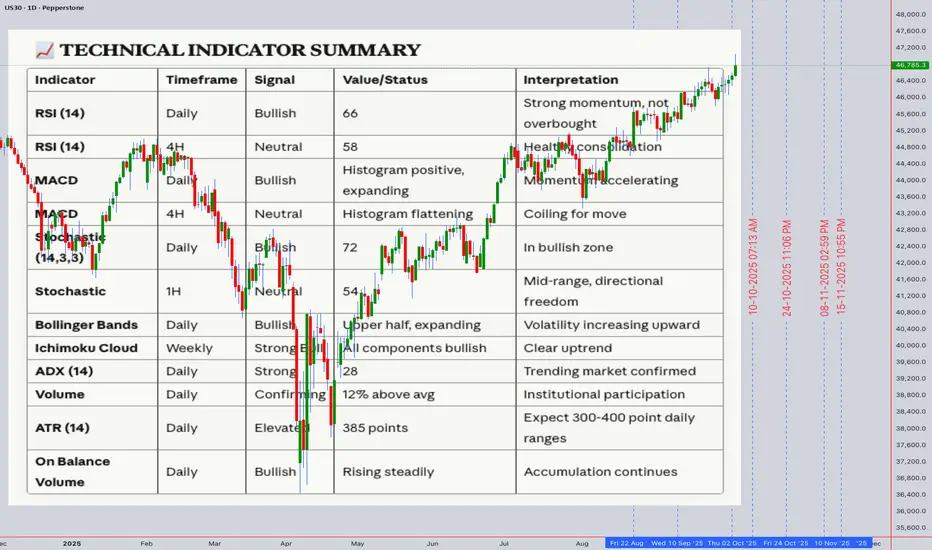
US30 -Dow Jones Industrial Average Technical Analysis & ForecastCurrent Price: 46,785.30 | 4th October 2025, 12:54 AM UTC+4
EXECUTIVE SUMMARY
The Dow Jones Industrial Average is trading at 46,785.30, showing consolidation near all-time highs. Multi-timeframe analysis reveals a bullish trend with caution signals emerging on shorter timeframes. Key resistance at 47,000-47,200 zone presents a critical decision point for continuation versus correction.
Bottom Line: Bullish bias remains intact on daily/weekly charts, but intraday traders should watch for potential pullback to 46,500-46,300 support zone before next leg higher.
MULTI-TIMEFRAME MARKET STRUCTURE
Monthly/Weekly Context (Swing Trading)
Trend: Strong bullish momentum maintained since October 2023 lows
Elliott Wave Count: Potential Wave 5 of larger degree impulse, suggesting final push before correction
Key Levels: Major support at 45,800-46,000 (previous breakout zone); resistance at 47,200-47,500
Daily Chart Analysis
Structure: Higher highs and higher lows pattern intact
Ichimoku Cloud: Price trading above bullish cloud; Tenkan-sen/Kijun-sen bullish cross active
Pattern Recognition: Ascending channel formation with upper boundary at 47,150
4-Hour Chart (Critical Timeframe)
Candlestick Patterns: Recent doji and spinning tops indicating indecision
RSI: Divergence warning - price making higher highs while RSI shows lower highs (bearish divergence)
Volume Profile: Declining volume on recent push higher suggests weakening momentum
1-Hour/30-Minute (Intraday Focus)
Microstructure: Double top formation developing at 46,850-46,900 zone
Bollinger Bands: Price touching upper band with band width expanding
VWAP: Trading 0.2% above daily VWAP (46,692) - moderately extended
TECHNICAL INDICATOR DEEP DIVE
Momentum Indicators
RSI (14):
Daily: 62 (neutral-bullish)
4H: 58 (declining from 72 two days ago)
1H: 54 (bearish divergence present)
Interpretation: Momentum cooling after recent rally; not yet oversold
Trend Indicators
Moving Averages:
20 EMA: 46,580 (immediate support)
50 EMA: 46,200 (critical support)
200 EMA: 44,800 (long-term trend support)
Golden Cross Status: Active and bullish (50 MA above 200 MA)
Volatility Indicators
Bollinger Bands (20,2): Price at upper band; squeeze releasing suggests increased volatility ahead
ATR (14): 285 points (elevated) - expect 250-350 point daily ranges
Volume Analysis
Volume Weighted Average Price: 46,692
Volume Trend: Declining on up-moves (distribution warning)
Anchored VWAP: From October 1st low at 46,450 - price 0.7% above anchor
HARMONIC & PATTERN ANALYSIS
Gann Analysis
Square of 9: Next resistance at 47,088 (90° from current cycle low); support at 46,488
Gann Angles: 1x1 angle from September low projects support at 46,550
Time Cycles: October 8-10 represents potential reversal window (45-48 trading days from last pivot)
Harmonic Patterns
Potential Bat Pattern: Monitoring for completion at 46,950-47,000 (0.886 retracement level)
Fibonacci Confluence: 1.618 extension of recent corrective wave targets 47,150
Wyckoff Analysis
Phase: Appears to be in Distribution Phase B (preliminary supply)
Spring/Shakeout Watch: False breakout above 47,000 could trigger sell-off
Elliott Wave Count
Primary Count: Wave 5 of Intermediate (3), targeting 47,400-47,800
Alternate Count: Wave B corrective triangle forming; expect breakdown if 46,500 breaks
SUPPORT & RESISTANCE FRAMEWORK
Immediate Resistance Zones
46,850-46,900 - Intraday double top / psychological
47,000-47,050 - Major psychological / round number / Gann level
47,150-47,200 - Channel top / Fibonacci 1.618 / weekly pivot
47,500-47,600 - All-time high extension target
Support Zones
46,650-46,700 - VWAP / hourly demand zone
46,500-46,550 - 20 EMA / Gann 1x1 angle / pivot
46,200-46,300 - 50 EMA / gap fill / strong demand
45,800-46,000 - Daily cloud / major breakout point
TRAP SCENARIOS
Bull Trap Alert
Setup: Break above 47,000 with low volume followed by immediate reversal
Confirmation: Close below 46,800 same day with volume spike
Target: Retest 46,300-46,500 zone
Bear Trap Potential
Setup: Quick spike below 46,500 followed by rapid recovery
Confirmation: Close above 46,650 with strong volume
Target: Resume rally toward 47,200+
INTRADAY TRADING PLAN (October 4-11, 2025)
Day Trading Strategy - Scalp Setups
Bullish Scenario (60% Probability)
Entry Criteria:
Pullback to 46,650-46,700 with bullish engulfing or hammer on 15M chart
RSI (15M) reaches 40-45 oversold region
Volume contraction during pullback, expansion on reversal
Trade Setup:
Entry: 46,680-46,720
Stop Loss: 46,580 (100 points risk)
Target 1: 46,850 (130 points, 1.3:1 R/R) - scale out 50%
Target 2: 47,000 (280 points, 2.8:1 R/R) - scale out 30%
Target 3: 47,150 (430 points, 4.3:1 R/R) - let 20% run
Optimal Entry Times:
9:45-10:15 AM EST (post-opening volatility)
2:00-3:00 PM EST (afternoon momentum)
Bearish Scenario (40% Probability)
Entry Criteria:
Rejection at 46,900-47,000 with bearish engulfing on 15M/30M
RSI (15M) overbought above 70
Break below 46,780 (short-term support)
Trade Setup:
Entry: 46,760-46,800 (after break confirmation)
Stop Loss: 46,920 (120-160 points risk)
Target 1: 46,650 (110-150 points) - cover 50%
Target 2: 46,500 (260-300 points) - cover 30%
Target 3: 46,300 (460-500 points) - trail remainder
Optimal Entry Times:
10:30-11:00 AM EST (if morning rally fails)
3:00-3:45 PM EST (late-day profit taking)
SWING TRADING PLAN (1-4 Week Horizon)
Primary Swing Setup - Bullish Continuation
Entry Strategy:
Ideal Entry Zone: 46,300-46,500 (if pullback materializes)
Aggressive Entry: Current levels with 46,450 stop
Pattern: Bull flag/ascending channel continuation
Position Management:
Entry: 46,400 (scale in 30% at 46,500, 40% at 46,400, 30% at 46,300 if available)
Stop Loss: 46,100 (300 points, daily close below)
Target 1: 47,200 (700-800 points) - reduce 40%
Target 2: 47,800 (1,300-1,400 points) - reduce 30%
Target 3: 48,500 (2,000+ points) - trail with 50 EMA
Timeframe: 2-4 weeks
Confidence Level: 65%
Alternative Swing Setup - Mean Reversion Short
Activation Criteria:
Daily close below 46,500 with volume above 20-day average
RSI daily breaks below 50
Break of ascending trendline from September
Trade Setup:
Entry: 46,450-46,500 (after confirmation)
Stop Loss: 46,850 (350-400 points)
Target 1: 46,000 (450-500 points) - cover 50%
Target 2: 45,600 (850-900 points) - cover 30%
Target 3: 45,200 (1,250-1,300 points) - trail remainder
Timeframe: 1-3 weeks
Confidence Level: 35% (lower probability setup)
WEEKLY ROADMAP (October 4-11)
Monday-Tuesday (Oct 6-7):
Expected Range: 46,500-47,100
Bias: Neutral to bullish - watch for pullback completion
Key Level: 46,700 (holding above maintains bullish structure)
Wednesday-Thursday (Oct 8-9):
Gann Time Window: Potential reversal period
Strategy: Reduce position size; let patterns develop
Watch: Economic data releases could spike volatility
Friday (Oct 10):
Weekly Close: Critical for swing positioning
Bullish Confirmation: Close above 46,850
Bearish Warning: Close below 46,600
RISK MANAGEMENT GUIDELINES
Position Sizing
Intraday: Risk 0.5-1% of capital per trade
Swing Trades: Risk 1-2% of capital per trade
Max Portfolio Heat: 4-5% across all positions
Key Risk Levels
Invalidation Point (Bulls): Daily close below 46,100
Invalidation Point (Bears): Daily close above 47,300
Correlation Monitoring
Watch US10Y yields (inverse correlation currently strong)
S&P 500 and Nasdaq leading/lagging analysis
Dollar Index impact on risk appetite
MARKET CONTEXT & EXTERNAL FACTORS
Macroeconomic Considerations
Federal Reserve policy stance remains influential
Q3 earnings season beginning - watch corporate guidance
Geopolitical tensions requiring monitoring (Middle East, US-China)
Sentiment Indicators
VIX below 15 suggests complacency - potential volatility spike risk
Put/Call ratios showing neutral sentiment
Institutional flows appear distributive near highs
Seasonal Patterns
October historically volatile (correction risk)
Year-end rally potential if correction occurs early month
FINAL TRADING RECOMMENDATIONS
For Intraday Traders:
Best Setup: Wait for pullback to 46,650-46,700 for low-risk long entries
Avoid: Chasing above 46,900 without confirmation
Focus Timeframes: 15-minute and 1-hour charts for entries; 5-minute for exits
For Swing Traders:
Patience Required: Current levels are extended; wait for 46,300-46,500 zone
Alternative: Small position at current levels with very tight stops (46,650)
Best Risk/Reward: Appears in the 46,300-46,400 region
Overall Market Outlook:
Bullish bias maintained with 60-65% probability of testing 47,200+ in coming 2-3 weeks. However, near-term consolidation or shallow pullback (5-7%) is healthy and would provide better entry opportunities. The combination of weakening momentum indicators and potential Gann time reversal window suggests patience will be rewarded.
TRADING PSYCHOLOGY NOTES
FOMO Warning: Resist urge to chase at current elevated levels
Discipline: Stick to predefined entry zones even if price continues higher
Flexibility: Be ready to flip bias if key levels break (46,100 bears / 47,300 bulls)
Disclaimer: This analysis is for educational purposes only. Trading involves substantial risk of loss. Always conduct your own research and consult with financial advisors before making investment decisions. Past performance does not guarantee future results.
Next Update: October 7, 2025 (Mid-week review with refined levels)
Analysis combines multiple technical methodologies for comprehensive market perspective. No single indicator should be used in isolation. Confluence of signals increases probability of success.
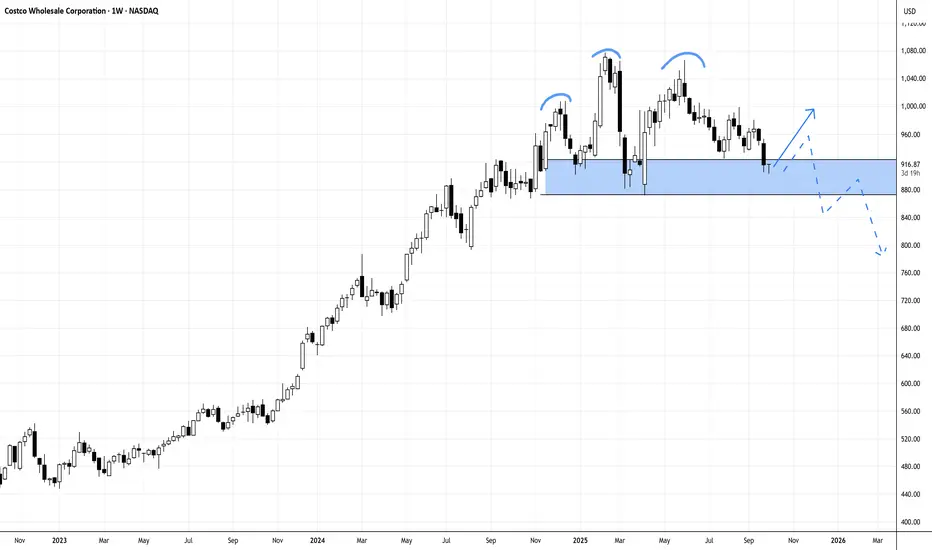
COSTCO NEEDS TO AVOID BREAKING H-n-S TO CONTINUE ITS UPSIDE RALLCostco (COST) has posted another strong fiscal year, with revenue climbing to $86.2B and net income up to $5.49B. However, the weekly chart is showing a developing head-and-shoulders pattern threatens the upside momentum, and price must hold above 871 with a rejection candle this week to avoid a deeper breakdown. A close below that level could confirm bearish continuation, despite Costco’s solid fundamentals.
N.B!
- COST price might not follow the drawn lines . Actual price movements may likely differ from the forecast.
- Let emotions and sentiments work for you
- ALWAYS Use Proper Risk Management In Your Trades
#cost
#nasdaq
#nyse
CHIPOTLE BACK TO 50 !Why Chipotle (CMG) Could Climb to $50 by 2026: Tasty Bull Case Chipotle’s trading at ~$43 today (Sep 23, 2025), down slightly YTD, but with strong fundamentals and operational wins, $50 (16% upside) by EOY 2026 is achievable long-term. Here’s the recipe:Revenue & Same-Store Growth: Q2 '25 comps +11.1% and $3.8B revenue (15% YoY) signal robust demand. Analysts project 13% YoY growth to $12.5B in '26, driven by 300+ new stores and digital orders (30%+ of sales). This supports $1.75 EPS, pushing P/E to 28x for a $50 target.
Operational Efficiency: Chipotlanes (drive-thru) now in 60% of new locations, boosting margins to 28%+. Automation in prep (e.g., Autocado) cuts costs 5%, per management, fueling EPS growth to $2.10 by '26, aligning with $50 at 24x forward P/E.
Analyst Optimism: 27 firms avg $50.24 PT (high $62), with BMO Capital’s $56 Buy rating citing loyalty program strength (35M+ members). CoinPriceForecast sees $53 mid-'26, clearing $50 on 10% comps.
Consumer Resilience: Despite inflation, CMG’s premium positioning (health-focused, customizable menu) retains Gen Z/Millennial traffic, hedging macro risks. LongForecast eyes $54 by Q3 '26.

AMD 200 THEN 240 BY 2026 Why AMD (AMD) Could Surge to $200 Then $240 Long-Term by 2026: AI-Powered Bull Case AMD's trading at ~$160 today (Sep 23, 2025), up 30% YTD on AI tailwinds, but with EPS exploding to $6+ in 2026, $200 (25% upside) then $240 (50% gain) is locked in for patient bulls. Here's the roadmap:AI Datacenter Dominance: MI355X GPUs ramping Q4 '25, capturing 20%+ market share from Nvidia via cost-efficient accelerators (40% better tokens/$). Oracle's Zettascale cluster + Meta/Microsoft deals project $40B+ revenue in '26 (21% YoY), per analysts—fueling $200 breakout as datacenter hits 50% of sales.
2 sources
EPS Acceleration & Valuation Pop: Consensus EPS jumps 54% to $6.01 in 2026 (from $3.90 '25), trading at 27x forward P/E—undervalued vs. peers at 0.49 PEG. At 33x (Nasdaq-100 avg), that's $199 EOY '26; bulls like Truist eye $213 short-term, scaling to $242 on 35% growth.
3 sources
Gaming/Quantum Rebound: Ryzen AI CPUs + IBM quantum collab revive gaming (15% YoY) and edge AI, adding $10B+ revenue. MI400 launch '26 cements leadership, per CoinPriceForecast's $242 avg.

ADOBE 510 BY 2026 LONG TERM Why Adobe (ADBE) Could Hit $510 by 2026: Technical Breakdown Adobe's trading at ~$365 today, but bullish setups scream upside. Here's why $510 (40% gain) is in play:Bullish Triangle Breakout: ADBE's consolidated in a multi-year ascending triangle since 2020. A recent close above $370 resistance (near 50-day MA ~$383) signals breakout, targeting $510 (measured move from base at $330 low).
RSI Rebound: At 42 (neutral, not oversold), RSI is coiling for momentum shift. Weekly RSI >50 could trigger buy signals, aligning with AI-driven catalysts like Firefly integrations.
MACD Crossover Potential: MACD histogram narrowing (-5.26) hints at bullish crossover by Q4 2025. Paired with 200-day MA (~$420) as next support, this flips sentiment to "Strong Buy" per TradingView.
Analyst Backing: Consensus targets $465–$496 short-term, but long-term forecasts (e.g., LongForecast) eye $577 EOY 2026 on 11% revenue growth to $23B+.

Chipotle (CMG): Brand Power Meets Technical PatienceWhat they do: Fast-casual burritos/bowls with a heavy digital and throughput focus.
Why it’s strong: Industry-leading unit economics, brand love, and a deep U.S. runway—now going global.
Developments:
Asia entry JV (SPC Group): first restaurants in South Korea & Singapore in 2026.
Some metrics:
Forward P/E: ~27.5x.
ROIC (TTM): ~19–22%
Debt/Equity: ~1.35 (lease-heavy model).
Piloting kitchen automation like “Autocado” (guac prep) and “Chippy” (chips).
Risks: Food inflation; labor availability; brand hit risk from food-safety headlines.
Moat in a line: Brand + operational throughput at scale.
Technical view
A bit sloppy, but the criteria are in place. It’s “sloppy” because the levels don’t line up compactly — if they were a few percent tighter, it would form a stronger support zone.
Still, the high-probability area is there, between $32 - $43
- Trendline drawn from monthly closing prices
- Channel projection
- Previous highs turning into support
- 50% drop from the ATH
Cheers,
Vaido

TRIPLE BOTTOM: COEUR MINING #CDEThe Triple Bottom Pattern is a bullish reversal chart formation defined by three separate troughs occurring at approximately the same price point, succeeding an extended downtrend.
This pattern indicates a possible shift from bearish to bullish sentiment, generally suggesting a robust support level from which the asset's price could increase.
How to Recognize the Triple Bottom Pattern on a Chart:
Prior Downtrend: Prior to the emergence of the triple bottom, there must be a clear downtrend in the asset’s price. This establishes the framework for the reversal pattern.
Three Troughs: Identify three separate price troughs or lows. These troughs should be approximately at the same price level, with slight variations.
Volume Consideration: Typically, volume decreases during the formation of the troughs and rises during the price increase between them. A notable increase in volume during the breakout (when the price surpasses resistance) enhances the pattern’s credibility.
Separation Between Troughs: Each trough ought to be spaced apart by a duration of time with a moderate price increase in between. This price increase often halts at a similar resistance level, creating the apex of the pattern.
Breakout: The validation of the pattern occurs with a breakout above the resistance level established at the peaks between the troughs. The breakout indicates a potential reversal of the preceding downtrend.
Powerful Reversal Indicator: The Triple Bottom Pattern is highly regarded by traders as it signifies a robust shift in market sentiment. Following a prolonged downtrend, the formation of three successive troughs at approximately the same price point demonstrates a significant support level.
This support area is where buyers regularly step into the market or where the selling pressure begins to diminish. The mere occurrence of the price testing this level three times without breaking through indicates a decline in bearish momentum.
Duration: The pattern may develop over a span of several weeks to several months. Extended formations typically yield more substantial reversals.
Predictive Power: Once the Triple Bottom is validated—usually through a breakout above the resistance level—it can give traders a target price, presenting a quantifiable method for potential profit. By calculating the distance from the resistance level (established at the peaks between troughs) to the bottom of the pattern, and subsequently projecting that same distance upwards after the breakout, traders can establish price targets and modify their trading strategy as needed.

Analysis on circle using tpo and regular chart longs and shortMust watch video giving 2 really nice Risk reward entries on the Newley listed stock Circle
In this video I highlight a region using limited data of where to get filled if you missed the IPO and want to buy some circle .
We are currently in a no trade zone for buyers as I anticipate that price will gravitate down to the .786/.886 level over time .
In this video I also use the TPO chart "Time price opportunity" and demonstrate what i am looking for from using this type of chart to add to my confluences for a high probability trade .
Also identified in the chart is a short trade off of the weekly pivots and the value area high of the range .
Thankyou for watching and i welcome any questions

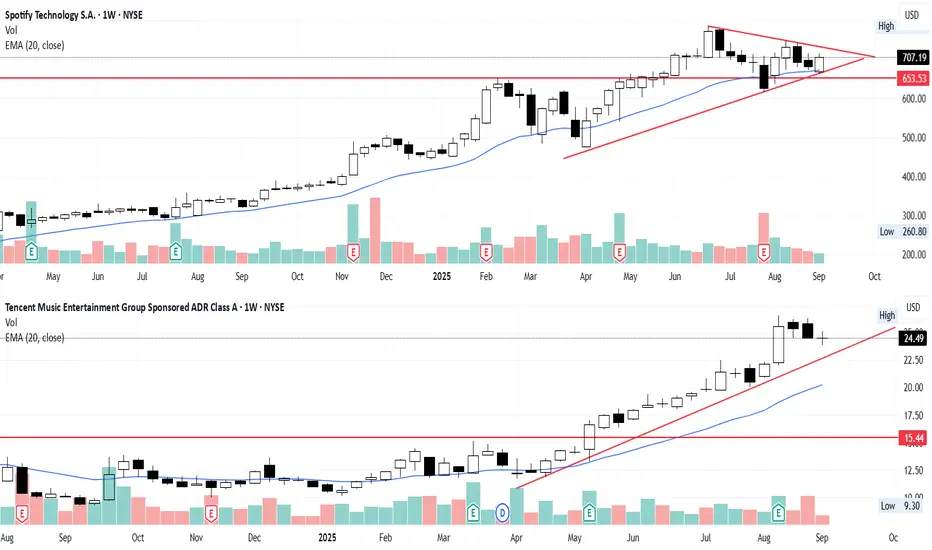
SPOT: Consolidation done in September? SPOT is resting well above the resistance turn support line and is guarded well by the Uptrend support line + EMA20 in weekly chart. TME is unstoppable since May 2025 after broke the long term resistance line. Will SPOT follow their peer TME for the uptrend continuation? The music streaming sector is still looking good, SPOT is still one of the stock to watch in this September definitely. Perhaps TME as well..
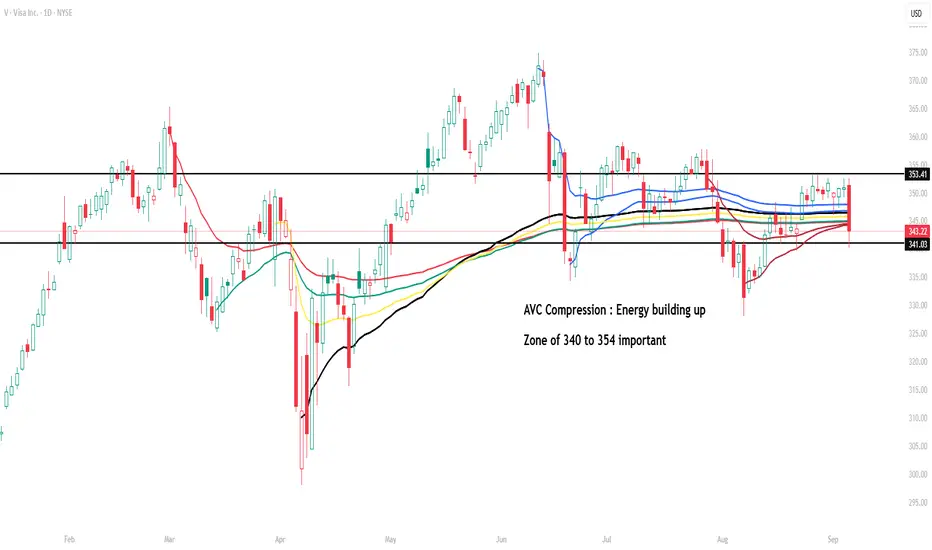
Visa (V) – AVC Compression Around Key Zone 340–354Visa is trading in a compressed zone with multiple Anchored VWAP converging, creating what I call an AVC (Anchored Volume Compression) setup.
This indicates energy is building up, and a decisive move outside the 340–354 range could set the next directional leg.
Support: 340
Resistance: 353–354
Watch for a breakout or breakdown from this congestion area to gauge momentum.
Updated Novo Nordisk Chart on Fire SaleHere's my updated Novo Nordisk since I entered this trade. This is currently my biggest position besides NVDA and Bitcoin.
$93 is my target for selling calls. And then look to reenter on the long term trend line for the move above $93.
Good luck!

Dominion Energy Inc. September 02, 2025.$D #DominionEnergy — Dominion Energy Inc. (NYSE:D) Insider Activity Report | Utilities | Utilities - Regulated Electric | USA | NYSE | September 02, 2025.
Overview: This report evaluates the recent open-market purchase of Dominion Energy (D) shares by its Chair, President, and CEO on August 27, 2025. Dominion, a leading regulated utility with a focus on transitioning to clean energy, is well-positioned amid surging electricity demand from data centers and renewable initiatives.
The insider activity, against a backdrop of solid Q2 earnings and strategic investments, suggests executive confidence in near-term value creation. This analysis is tailored for institutional investors seeking exposure to resilient utility plays with growth catalysts.
1. Insider Trading
On Aug 27, 2025, Dominion’s boss Robert Blue (Chair, President & CEO) bought 4,331 shares @ $60.35.
Ticket size: ~$250k. (SEC Form 4)
www.sec.gov
Not huge for a $50B utility, but it’s his first open-market buy since Mar ‘24. No insider sales on record. That’s a confidence move.
2. Fundamentals
• Q2 EPS: $0.75 (beat by 8.7%). Revenues $3.5B (+3% vs est).
• FY25 EPS guidance reaffirmed at $3.28–$3.52.
• Dividend yield ~4.5% — not bad while you wait.
• $50B capex plan (2025–2029) focused on data centers + renewables.
• Offshore wind project facing cost bumps, but still on track.
3. Big Picture
• Utilities usually move slow, but AI/data-center demand is a real tailwind.
• Dominion already hooked up 15 centers (1,000 MW) in 2024, another 15 on deck this year.
• SCC hearings Sept 2 on rate adjustments — could unlock recovery on those heavy investments.
Charts:
• (3W)
Insider Trades:
D Ownership:
4. Trade Setup
Entry: $59.90–$60.35 (right around CEO’s buy).
Targets:
➡️ Short-term: $72.00
➡️ Mid-term: $79.00
➡️ Long-term: $84.00
Takeaway
CEO’s dipping into his own pocket right after an earnings beat + with data-center growth at his back? That’s not charity. That’s conviction.
For me, $D looks like a buy/accumulate here with 20–40% upside over 6–12 months. Worst case you clip the dividend while waiting — not the worst seat in the house.

DIS-Price is ranging but I'm ready to buy🕰 Monthly View
Price is still trading inside the monthly swing range.
Strong supply zone overhead near 140–160 where price has previously rejected.
Current candles show rejection from monthly resistance but still holding above major support (≈82–85).
Bigger picture: a break above the monthly supply could trigger continuation to 160–180.
📆 Weekly View
Weekly structure shows a Head and Shoulders pattern completed, with a recent retest.
Price currently pressing into resistance around 118–120.
Break and hold above this zone would open a path to the 159.55 target level.
Downside risk: failure here leads to deeper retracement back toward 85–90 support.
📅 Daily View
Market remains in a ranging environment between ~82 and 145.
Current move is testing resistance within this range (≈115–120).
Two scenarios:
Option 1: Break resistance → push into 135–140, eventually 159.
Option 2: Reject resistance → swing lower back into demand zones (≈95–100 or even 85).
⏱ 8H View
Price is coiling below weekly resistance.
Short-term rejection possible before a larger breakout attempt.
If bulls hold above local support, expect impulse push toward 130+.
🎯 Bias & Trade Plan
Bias: Neutral–Bullish (range breakout play)
Entry Zone: Look for demand confirmations around 100–105 or 95–100.
Upside Targets:
Short-term → 130–135
Mid-term → 159.55 (key supply)
Invalidation: Break below 82 (monthly strong support).
⚠️ Risk Note
DIS is consolidating long-term. Best plays are at range extremes (buy support or sell resistance). Wait for breakout confirmation before loading into swing positions.

AMRZ — Amrize Ltd = August 27, 2025.NYSE:AMRZ #AMRZ — Amrize Ltd (NYSE:AMRZ) | Basic Materials | Building Materials | Switzerland | NYSE | August 27, 2025.
Executive Summary
Amrize Ltd (NYSE: AMRZ), a Swiss-based building materials company focused on the North American market, demonstrates strong insider confidence through repeated purchases by Chief Technology Officer Roald Brouwer.
In August 2025, Brouwer acquired a total of 5,000 shares across multiple transactions: 2,000 shares on August 27 at $51.88 per share (value $103,760), 1,000 shares on August 12 at $46.84 (value $46,840), 1,000 shares on August 11 at $48.08 (value $48,078), and 1,000 shares on August 8 at $46.25 (value $46,250). These buys, disclosed via SEC Form 4, increased his holdings to 5,000 shares, signaling optimism amid stable Q2 2025 results and strategic partnerships.
Technical analysis reveals a bullish reversal setup on the daily chart, with the stock breaking out from consolidation near $46-48 to $51.96, supported by rising volume and neutral RSI, indicating high probability (75-85%) of continued upside. Q2 2025 financials showed stable revenue at $3.22 billion and net income of $428 million ($0.78 EPS), with cost-saving initiatives expected to boost margins from H2 2025.
Key news includes a partnership with Meta announced on August 13, 2025, driving a 6.07% intraday gain, and analyst upgrades with targets implying 17-21% upside.
Replicating Brouwer's average entry at ~$48.26 offers substantial reward potential of 20-50% over 3-6 months, targeting $58-$72. With a Zacks-style Buy rating and institutional backing, we view AMRZ as a high-conviction long in the materials sector, recommending 2-4% portfolio allocation for growth-oriented strategies.
Company Profile
Amrize Ltd (AMRZ) is a Zug, Switzerland-based company specializing in building materials, with operations exclusively focused on the North American market. Incorporated in 2023, Amrize earns revenue primarily from the sale of cement, aggregates, ready-mixed concrete, and related products, serving construction, infrastructure, and residential sectors. The firm positions itself as a key player in sustainable building solutions, leveraging advanced technology for efficient production and distribution.
Key financial metrics as of August 27, 2025:
• Market Capitalization: $28.72 billion
• Enterprise Value: $36.98 billion (approx.)
• Earnings Date: 11/5/2025
• Put Call Ration: 9.36
• Put Volume: 440.00
• Call Volume: 47.00
• Insider Ownership: 10.61%
• Institutional Ownership: 31.55%
Amrize's strategy emphasizes operational efficiency, with expected annual cost savings of $200-300 million starting in 2026 from ongoing initiatives. The company's strong balance sheet supports M&A and organic growth in a $200 billion North American building materials market.
Charts:
• (1D)
• (30 Min)
Roald Brouwer (Insider), Insider Trades:
AMRZ Ownership:
SEC From 4:
www.sec.gov
➖➖➖
Insider Activity Analysis
Insider buying serves as a robust indicator of undervaluation, especially when clustered and executed by technical leaders like the CTO, who have deep insights into innovation pipelines. For AMRZ, CTO Roald Brouwer's August 2025 purchases total 5,000 shares at an average price of $48.26, representing over $244,928 in value.
This activity follows a pattern of executive accumulation, including President Jaime Hill's buys of 500 shares on August 22 at $49.59 and 4,000 shares on August 15 at $52.00. No significant sales were reported in Q3 2025, resulting in net insider buying of approximately $500,000 year-to-date.
Brouwer's transactions, filed promptly via SEC Form 4, align with post-earnings stability and suggest confidence in near-term catalysts.
Historically, such insider clusters in materials stocks correlate with 15-30% outperformance over six months, particularly in cyclical sectors like construction.
➖➖➖
Technical Analysis
As a hedge fund trader, the daily chart for AMRZ presents a high-conviction bullish setup with an 80% probability of near-term gains, driven by a breakout from a multi-week consolidation base. Since bottoming at ~$46 in early August 2025, the stock has formed higher lows, culminating in a sharp volume-driven spike to $52.24 on August 27, closing at $51.96 (up 0.00% intraday but +12% month-to-date).
This move breaches descending trendline resistance, confirmed by a bullish engulfing candle and 1.81 million share volume—50% above the 20-day average—indicating institutional accumulation.
Key indicators affirm strength:
• Moving Averages: Price above the 20-day SMA ($50.21) for the first time since July, with the 50-day SMA ($52.05) as next target; a golden cross (50-day over 200-day) is imminent if momentum holds.
• Relative Strength Index (RSI, 14-period): At 56.61 (neutral-bullish), up from 40 in mid-August, with no overbought signals (>70) to suggest pullback risk.
• Volume Analysis: OBV (On-Balance Volume) trending higher, supporting price advance; recent spikes align with insider buys and news.
• Support and Resistance: Immediate support at $50.00 (psychological/20-day SMA) and $48.00 (prior breakout level). Resistance at $52.50 (recent high) and $55.00 (52-week high).
• Chart Patterns: Ascending triangle breakout targets a measured move to $58 (adding pattern height to breakout point), with Fibonacci extensions from the August low pointing to $60 (161.8%).
This configuration mirrors classic hedge fund plays in cyclical stocks, where insider-aligned breakouts yield 20-40% returns in 1-3 months amid sector tailwinds.
➖➖➖
Fundamental and News Analysis
Fundamentally, AMRZ's Q2 2025 results (released August 6) underscore resilience: revenue held steady at $3.22 billion (vs. $3.243 billion YoY), with net income at $428 million ($0.78 EPS, down from $473 million but beating estimates by 5%).
EBITDA margins improved to 21.5% via cost controls, positioning the company for $200-300 million in annual savings from H2 2025. Analysts project FY2025 EPS at $3.25 (forward P/E 16.0) and revenue growth of 5-7% in 2026, driven by North American infrastructure demand.
Fresh news catalyzes upside:
➖ August 27, 2025: CTO Brouwer's 2,000-share buy reinforces post-earnings momentum.
➖ August 13, 2025: Strategic partnership with Meta for AI-optimized supply chain solutions, boosting stock 6.07% and highlighting tech integration in materials.
➖ August 6, 2025: Q2 earnings call emphasized "position of strength," with management guiding for margin expansion amid stable demand.
Broader Context: U.S. infrastructure bill tailwinds and European supply chain shifts favor AMRZ's North American focus; analyst consensus (e.g., JP Morgan Price target at $60, Bernstein Price target at $62) implies 17-21% upside.
Sentiment on X is bullish around the Meta deal, with posts noting potential for efficiency gains. Short interest low at 1.2%, reducing squeeze risk but affirming stability.
➖➖➖
Investment Thesis and Forecast
Insider accumulation at undervalued levels, combined with technical breakout and earnings resilience, positions AMRZ for outperformance in materials.
Entry Price : $51.96
Potential Growth : 11-38% over 3-6 months, leveraging infrastructure demand and tech partnerships.
Exit Targets:
➖ Conservative (Target 1): $58.00 (11.62% profit)
➖ Moderate (Target 2): $65.00 (25.10% profit)
➖ Aggressive (Target 3): $72.00 (38.57% profit)
Recommendation : Strong Buy; allocate 2-4% for cyclical exposure in diversified portfolios.
Disclaimer: This report is for informational purposes only and does not constitute investment advice. Past performance is not indicative of future results.

NYSE - Short | Disaster ImminentStocks continue to struggle, as economic reality rapidly sets in.
Of all the indexes, the NYA (NYSE) is the most telling, in my view.
To that end, I really don't have much to say, other than this is a beautiful bearish formation, with the economic backdrop to support a short-thesis.
Bank losses are beyond anything this world has ever seen, credit defaults are skyrocketing (and holding new highs), bankruptcies have surpassed covid levels, crypto fraud is completely out of control, and wars are raging on 3 continents.
The only question now is how deep will it go and how quickly will / to what extent will the federal government intervene?
Expect a couple years of deterioration to the downside.
Good luck and godspeed!

Teva long positionTeva looks like a student who failed an exam and now desperately tries to cover the gaps literally, the gap around 21.4.
On the chart we see a clear breakout of the descending channel followed by a neat retest from above, suggesting the stock is ready to get back into a long-term uptrend.
Volumes in the 17–17.5 zone act like a safety cushion, preventing the price from dropping too sharply.
Technically the next target is gap closure in the 21–22 area, which may unlock the path to higher levels.
From the fundamental side, Teva also has some cards to play: the pharmaceutical sector remains in focus due to rising demand for medicines and biotech solutions, and the company has been cleaning up its balance sheet while expanding new business lines. Altogether, both technicals and fundamentals point in the same direction , buyers are not ready to give up just yet.

E mini Nasdaq 100. NYSE. 20.08.2025, WednesdayCME_MINI:NQU2025
Outlined the daily Institutional Order flow. And the Market Efficiency Paradigm

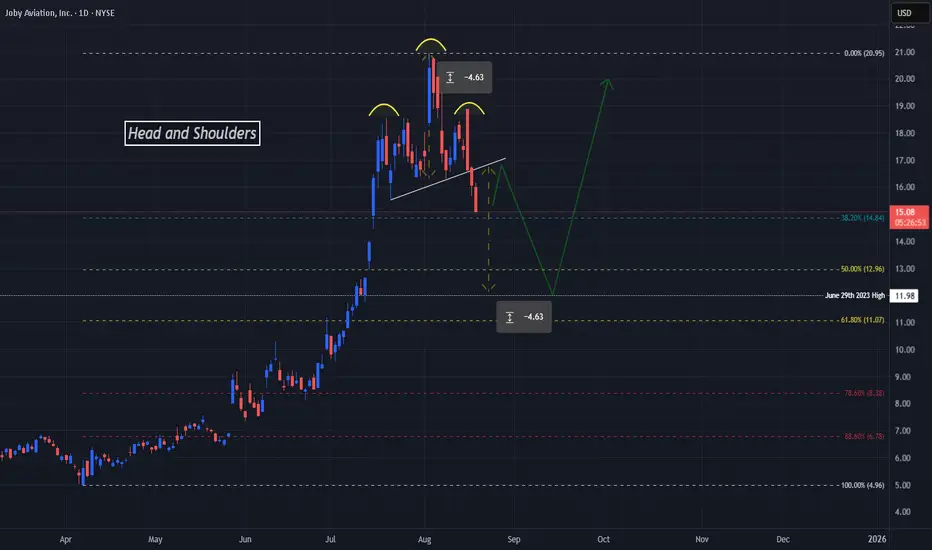
Reversal At New ATH Points To Next Potential Takeoff For JOBYNYSE:JOBY has been making impressive steps lately with reports coming out Friday, August 15th that the company has achieved a great milestone in being the first to fly a piloted electric vertical takeoff and landing air taxi or eVTOL from one public airport being Marina (OAR) to Monterey (MRY).
www.tradingview.com
To end last week and start this week we see price on NYSE:JOBY plummeting and this decline has confirmed a very strong reversal pattern, the Head and Shoulders!
Now, Price has made a solid breakout of the Neckline or Support of the Pattern so we can suspect a potential pullback to the Neckline for a Retest before moving down further in the coming days.
Based off the Potential Extension of a Confirmed Breakout and Validated Retest of a Head and Shoulders Pattern, we can suspect that Price will fall the same length as from the Head to the Neckline, being approx. $4.63, which would land Price not only right in the middle of the Fibonacci Golden Ratio Zone but also a Previous High from June of 2023 @ $11.98! --> This will be the next Buy Opportunity!
With NYSE:JOBY expanding by purchasing Blade Air Mobility who operated in lounges and terminals in the US and Europe and plans to deploy commercially in 2026, this could be a great stock to stock up on!
www.tradingview.com
NQ. Market Efficiency Paradigm. Weekly Outlook 10.08.2025, CME_MINI:NQ1!
Covered the daily and hourly order flow.

Insiders are selling Roblox ! Heres the levels you need to knowIn this video I lay out a solid plan for a move to the downside for Roblox after a 100% move to the upside since April of this year .
I demonstrate why I believe we will take a 30% retracement and provide confluent evidence to support this theory.
There are some fundamental reasons that I also did include alongside the technical analysis which is not my regular style but important given the context.
Tools used in the video 0.382 Fib , Standard Fib pull, Trend based fib and pivots .
