NZDUSD - Bears Brewing at a Critical Intersection!!!📉NZDUSD has been moving inside a clear bearish structure , with lower highs forming along the orange descending trendline.
⚔️Price is now approaching a major confluence area where the upper orange trendline meets the green resistance zone, a level that has repeatedly acted as a ceiling.
As price retests this intersection, we will be looking for trend-following short setups, expecting sellers to defend this area and potentially drive price back downward within the bearish cycle.
A strong breakout above the trendline would invalidate the short bias, but unless that happens, the bears remain in control.
Are you seeing the same reaction zone on your charts? Let me know 👇
⚠️ Disclaimer: This is not financial advice. Always do your own research and manage risk properly.
📚 Stick to your trading plan regarding entries, risk, and management.
Good luck! 🍀
All Strategies Are Good; If Managed Properly!
~Richard Nasr
NZD (New Zealand Dollar)

Falling towards pullback support?NZD/JPY is falling towards the pivot which acts as a pullback support and could bounce to the pullback resistance.
Pivot: 89.71
1st Support: 88.97
1st Resistance: 90.75
Disclaimer:
The opinions given above constitute general market commentary and do not constitute the opinion or advice of IC Markets or any form of personal or investment advice.
Any opinions, news, research, analyses, prices, other information, or links to third-party sites contained on this website are provided on an "as-is" basis, are intended to be informative only, and are not advice, a recommendation, research, a record of our trading prices, an offer of, or solicitation for, a transaction in any financial instrument and thus should not be treated as such. The information provided does not involve any specific investment objectives, financial situation, or needs of any specific person who may receive it. Please be aware that past performance is not a reliable indicator of future performance and/or results. Past performance or forward-looking scenarios based upon the reasonable beliefs of the third-party provider are not a guarantee of future performance. Actual results may differ materially from those anticipated in forward-looking or past performance statements. IC Markets makes no representation or warranty and assumes no liability as to the accuracy or completeness of the information provided, nor any loss arising from any investment based on a recommendation, forecast, or any information supplied by any third party

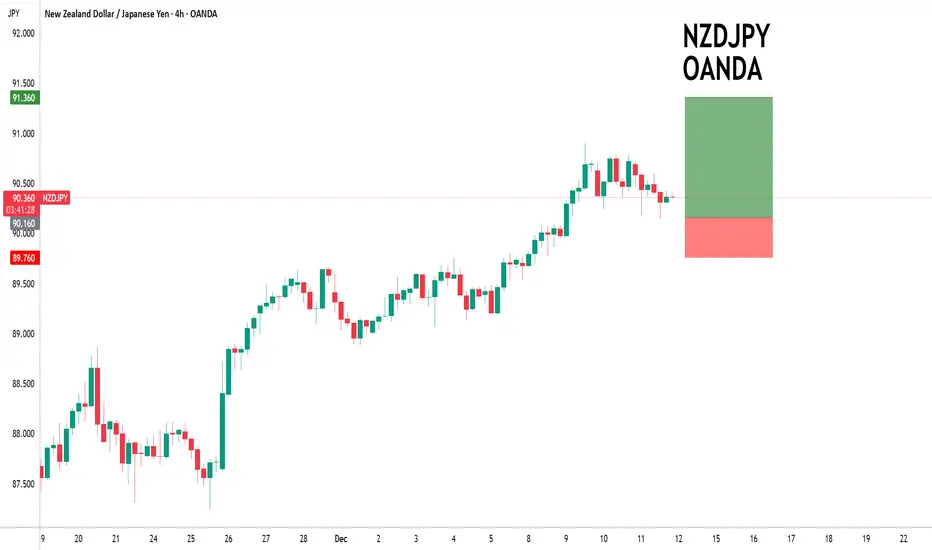
NZDJPY to continue in the upward move?NZDJPY - 24h expiry
Our short term bias remains positive.
There is no clear indication that the upward move is coming to an end.
Offers ample risk/reward to buy at the market.
The sequence for trading is higher highs and lows.
Daily signals are bullish.
We look to Buy at 90.16 (stop at 89.76)
Our profit targets will be 91.36 and 91.56
Resistance: 90.90 / 91.50 / 92.00
Support: 90.14 / 89.50 / 88.88
Risk Disclaimer
The trade ideas beyond this page are for informational purposes only and do not constitute investment advice or a solicitation to trade. This information is provided by Signal Centre, a third-party unaffiliated with OANDA, and is intended for general circulation only. OANDA does not guarantee the accuracy of this information and assumes no responsibilities for the information provided by the third party. The information does not take into account the specific investment objectives, financial situation, or particular needs of any particular person. You should take into account your specific investment objectives, financial situation, and particular needs before making a commitment to trade, including seeking, under a separate engagement, as you deem fit.
You accept that you assume all risks in independently viewing the contents and selecting a chosen strategy.
Where the research is distributed in Singapore to a person who is not an Accredited Investor, Expert Investor or an Institutional Investor, Oanda Asia Pacific Pte Ltd (“OAP“) accepts legal responsibility for the contents of the report to such persons only to the extent required by law. Singapore customers should contact OAP at 6579 8289 for matters arising from, or in connection with, the information/research distributed.
NZDUSD - Triple Confluence Zone in Play!NZDUSD has been in a steady bearish trend, but the pair is now reaching a major confluence area that could act as a strong turning point.
🔎The blue circle marks the intersection of two descending trendlines and a key demand zone, making it a massive area to look for long opportunities.
⚔️This triple intersection increases the probability of a bullish rebound, especially as the pair is also showing signs of being oversold. A potential rejection from this zone could trigger a short-term correction toward the upper orange trendline, aligning with the next resistance area.
🏹As long as this demand zone holds , the bulls have a chance to step in and shift short-term momentum upward.
⚠️ Disclaimer: This is not financial advice. Always do your own research and manage risk properly.
📊All Strategies Are Good; If Managed Properly!
~Richard Nasr

NZDCHF Is Bearish! Short!
Take a look at our analysis for NZDCHF.
Time Frame: 4h
Current Trend: Bearish
Sentiment: Overbought (based on 7-period RSI)
Forecast: Bearish
The market is on a crucial zone of supply 0.466.
The above-mentioned technicals clearly indicate the dominance of sellers on the market. I recommend shorting the instrument, aiming at 0.463 level.
P.S
We determine oversold/overbought condition with RSI indicator.
When it drops below 30 - the market is considered to be oversold.
When it bounces above 70 - the market is considered to be overbought.
Like and subscribe and comment my ideas if you enjoy them!

Bearish reversal off swing high resistance?NZD/CHF has rejected off the resistance level, which is a swing high resistance that aligns with the 127.2% Fibonacci extension and could reverse from this level to our take profit.
Entry: 0.4654
Why we like it:
There is a swing high resistance that aligns with the127.2% Fibonacci extension.
Stop loss: 0.4675
Why we like it:
There is a swing high resistance that aligns with the 128.2% Fibonacci extension.
Take profit: 0.4589
Why we like it:
There is an overlap support level that aligns with the 38.2% Fibonacci 38.2% Fibonacci retracement.
Enjoying your TradingView experience? Review us!
Please be advised that the information presented on TradingView is provided to Vantage (‘Vantage Global Limited’, ‘we’) by a third-party provider (‘Everest Fortune Group’). Please be reminded that you are solely responsible for the trading decisions on your account. There is a very high degree of risk involved in trading. Any information and/or content is intended entirely for research, educational and informational purposes only and does not constitute investment or consultation advice or investment strategy. The information is not tailored to the investment needs of any specific person and therefore does not involve a consideration of any of the investment objectives, financial situation or needs of any viewer that may receive it. Kindly also note that past performance is not a reliable indicator of future results. Actual results may differ materially from those anticipated in forward-looking or past performance statements. We assume no liability as to the accuracy or completeness of any of the information and/or content provided herein and the Company cannot be held responsible for any omission, mistake nor for any loss or damage including without limitation to any loss of profit which may arise from reliance on any information supplied by Everest Fortune Group.

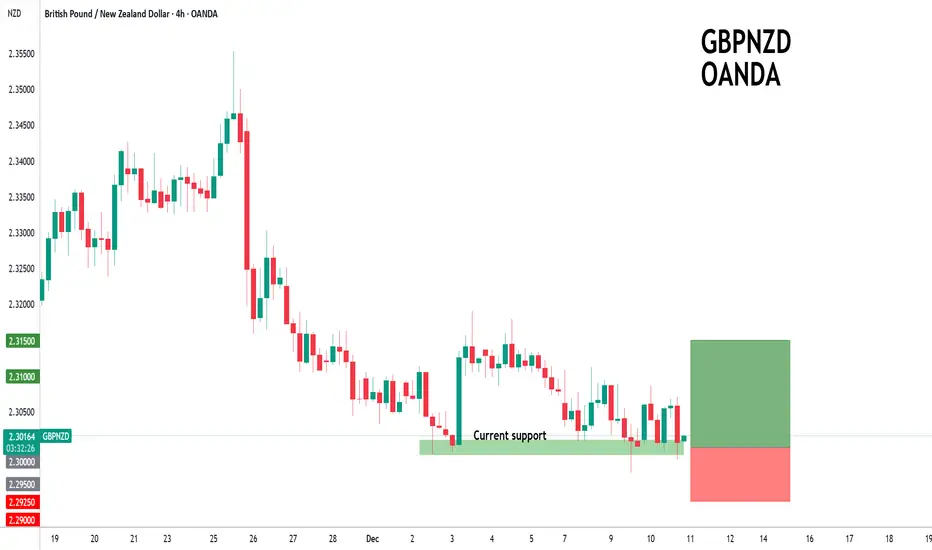
GBPNZD to find buyers at market price?GBPNZD - 24h expiry
The selloff is close to an exhaustion count on the intraday chart.
We expect a reversal in this move.
Risk/Reward would be poor to call a buy from current levels.
A move through 2.3100 will confirm the bullish momentum.
The measured move target is 2.3175.
We look to Buy at 2.3000 (stop at 2.2925)
Our profit targets will be 2.3150 and 2.3175
Resistance: 2.3100 / 2.3150 / 2.3175
Support: 2.3050 / 2.3025 / 2.3000
Risk Disclaimer
The trade ideas beyond this page are for informational purposes only and do not constitute investment advice or a solicitation to trade. This information is provided by Signal Centre, a third-party unaffiliated with OANDA, and is intended for general circulation only. OANDA does not guarantee the accuracy of this information and assumes no responsibilities for the information provided by the third party. The information does not take into account the specific investment objectives, financial situation, or particular needs of any particular person. You should take into account your specific investment objectives, financial situation, and particular needs before making a commitment to trade, including seeking, under a separate engagement, as you deem fit.
You accept that you assume all risks in independently viewing the contents and selecting a chosen strategy.
Where the research is distributed in Singapore to a person who is not an Accredited Investor, Expert Investor or an Institutional Investor, Oanda Asia Pacific Pte Ltd (“OAP“) accepts legal responsibility for the contents of the report to such persons only to the extent required by law. Singapore customers should contact OAP at 6579 8289 for matters arising from, or in connection with, the information/research distributed.
NZDCAD Massive Long! BUY!
My dear subscribers,
NZDCAD looks like it will make a good move, and here are the details:
The market is trading on 0.7986 pivot level.
Bias - Bullish
My Stop Loss - 0.7979
Technical Indicators: Both Super Trend & Pivot HL indicate a highly probable Bullish continuation.
Target - 0.7998
About Used Indicators:
The average true range (ATR) plays an important role in 'Supertrend' as the indicator uses ATR to calculate its value. The ATR indicator signals the degree of price volatility.
Disclosure: I am part of Trade Nation's Influencer program and receive a monthly fee for using their TradingView charts in my analysis.
———————————
WISH YOU ALL LUCK

Bearish reversal off key resistance?EUR/NZD is rising towards the pivot and could reverse to the 1st support, which is a multi swing low suport.
Pivot: 2.02816
1st Support: 2.00578
1st Resistance: 2.03851
Disclaimer:
The opinions given above constitute general market commentary and do not constitute the opinion or advice of IC Markets or any form of personal or investment advice.
Any opinions, news, research, analyses, prices, other information, or links to third-party sites contained on this website are provided on an "as-is" basis, are intended to be informative only, and are not advice, a recommendation, research, a record of our trading prices, an offer of, or solicitation for, a transaction in any financial instrument and thus should not be treated as such. The information provided does not involve any specific investment objectives, financial situation, or needs of any specific person who may receive it. Please be aware that past performance is not a reliable indicator of future performance and/or results. Past performance or forward-looking scenarios based upon the reasonable beliefs of the third-party provider are not a guarantee of future performance. Actual results may differ materially from those anticipated in forward-looking or past performance statements. IC Markets makes no representation or warranty and assumes no liability as to the accuracy or completeness of the information provided, nor any loss arising from any investment based on a recommendation, forecast, or any information supplied by any third party

Bullish bounce off?AUD/NZD is falling towards the pivot, which has been identified as an overlap support that aligns with the 50% Fibonacci retracement and could rise to the 1st resistance.
Pivot: 1.1453
1st Support: 1.1429
1st Resistance: 1.1502
Disclaimer:
The opinions given above constitute general market commentary and do not constitute the opinion or advice of IC Markets or any form of personal or investment advice.
Any opinions, news, research, analyses, prices, other information, or links to third-party sites contained on this website are provided on an "as-is" basis, are intended to be informative only, and are not advice, a recommendation, research, a record of our trading prices, an offer of, or solicitation for, a transaction in any financial instrument and thus should not be treated as such. The information provided does not involve any specific investment objectives, financial situation, or needs of any specific person who may receive it. Please be aware that past performance is not a reliable indicator of future performance and/or results. Past performance or forward-looking scenarios based upon the reasonable beliefs of the third-party provider are not a guarantee of future performance. Actual results may differ materially from those anticipated in forward-looking or past performance statements. IC Markets makes no representation or warranty and assumes no liability as to the accuracy or completeness of the information provided, nor any loss arising from any investment based on a recommendation, forecast, or any information supplied by any third party

NZDUSD: bearish reversal🛠 Technical Analysis: On the 4-hour timeframe, NZDUSD is showing signs of exhaustion after a sustained rally. The price is now trading near a strong resistance zone around 0.5850 and is expected to execute a short-term jump towards 0.5850-0.5880 for a final liquidity grab (liquidating late buyers) before a major reversal. The chart shows a potential downside move back to the key support level at 0.5690.
———————————————
❗️ Trade Parameters (SELL)
———————————————
➡️ Entry Point: Sell at Resistance (approx. 0.5850 – 0.5880)
🎯 Take Profit: 0.5690 (Support)
🔴 Stop Loss: Above the resistance zone (approx. 0.5915)
⚠️ Disclaimer: This is a potential trade idea based on current analysis; market conditions and price direction are subject to change based on news factors and volatility.

Bullish bounce off overlap support?NZD/CHF is falling towards the pivot and could bounce to the 1st resistance.
Pivot: 0.45870
1st Support: 0.45520
1st Resistance: 0.46664
Disclaimer:
The opinions given above constitute general market commentary and do not constitute the opinion or advice of IC Markets or any form of personal or investment advice.
Any opinions, news, research, analyses, prices, other information, or links to third-party sites contained on this website are provided on an "as-is" basis, are intended to be informative only, and are not advice, a recommendation, research, a record of our trading prices, an offer of, or solicitation for, a transaction in any financial instrument and thus should not be treated as such. The information provided does not involve any specific investment objectives, financial situation, or needs of any specific person who may receive it. Please be aware that past performance is not a reliable indicator of future performance and/or results. Past performance or forward-looking scenarios based upon the reasonable beliefs of the third-party provider are not a guarantee of future performance. Actual results may differ materially from those anticipated in forward-looking or past performance statements. IC Markets makes no representation or warranty and assumes no liability as to the accuracy or completeness of the information provided, nor any loss arising from any investment based on a recommendation, forecast, or any information supplied by any third party

GBPUSD: bullish breakout🛠 Technical Analysis: On the 4-hour timeframe, GBPUSD has decisively broken out of a long-term descending channel, signaling a major trend reversal. The price has reclaimed the moving averages and is currently consolidating above the 1.3300 level, forming a bullish continuation structure. A successful breakout above the immediate resistance at 1.3350 confirms the bullish momentum, targeting the next liquidity zone around 1.3476.
———————————————
❗️ Trade Parameters (BUY)
———————————————
➡️ Entry Point: Buy on the confirmed breakout (approx. 1.3340 – 1.3350)
🎯 Take Profit: 1.3476 (key resistance)
🔴 Stop Loss: Below the recent consolidation and support zone (approx. 1.3249)
⚠️ Disclaimer: This is a potential trade idea based on current analysis; market conditions and price direction are subject to change based on news factors and volatility.

NZDCHF Technical Analysis! BUY!
My dear friends,
My technical analysis for NZDCHF is below:
The market is trading on 0.4629 pivot level.
Bias - Bullish
Technical Indicators: Both Super Trend & Pivot HL indicate a highly probable Bullish continuation.
Target - 0.4649
About Used Indicators:
A pivot point is a technical analysis indicator, or calculations, used to determine the overall trend of the market over different time frames.
Disclosure: I am part of Trade Nation's Influencer program and receive a monthly fee for using their TradingView charts in my analysis.
———————————
WISH YOU ALL LUCK

NZDJPY.Bullish Momentum Builds — Pullback or Lift-Off? After breaking above the 89.70 – 88.98 support zone, NZDJPY has entered a sustained bullish structure. Price stabilization above this zone shows strong buyer control, and any correction toward this area may act as a bullish pullback to retest support. 🟩📈
Price is now approaching the 91.94 – 92.33 resistance zone, an area that has shown significant reactions in the past. This level represents the first major challenge for buyers. A clean breakout above this resistance could open the path toward the key weekly resistance at 94.33, which may become the main target for mid-term bulls. 🔥
🎯 Potential Scenarios
1️⃣ Bullish Continuation (Primary Scenario)
If price breaks and holds above 92.33 with strong momentum, NZDJPY is likely to continue its upward trajectory toward higher resistance levels. The market structure remains clearly bullish.
2️⃣ Pullback Toward Support (Corrective Scenario)
If price fails to break the current resistance, a retracement toward the 89.70 – 88.98 support zone becomes likely. Such a correction could provide a new buying opportunity with a higher low formation. 📉➡️📈
⚠️ Risk Disclaimer
This analysis reflects personal opinion only and does not constitute financial advice or a buy/sell signal. Please apply proper risk management and follow your own trading plan. I am not responsible for any potential profits or losses. ⚠️
❓ What Do You Think?
Will NZDJPY break resistance first or drop for a deeper pullback?
Share your thoughts in the comments! 📊💬

#044: SHORT Investment Opportunity on NZD/CHF
The exchange rate displays a typical pattern of distributional movements that institutions use to unload positions in areas of high liquidity. After an orderly bullish extension, the market executed a classic stop-gathering move above the most recent highs, leaving a trail of excess that lacks continuity in volume or directional direction.
The immediate reaction following the manipulation was characterized by indecision candles and a progressive loss of momentum, with lower highs signaling an exhaustion of buying pressure. This behavior is consistent with a market context in which the bullish momentum is not supported by institutional participation, but rather by late retail entries.
Sentiment, in fact, highlights a strong concentration of long positions by the public, a condition that historically predicts movements in the opposite direction. Institutions tend to exploit this dynamic to build bearish positions while the market remains anchored to unwarranted euphoria. In this case, the technical structure and psychological positioning of participants converge toward a well-defined bearish bias.
The upper zone, where the price has repeatedly reacted, represents a significant supply zone: each return to that range highlights effective selling and a lack of follow-through by buyers. The momentum that followed the manipulation failed to generate a true breakout, confirming that strong hands have no interest in sustaining a bullish continuation.
On the intermarket level, the relative strength of the Swiss franc and the cautious macro environment further reinforce the bearish scenario. The market tends to reward safe-haven currencies during periods of risk contraction, while more cyclical currencies exhibit structural weakness.

NZDUSD H4 | Bullish Continuation?Momentum: Bullish
The price is falling towards the buy entry which aligns with the 23.6% Fibonacci retracement and also trading above the Ichimoku cloud, adding significant strength to this level.
Buy entry: 0.5742
Overlap support
23.6% Fiboncci retracement
Stop loss: 0.5707
Pullback support
38.2% Fibonacci retracement
Take profit: 0.5768
Multi swing high resistance
High Risk Investment Warning
Stratos Markets Limited (tradu.com ), Stratos Europe Ltd (tradu.com ):
CFDs are complex instruments and come with a high risk of losing money rapidly due to leverage. 70% of retail investor accounts lose money when trading CFDs with this provider. You should consider whether you understand how CFDs work and whether you can afford to take the high risk of losing your money.
Stratos Global LLC (tradu.com ): Losses can exceed deposits.
Please be advised that the information presented on TradingView is provided to Tradu (‘Company’, ‘we’) by a third-party provider (‘TFA Global Pte Ltd’). Please be reminded that you are solely responsible for the trading decisions on your account. Any information and/or content is intended entirely for research, educational and informational purposes only and does not constitute investment or consultation advice or investment strategy. The information is not tailored to the investment needs of any specific person and therefore does not involve a consideration of any of the investment objectives, financial situation or needs of any viewer that may receive it. Past performance is not a reliable indicator of future results. Actual results may differ materially from those anticipated in forward-looking or past performance statements. We assume no liability as to the accuracy or completeness of any of the information and/or content provided herein and the Company cannot be held responsible for any omission, mistake nor for any loss or damage including without limitation to any loss of profit which may arise from reliance on any information supplied by TFA Global Pte Ltd.

Bearish reversal?AUD/NZD is reacting off the pivot which is a pullback resistance and could reverse to the overlap support.
Pivot: 1.15142
1st Support: 1.14533
1st Resistance: 1.15608
Disclaimer:
The opinions given above constitute general market commentary and do not constitute the opinion or advice of IC Markets or any form of personal or investment advice.
Any opinions, news, research, analyses, prices, other information, or links to third-party sites contained on this website are provided on an "as-is" basis, are intended to be informative only, and are not advice, a recommendation, research, a record of our trading prices, an offer of, or solicitation for, a transaction in any financial instrument and thus should not be treated as such. The information provided does not involve any specific investment objectives, financial situation, or needs of any specific person who may receive it. Please be aware that past performance is not a reliable indicator of future performance and/or results. Past performance or forward-looking scenarios based upon the reasonable beliefs of the third-party provider are not a guarantee of future performance. Actual results may differ materially from those anticipated in forward-looking or past performance statements. IC Markets makes no representation or warranty and assumes no liability as to the accuracy or completeness of the information provided, nor any loss arising from any investment based on a recommendation, forecast, or any information supplied by any third party

NZDCHF CHANNEL BREAKOUT|SHORT|
✅NZDCHF has broken down out of the rising channel after running buy-side liquidity at the highs, showing clear ICT displacement and a shift in order-flow toward discount levels. Price is now drawing toward the next sell-side pocket near the target zone. Time Frame 2H.
SHORT🔥
✅Like and subscribe to never miss a new idea!✅

NZDUSD to find buyers at market price?NZDUSD - 24h expiry
There is no clear indication that the upward move is coming to an end.
Although we remain bullish overall, a correction is possible with plenty of room to move lower without impacting the trend higher.
Risk/Reward would be poor to call a buy from current levels.
A move through 0.5800 will confirm the bullish momentum.
The measured move target is 0.5875.
We look to Buy at 0.5775 (stop at 0.5740)
Our profit targets will be 0.5850 and 0.5875
Resistance: 0.5800 / 0.5825 / 0.5850
Support: 0.5775 / 0.5750 / 0.5725
Risk Disclaimer
The trade ideas beyond this page are for informational purposes only and do not constitute investment advice or a solicitation to trade. This information is provided by Signal Centre, a third-party unaffiliated with OANDA, and is intended for general circulation only. OANDA does not guarantee the accuracy of this information and assumes no responsibilities for the information provided by the third party. The information does not take into account the specific investment objectives, financial situation, or particular needs of any particular person. You should take into account your specific investment objectives, financial situation, and particular needs before making a commitment to trade, including seeking, under a separate engagement, as you deem fit.
You accept that you assume all risks in independently viewing the contents and selecting a chosen strategy.
Where the research is distributed in Singapore to a person who is not an Accredited Investor, Expert Investor or an Institutional Investor, Oanda Asia Pacific Pte Ltd (“OAP“) accepts legal responsibility for the contents of the report to such persons only to the extent required by law. Singapore customers should contact OAP at 6579 8289 for matters arising from, or in connection with, the information/research distributed.

Bullish bounce?NZD/CAD has bounced off the pivot, a pullback support that aligns with the 38.2% Fibonacci retracement, and could rise to the 1st resistance.
Pivot: 0.7977
1st Support: 0.7943
1st Resistance: 0.8063
Disclaimer:
The opinions given above constitute general market commentary and do not constitute the opinion or advice of IC Markets or any form of personal or investment advice.
Any opinions, news, research, analyses, prices, other information, or links to third-party sites contained on this website are provided on an "as-is" basis, are intended to be informative only, and are not advice, a recommendation, research, a record of our trading prices, an offer of, or solicitation for, a transaction in any financial instrument and thus should not be treated as such. The information provided does not involve any specific investment objectives, financial situation, or needs of any specific person who may receive it. Please be aware that past performance is not a reliable indicator of future performance and/or results. Past performance or forward-looking scenarios based upon the reasonable beliefs of the third-party provider are not a guarantee of future performance. Actual results may differ materially from those anticipated in forward-looking or past performance statements. IC Markets makes no representation or warranty and assumes no liability as to the accuracy or completeness of the information provided, nor any loss arising from any investment based on a recommendation, forecast, or any information supplied by any third party

buy nzdcadthere was an entry yesterday but i was scared to enter. lol. today presents itself with another opportunity. bet responsibly and all the best. risk to reward is 1:3

GBPNZD: Bullish Forecast & Bullish Scenario
Balance of buyers and sellers on the GBPNZD pair, that is best felt when all the timeframes are analyzed properly is shifting in favor of the buyers, therefore is it only natural that we go long on the pair.
Disclosure: I am part of Trade Nation's Influencer program and receive a monthly fee for using their TradingView charts in my analysis.
❤️ Please, support our work with like & comment! ❤️
